Chiến lược nắm bắt điểm thấp dựa trên hồi quy tuyến tính sửa chữa Vix
Tổng quan
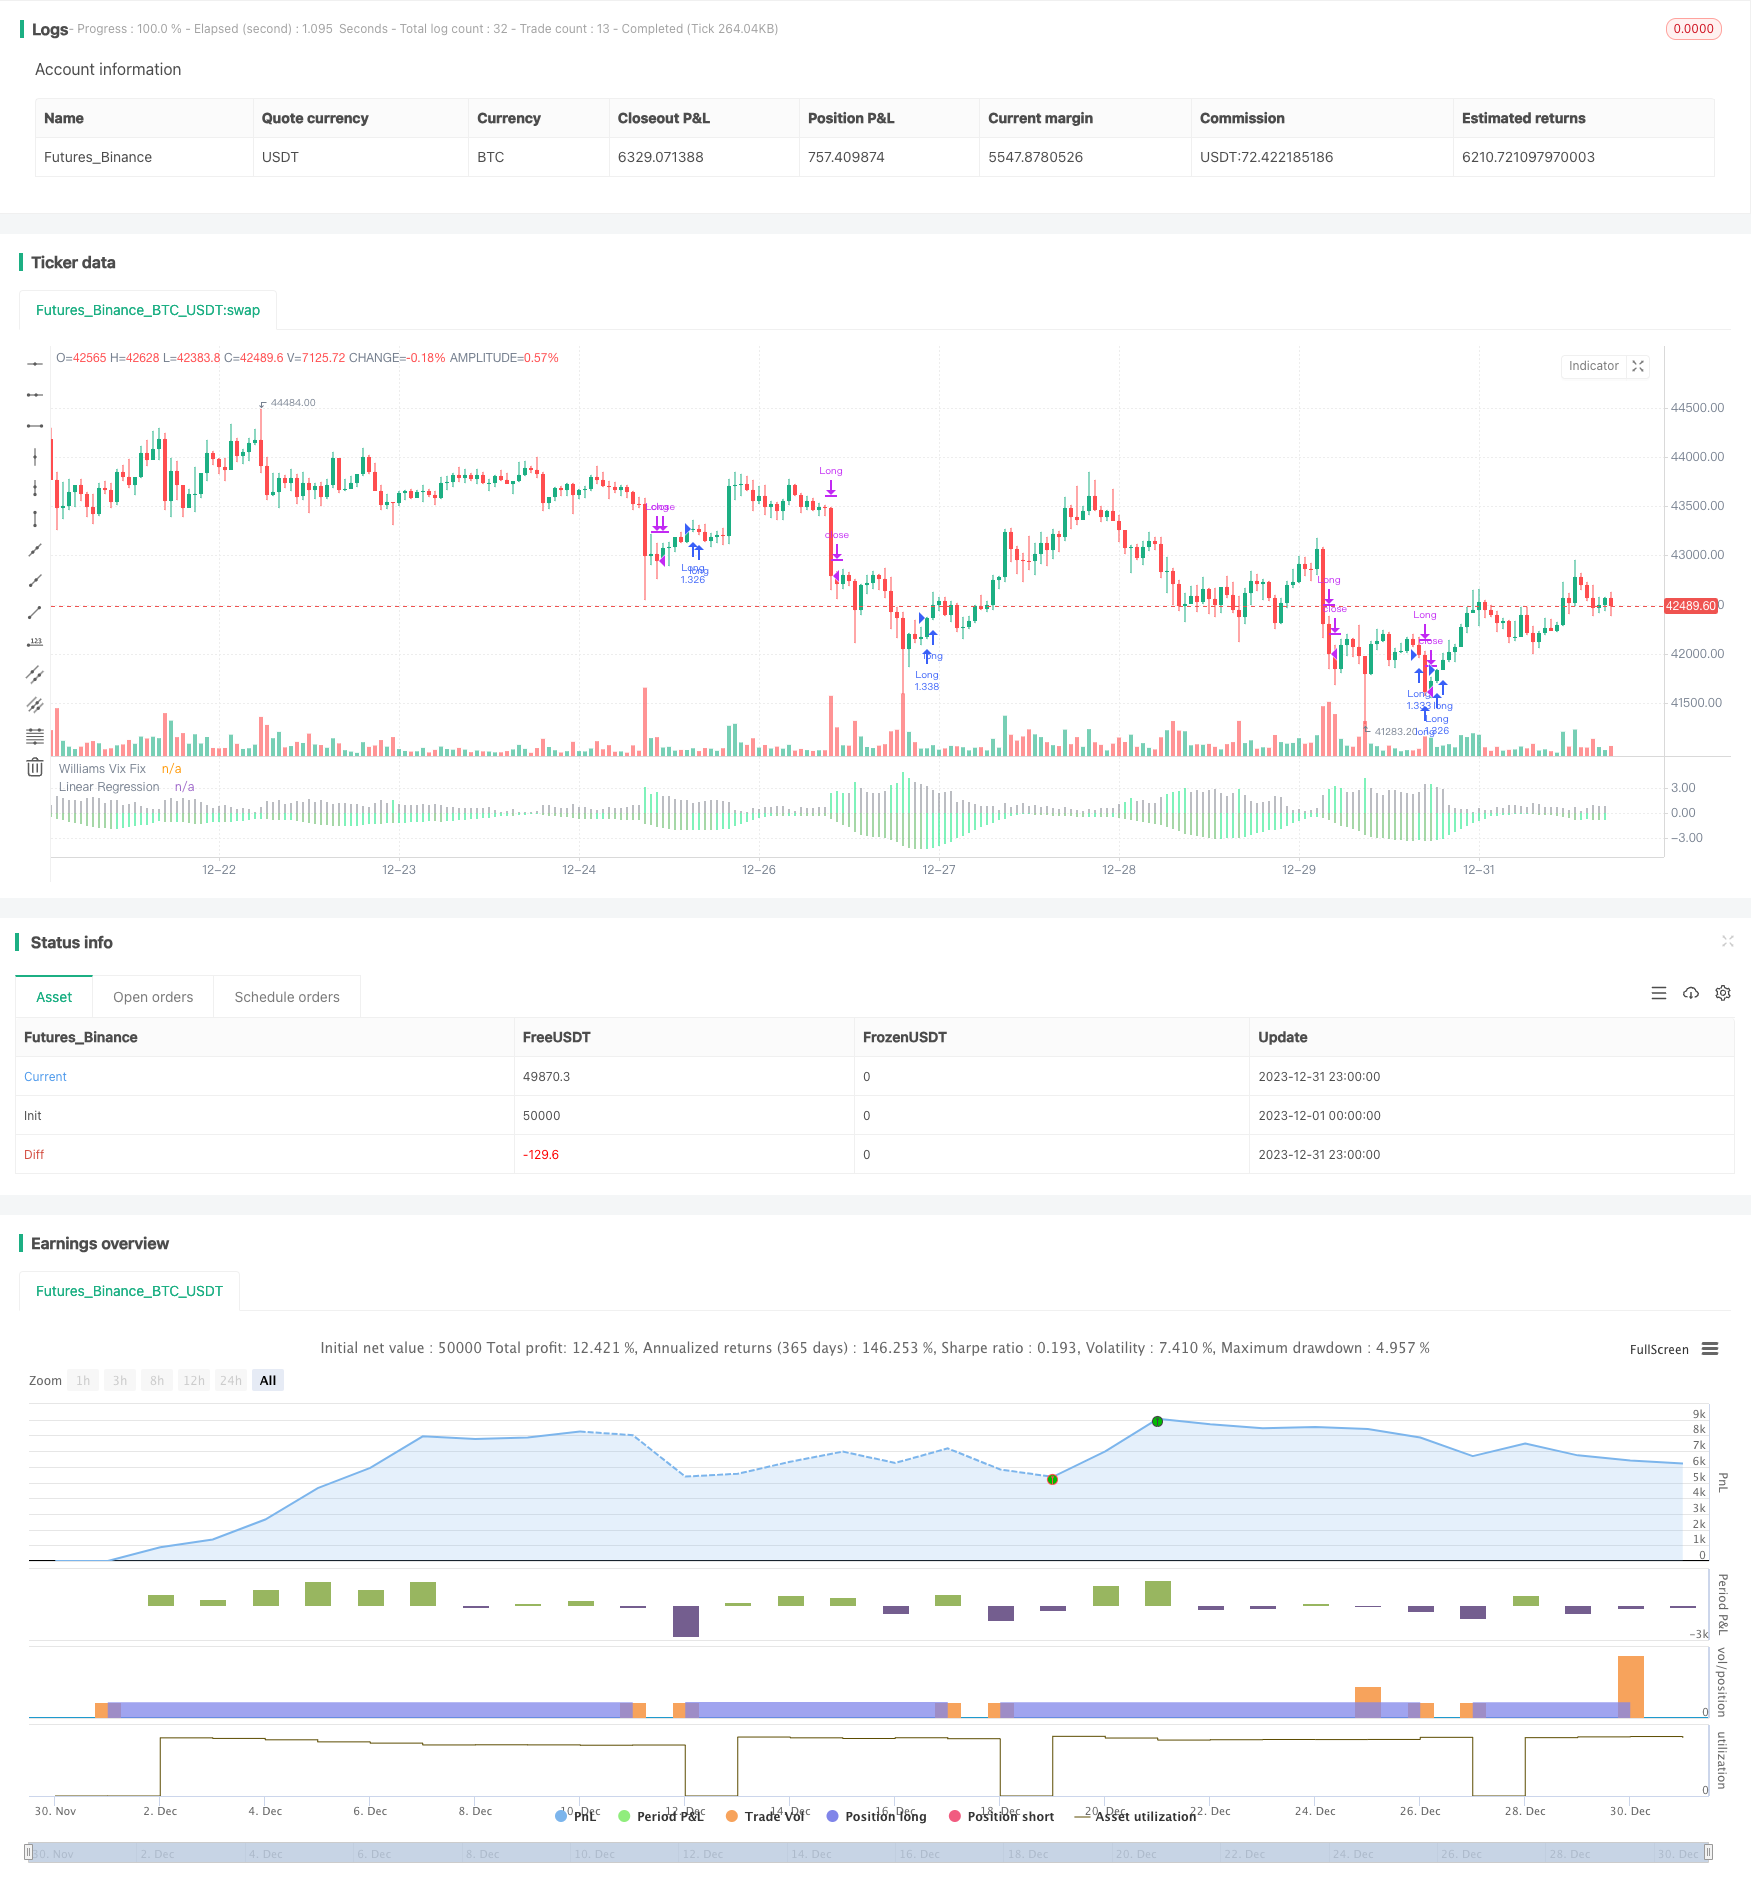
Ý tưởng cốt lõi của chiến lược này là kết hợp chỉ số sửa chữa Wix và sự hồi phục tuyến tính của nó, để nắm bắt chính xác các điểm thấp của thị trường. Chiến lược được gọi là Chiến lược sửa chữa điểm thấp của sự hồi phục tuyến tính.
Nguyên tắc chiến lược
- Tính toán chỉ số sửa chữa của Wix, nó có thể đánh giá tốt hơn các điểm thấp của thị trường
- Sử dụng Linear Regression đối với chỉ số sửa chữa của Wix. Khi màu sắc của biểu đồ Regression trở thành màu xanh lá cây, cho thấy Regression của Wix đã bắt đầu tăng lên, bạn có thể gửi tín hiệu mua
- Thêm vào đó, bạn có thể thêm vào một cột màu xanh trong chỉ số sửa chữa Wix để xác nhận thời gian mua.
- Khi histogram hồi quy tuyến tính chuyển sang màu đỏ, cho thấy Wix sửa chữa hồi quy tuyến tính bắt đầu giảm, phát ra tín hiệu bán
Quy trình trên sử dụng sự hồi quy tuyến tính để cải thiện độ chính xác và kịp thời của tín hiệu chỉ số sửa chữa Wix, lọc ra một số tín hiệu giả để nắm bắt chính xác điểm thấp.
Phân tích lợi thế
- Chiến lược sử dụng bộ lọc hồi quy tuyến tính để lọc các tín hiệu giả một phần của chỉ số sửa chữa Wix, làm cho tín hiệu mua / bán chính xác và đáng tin cậy hơn
- Phản hồi tuyến tính làm tăng độ nhạy và kịp thời của tín hiệu, có thể nhanh chóng nắm bắt các điểm biến động của thị trường
- Chiến lược logic đơn giản, rõ ràng, dễ hiểu thực hiện, phù hợp với giao dịch số lượng
- Có nhiều tham số có thể cấu hình, có thể điều chỉnh linh hoạt để thích ứng với sự thay đổi của thị trường
Rủi ro và giải pháp
- Chiến lược này chủ yếu được sử dụng để xác định điểm thấp của thị trường tổng thể, không phù hợp với các cổ phiếu cá nhân
- Linear regression không hoàn toàn có thể lọc các tín hiệu giả, kết hợp với chỉ số sửa chữa Wix có thể làm giảm nguy cơ
- Cần điều chỉnh các tham số phù hợp để thích ứng với sự thay đổi của thực tế, tránh bị mất hiệu lực
- Khuyến nghị sử dụng kết hợp với các chỉ số khác để xác nhận thêm tín hiệu
Hướng tối ưu hóa
- Có thể xem xét kết hợp với chỉ số dao động hoặc chỉ số năng lượng, để lọc thêm tín hiệu
- Có thể nghiên cứu các phương pháp tối ưu hóa tùy biến để làm cho chiến lược thông minh hơn
- Có thể khám phá các phương pháp học máy, sử dụng các mô hình phức tạp hơn để dự đoán xu hướng sửa chữa của Wix
- Một phương pháp tương tự có thể được thử nghiệm trên các cổ phiếu cá nhân để nghiên cứu cách lọc các tín hiệu giả.
Tóm tắt
Chiến lược này sử dụng Wix để sửa chỉ số để xác định điểm thấp, đồng thời giới thiệu hồi quy tuyến tính để cải thiện chất lượng tín hiệu, do đó có thể nắm bắt hiệu quả các điểm thấp của thị trường. Chiến lược này đơn giản và thực tế, kết quả là lý tưởng, rủi ro chính là không lọc hoàn toàn các tín hiệu giả. Chúng tôi vẫn cần tối ưu hóa các thiết lập tham số và xem xét giới thiệu các phương tiện khác để xác nhận tín hiệu hơn nữa, làm cho chiến lược trở nên hoàn hảo hơn.
/*backtest
start: 2023-12-01 00:00:00
end: 2023-12-31 23:59:59
period: 1h
basePeriod: 15m
exchanges: [{"eid":"Futures_Binance","currency":"BTC_USDT"}]
*/

// This source code is subject to the terms of the Mozilla Public License 2.0 at https://mozilla.org/MPL/2.0/
// © HeWhoMustNotBeNamed

//@version=4
strategy("VixFixLinReg-Strategy", shorttitle="VixFixLinReg - Strategy",
                     overlay=false, initial_capital = 100000,
                     default_qty_type = strategy.percent_of_equity, default_qty_value = 100, commission_type = strategy.commission.percent, pyramiding = 1,
                     commission_value = 0.01)
pd = input(22, title="LookBack Period Standard Deviation High")
bbl = input(20, title="Bolinger Band Length")
mult = input(2.0    , minval=1, maxval=5, title="Bollinger Band Standard Devaition Up")
lb = input(50  , title="Look Back Period Percentile High")
ph = input(.85, title="Highest Percentile - 0.90=90%, 0.95=95%, 0.99=99%")
pl = input(1.01, title="Lowest Percentile - 1.10=90%, 1.05=95%, 1.01=99%")
hp = input(false, title="Show High Range - Based on Percentile and LookBack Period?")
sd = input(false, title="Show Standard Deviation Line?")
i_startTime = input(defval = timestamp("01 Jan 2010 00:00 +0000"), title = "Start Time", type = input.time)
i_endTime = input(defval = timestamp("01 Jan 2099 00:00 +0000"), title = "End Time", type = input.time)
inDateRange = true
considerVIXFixClose = input(false)
lengthKC=input(20, title="KC Length")
multKC = input(1.5, title="KC MultFactor")

atrLen = input(22)
atrMult = input(5)
initialStopBar = input(5)
waitForCloseBeforeStop = input(true)
f_getStop(atrLen, atrMult)=>
    stop = strategy.position_size > 0 ? close - (atrMult * atr(atrLen)) : lowest(initialStopBar)
    stop := strategy.position_size > 0 ? max(stop,nz(stop[1], stop)) : lowest(initialStopBar)
    stop

wvf = ((highest(close, pd)-low)/(highest(close, pd)))*100

sDev = mult * stdev(wvf, bbl)
midLine = sma(wvf, bbl)
lowerBand = midLine - sDev
upperBand = midLine + sDev

rangeHigh = (highest(wvf, lb)) * ph
rangeLow = (lowest(wvf, lb)) * pl


col = wvf >= upperBand or wvf >= rangeHigh ? color.lime : color.gray

val = linreg(wvf, pd, 0)
absVal = abs(val)

linRegColor = val>val[1]? (val > 0 ? color.green : color.orange): (val > 0 ? color.lime : color.red)
plot(hp and rangeHigh ? rangeHigh : na, title="Range High Percentile", style=plot.style_line, linewidth=4, color=color.orange)
plot(hp and rangeLow ? rangeLow : na, title="Range High Percentile", style=plot.style_line, linewidth=4, color=color.orange)
plot(wvf, title="Williams Vix Fix", style=plot.style_histogram, linewidth = 4, color=col)
plot(sd and upperBand ? upperBand : na, title="Upper Band", style=plot.style_line, linewidth = 3, color=color.aqua)

plot(-absVal, title="Linear Regression", style=plot.style_histogram, linewidth=4, color=linRegColor)

vixFixState = (col == color.lime) ? 1: 0
vixFixState := strategy.position_size == 0? max(vixFixState, nz(vixFixState[1],0)) : vixFixState

longCondition = (vixFixState == 1 and linRegColor == color.lime) and inDateRange
exitLongCondition = (linRegColor == color.orange or linRegColor == color.red) and considerVIXFixClose

stop = f_getStop(atrLen, atrMult)
label_x = time+(60*60*24*1000*20)
myLabel = label.new(x=label_x, y=0, text="Stop : "+tostring(stop), xloc=xloc.bar_time, style=label.style_none, textcolor=color.black, size=size.normal)
label.delete(myLabel[1])
strategy.entry("Long", strategy.long, when=longCondition, oca_name="oca_buy")
strategy.close("Long", when=exitLongCondition or (close < stop and waitForCloseBeforeStop and linRegColor == color.green))
strategy.exit("ExitLong", "Long", stop = stop, when=not waitForCloseBeforeStop and linRegColor == color.green)