Chiến lược giao dịch kết hợp của ba dải BB đóng đột phá và chỉ báo RSI
Tổng quan
Chiến lược này tạo ra tín hiệu giao dịch bằng cách kết hợp sử dụng chỉ số Brin và chỉ số RSI tương đối mạnh. Nó theo dõi xem giá đóng cửa của ba đường K có cùng lúc phá vỡ đường lên hoặc xuống đường không và kết hợp với chỉ số gearbox và RSI để xác nhận tín hiệu giao dịch.
Nguyên tắc chiến lược
Chiến lược này dựa trên các nguyên tắc sau:
- Sử dụng băng Brin dài 20 để xem xét phát ra tín hiệu giao dịch khi giá đóng cửa phá vỡ đường lên hoặc đường xuống
- Yêu cầu giá đóng cửa của ba đường K phá vỡ đồng thời để tránh phá vỡ giả
- Kết hợp với chỉ số bánh răng, VIP khi mua quá mạnh> 1.25, VIM khi bán quá mạnh> 1.25, tín hiệu lọc
- Kết hợp với chỉ số RSI để xác định xem có quá mua hay quá bán không, RSI trên 70 xem xét tháo lỗ, RSI dưới 30 xem xét tháo lỗ
- Khi đáp ứng các điều kiện trên, tạo ra tín hiệu làm nhiều hoặc làm trống
Phân tích lợi thế
Chiến lược này có những lợi thế chính như sau:
- Triple BB bands lọc giả phá vỡ, đảm bảo độ tin cậy của phá vỡ
- Chỉ số Gyros đánh giá sức mạnh của thị trường, tránh giao dịch bất lợi
- Chỉ số RSI đánh giá khu vực quá mua quá bán, kết hợp với chỉ số Bollinger Bands để vào
- Giao diện chỉ số đa dạng, đánh giá tổng hợp về tình hình thị trường, tín hiệu đáng tin cậy cao
Phân tích rủi ro
Chiến lược này cũng có một số rủi ro:
- Chỉ số Brin rất nhạy cảm với tham số, cần tối ưu hóa độ dài và StdDev
- Chỉ số gia tốc cũng nhạy cảm hơn với các tham số chu kỳ, cần điều chỉnh theo thị trường khác nhau
- Chỉ số RSI dễ bị lệch và có thể bỏ lỡ xu hướng
- Nếu có sự khác biệt về 3 chỉ số, bạn sẽ không thể tham gia và sẽ bỏ lỡ một số cơ hội.
Các biện pháp kiểm soát rủi ro bao gồm:
- Các tham số tối ưu hóa, tham số được kiểm tra có tỷ lệ thắng cao nhất
- Kết hợp với các chỉ số khác, chẳng hạn như lọc khối lượng giao dịch
- Giới hạn hợp lý trong việc đánh giá các chỉ số, tránh bỏ lỡ cơ hội
Hướng tối ưu hóa
Chiến lược này có thể được tối ưu hóa theo các khía cạnh sau:
- Tối ưu hóa chiều dài và StdDev của chỉ số Brin để tìm tham số tối ưu
- Tối ưu hóa chu kỳ của chỉ số gearbox để phù hợp hơn với các thị trường khác nhau
- Thêm các chỉ số khác, chẳng hạn như khối lượng giao dịch, macd, để tăng cường tín hiệu đa dạng
- Điều chỉnh logic phán đoán của chỉ số để tránh sự khác biệt trong chỉ số dẫn đến không thể nhập học
- Tăng chiến lược dừng lỗ để kiểm soát tổn thất tối đa trong một giao dịch
Tóm tắt
Chiến lược này sử dụng nhiều chỉ số để đánh giá tổng hợp, đồng thời đảm bảo độ tin cậy của tín hiệu, nhưng cũng có một số vấn đề. Bằng các phương tiện như tối ưu hóa tham số, làm phong phú nguồn tín hiệu, điều chỉnh logic phán đoán và dừng lỗ, bạn có thể tăng cường sự ổn định và lợi nhuận của chiến lược. Nó cung cấp một ý tưởng tốt cho giao dịch định lượng.
/*backtest
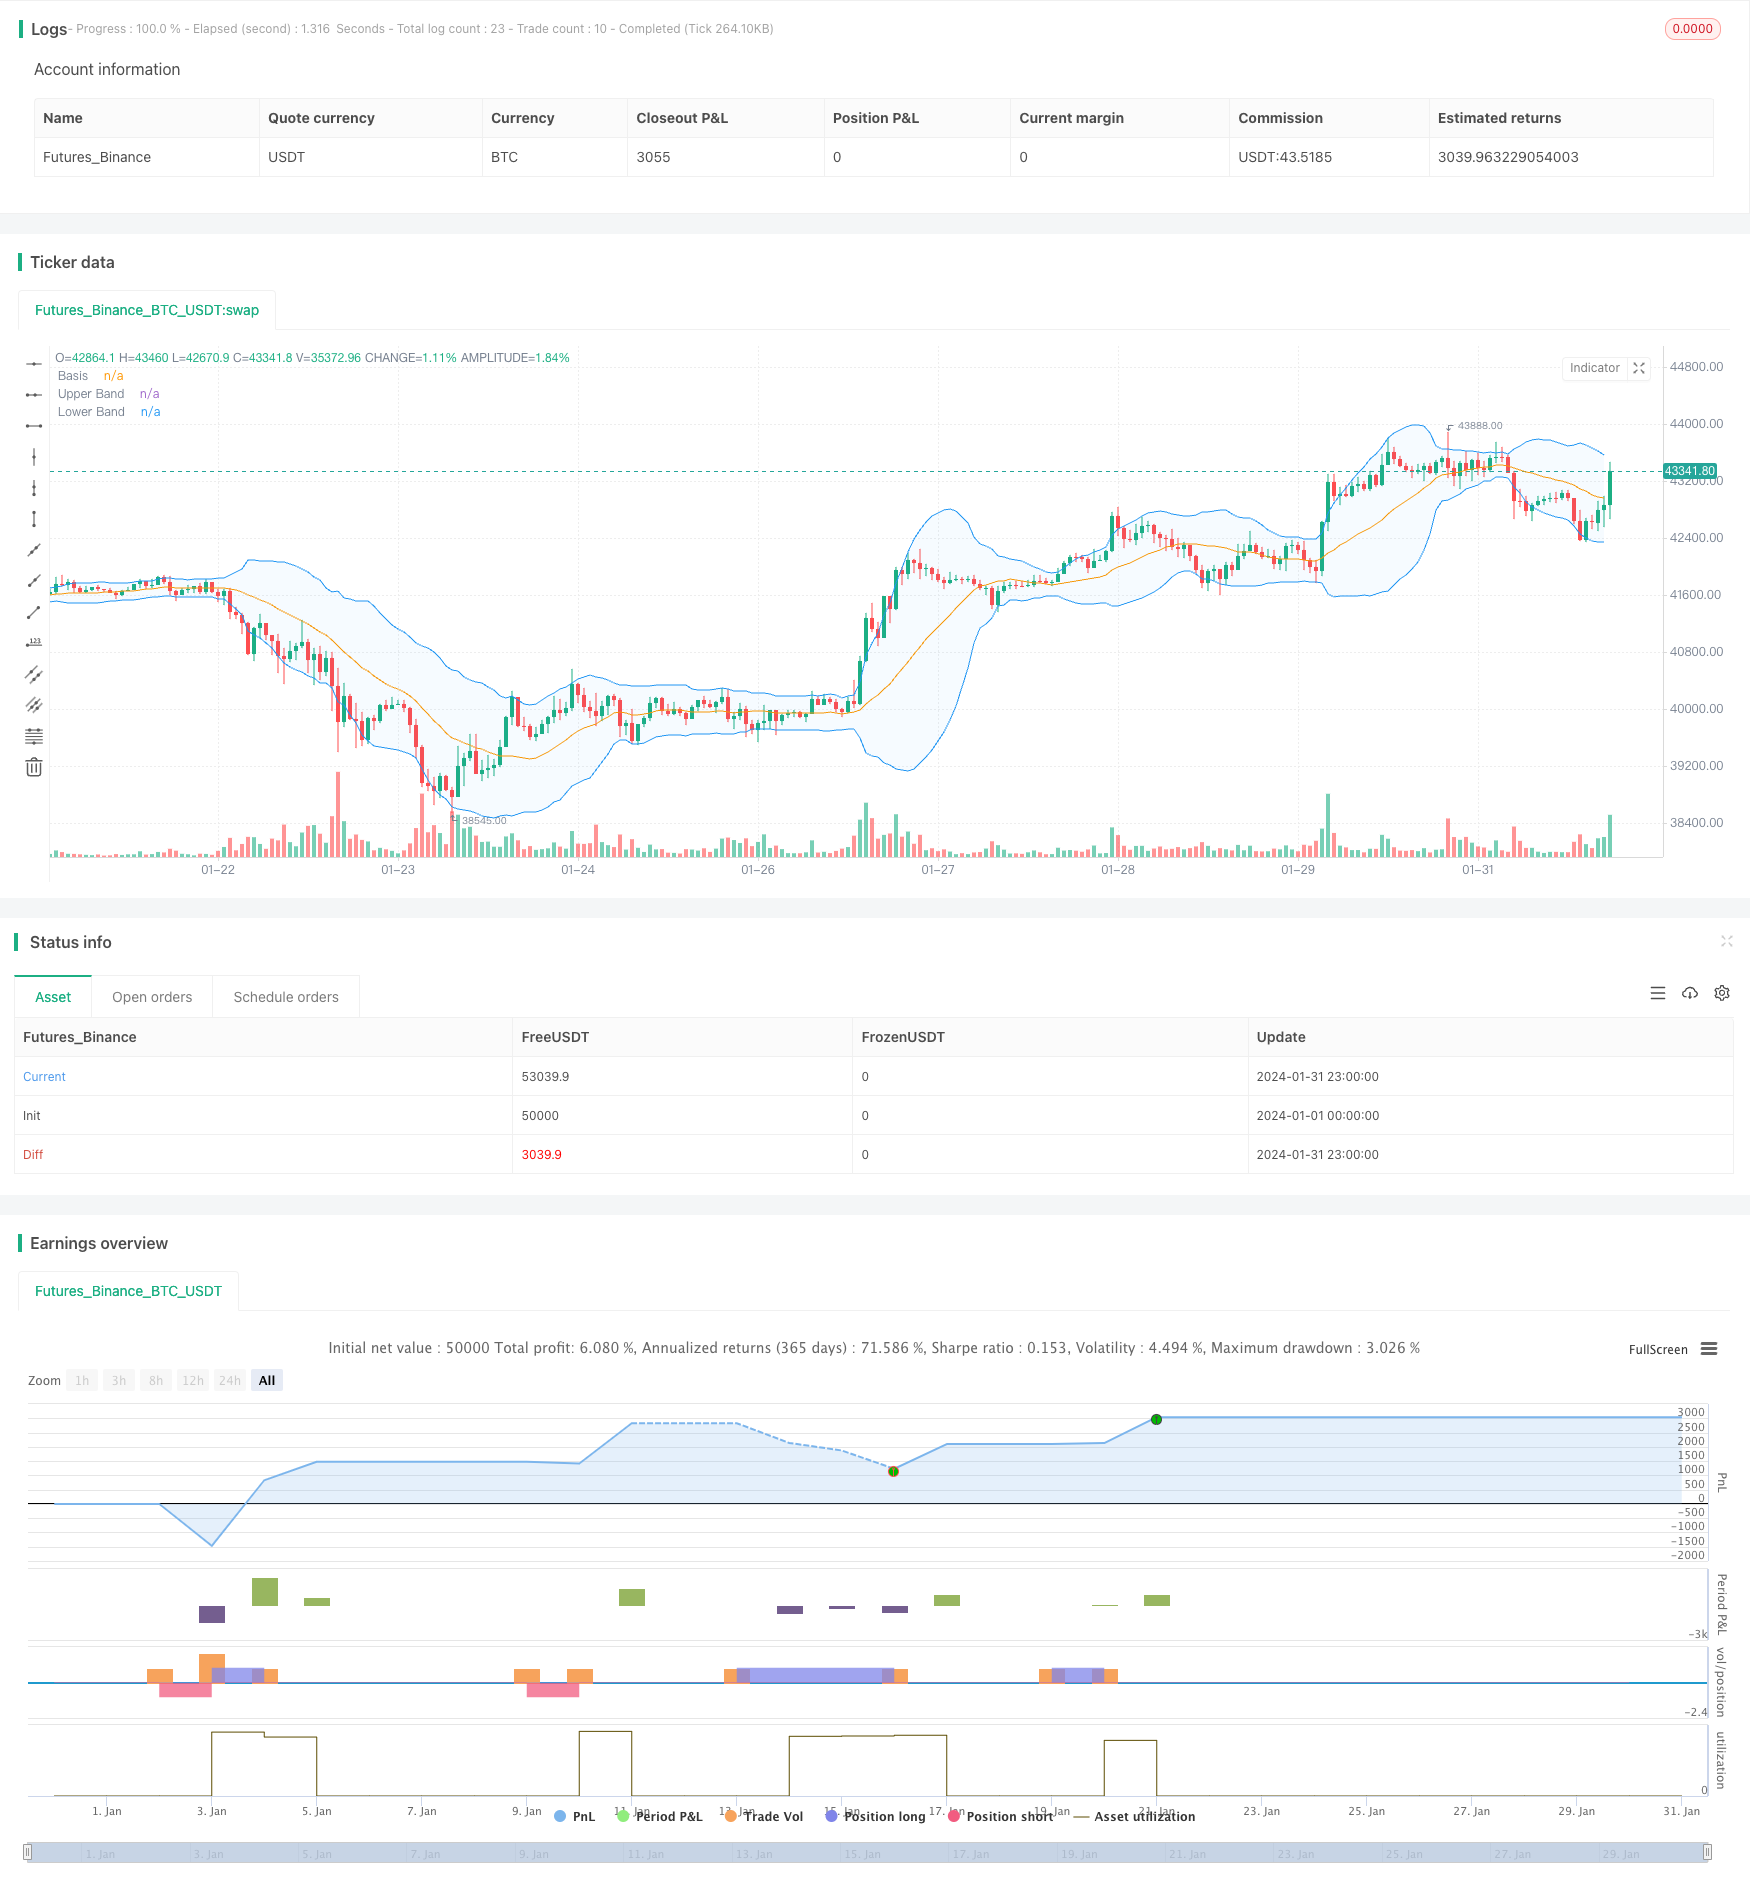
start: 2024-01-01 00:00:00
end: 2024-01-31 23:59:59
period: 1h
basePeriod: 15m
exchanges: [{"eid":"Futures_Binance","currency":"BTC_USDT"}]
*/
// This Pine Script™ code is subject to the terms of the Mozilla Public License 2.0 at https://mozilla.org/MPL/2.0/
// © Noway0utstorm
//@version=5
strategy(title='RSI + BB over 3 bar+--- vortex0.71.3 ', shorttitle='NoWaytruongphuthinh', format=format.price, precision=4,overlay = true)
length = input(20, title="Length")
mult = input(2.0, title="Multiplier")
source = close
basis = ta.sma(source, length)
dev = mult * ta.stdev(source, length)
upperBand = basis + dev
lowerBand = basis - dev
isClosedBar = ta.change(time("15"))
var bool closeAboveUpperBand = false
var bool closeBelowLowerBand = false
// Vortex Indicator Settings
period_ = input.int(14, title='Period', minval=2)
VMP = math.sum(math.abs(high - low[1]), period_)
VMM = math.sum(math.abs(low - high[1]), period_)
STR = math.sum(ta.atr(1), period_)
VIP = VMP / STR
VIM = VMM / STR
//
lengthrsi = input(14, title="RSI Length")
overboughtLevel = input(70, title="Overbought Level")
oversoldLevel = input(30, title="Oversold Level")
sourcersi = close
rsiValue = ta.rsi(sourcersi, lengthrsi)
shouldShort = rsiValue > overboughtLevel
shouldLong = rsiValue < oversoldLevel
if bool(isClosedBar[1]) and bool(isClosedBar[2]) and bool(isClosedBar[3])
if close[1] > upperBand[1] and close[2] > upperBand[2] and close[3] > upperBand[3] and VIP > 1.25 and VIM < 0.7 and rsiValue > overboughtLevel
strategy.entry("Short", strategy.short)
closeAboveUpperBand := false // Reset the condition when entering a new Short position
if close[1] < lowerBand[1] and close[2] < lowerBand[2] and close[3] < lowerBand[3] and VIP < 0.7 and VIM > 1.25 and rsiValue < oversoldLevel
strategy.entry("Long", strategy.long)
closeBelowLowerBand := false // Reset the condition when entering a new Long position
if strategy.position_size > 0 // Check if there is an open Long position
closeAboveUpperBand := close > upperBand // Update the condition based on close price
if closeAboveUpperBand
strategy.close("Long",disable_alert=true) // Close the Long position if close price is above upper band
if strategy.position_size < 0 // Check if there is an open Short position
closeBelowLowerBand := close < lowerBand // Update the condition based on close price
if closeBelowLowerBand
strategy.close("Short",disable_alert=true) // Close the Short position if close price is below lower band
// Plots
plot(basis, color=color.orange, title="Basis")
p1 = plot(upperBand, color=color.blue, title="Upper Band")
p2 = plot(lowerBand, color=color.blue, title="Lower Band")
fill(p1, p2, title = "Background", color=color.rgb(33, 150, 243, 95))