সেরা ট্রেডিংভিউ কৌশল
লেখক:চাওঝাং, তারিখ: ২০২২-০৫-০৯ ২১ঃ০৮ঃ১৭ট্যাগঃআরএসআইএমএ
এই স্ক্রিপ্ট সম্পূর্ণ গতি, ভলিউম এবং দামের উপর ভিত্তি করে। আমরা ব্যবহার করেছিঃ ১ঃ বোলিংজার ব্যান্ড কখন কোন প্রবণতা হতে পারে তা জানার জন্য চাপ দেয়। ২ঃ গতিশীল গড় (এসএমএ এবং ইএমএ) ব্যবহার করে দিকনির্দেশনা জানতে। ৩ঃ সফলতার হার এই কৌশলটির ৭৫% এর উপরে এবং যদি সামান্য দামের ক্রিয়াকলাপ যুক্ত করা হয় তবে এটি সহজে ৯০% সাফল্যের চিহ্ন অতিক্রম করতে পারে। ৪ঃ ড্রডাউন নিয়ে চিন্তা করবেন না, আমরা ট্রেইলিং এসএল বাস্তবায়ন করেছি, তাই আপনি একটু অতিরিক্ত ড্রডাউন দেখতে পারেন কিন্তু বাস্তবে এটি বেশ কম। ৫ঃ আমি নিজে ৪১ দিন ধরে ২৫০ ডলার অ্যাকাউন্টে এই কৌশলটি পরীক্ষা করেছি এবং এখন আমার ২৭০০ ডলার আছে।
ব্যাকটেস্ট
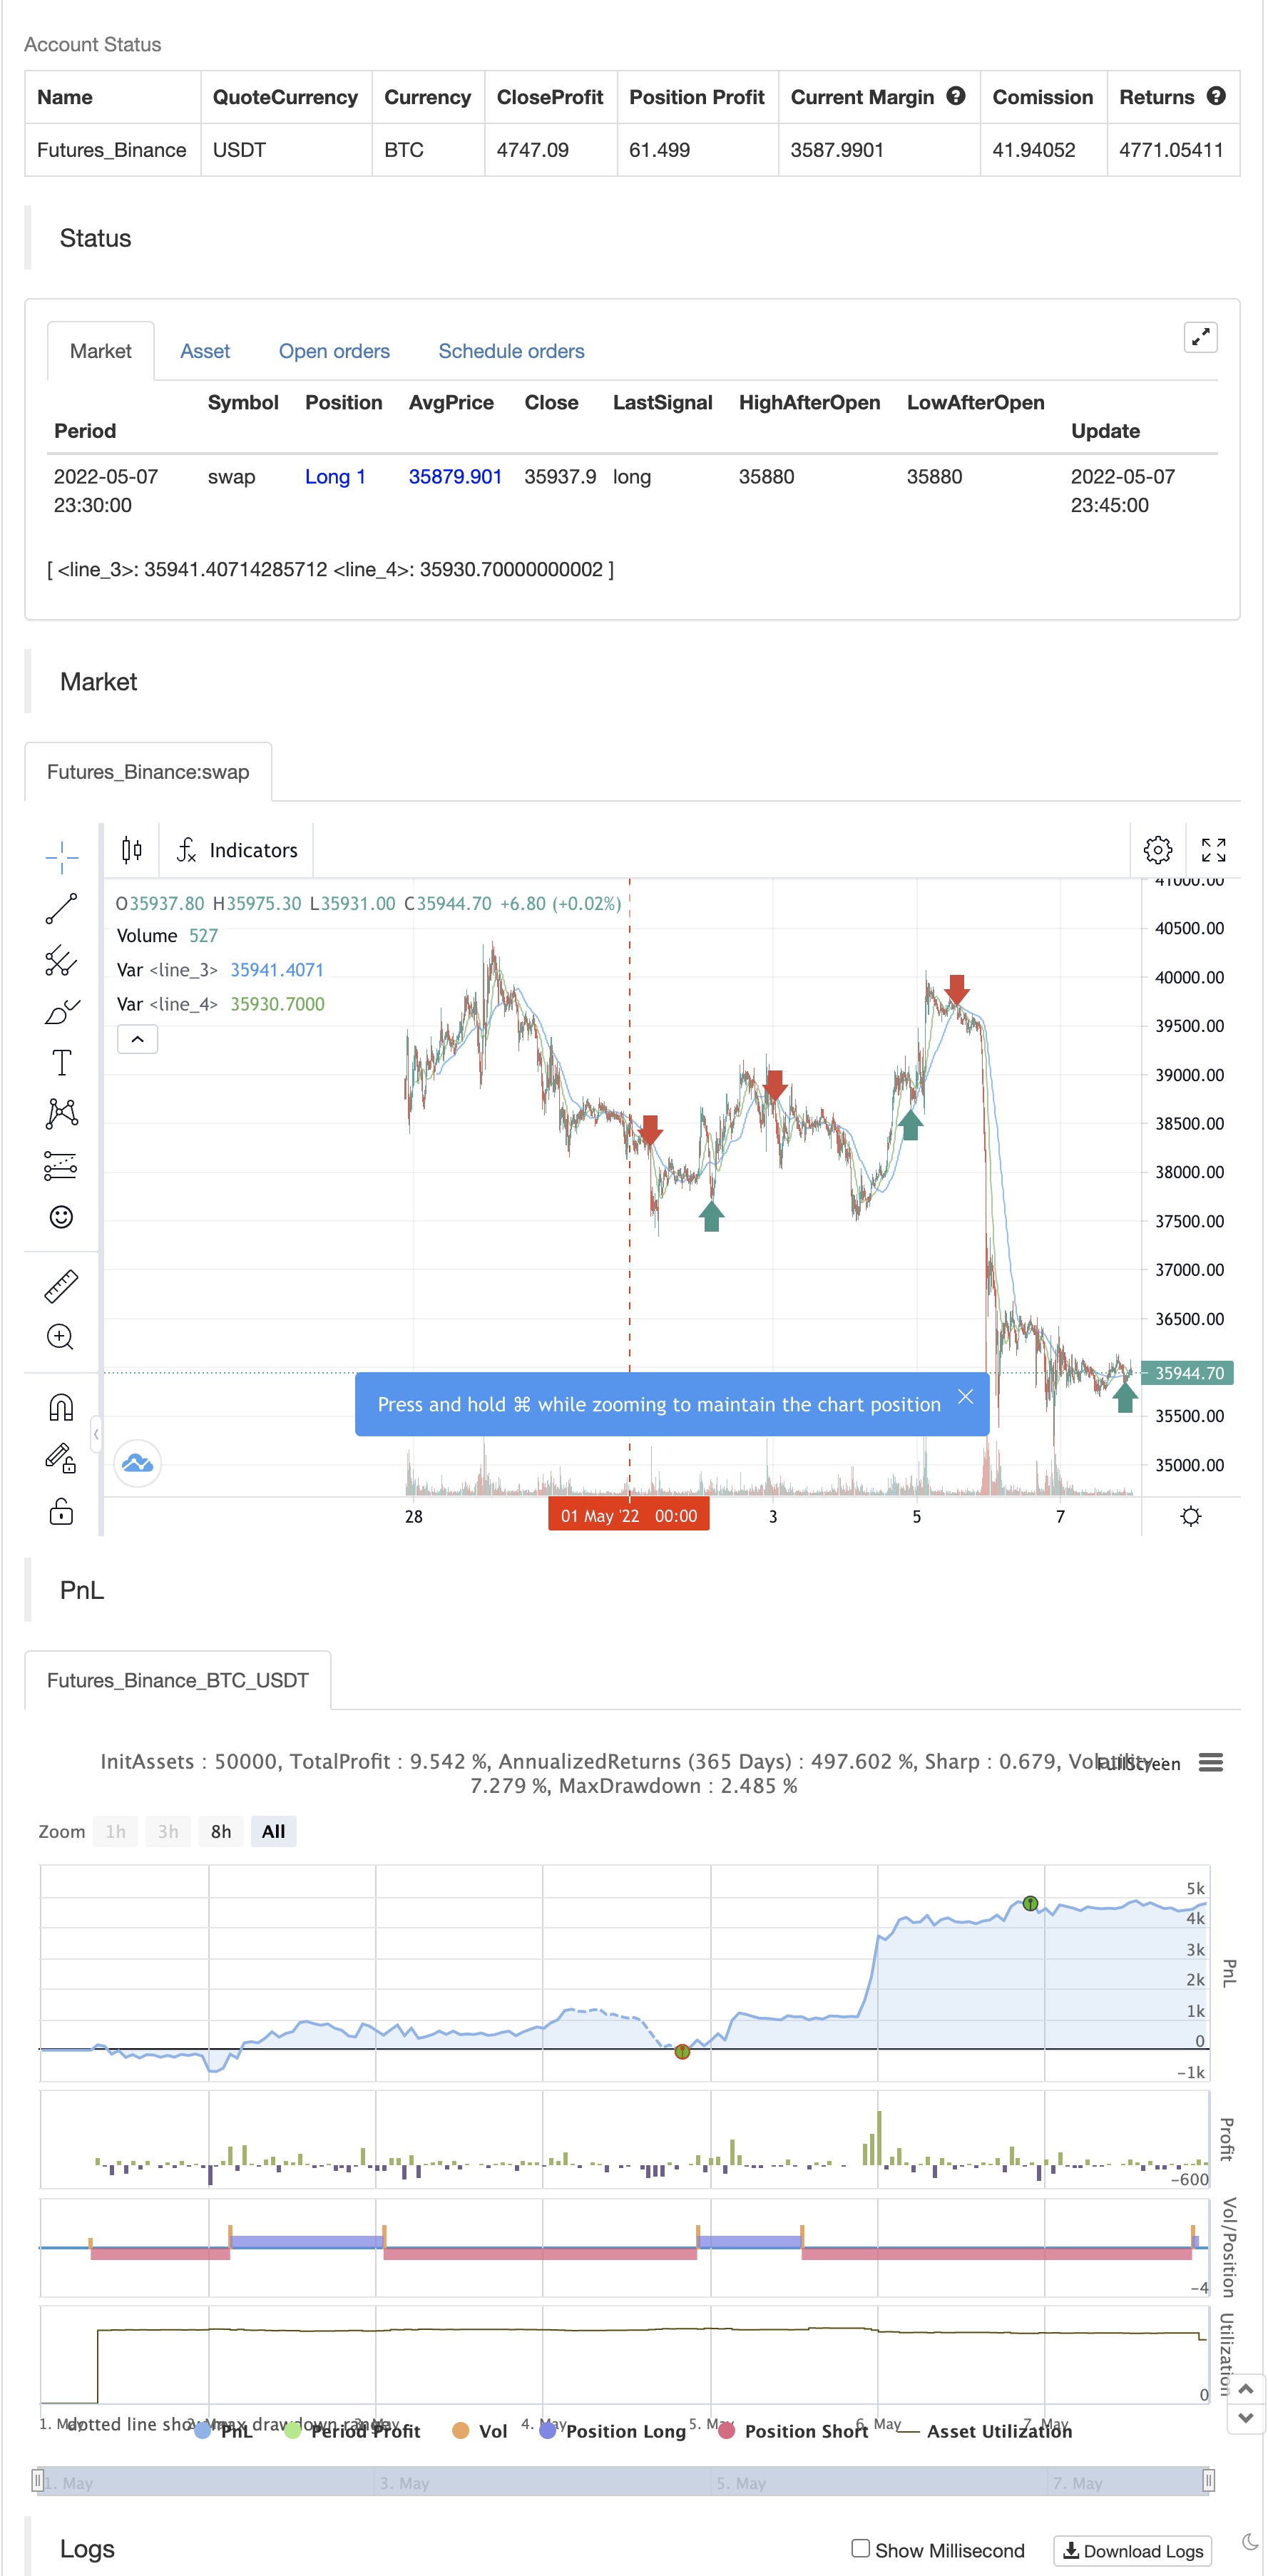
/*backtest
start: 2022-05-01 00:00:00
end: 2022-05-07 23:59:00
period: 15m
basePeriod: 5m
exchanges: [{"eid":"Bitfinex","currency":"BTC_USD"}]
*/

// This source code is subject to the terms of the Mozilla Public License 2.0 at https://mozilla.org/MPL/2.0/
// © The_Bigger_Bull
//@version=5
strategy("Best TradingView Strategy", overlay=true, margin_long=0, margin_short=0)
//Bollinger Bands
source1 = close
length1 = input.int(15, minval=1)
mult1 = input.float(2.0, minval=0.001, maxval=50)
basis1 = ta.sma(source1, length1)
dev1 = mult1 * ta.stdev(source1, length1)
upper1 = basis1 + dev1
lower1 = basis1 - dev1
//buyEntry = ta.crossover(source1, lower1)
//sellEntry = ta.crossunder(source1, upper1)

//RSI
ma(source, length, type) =>
    switch type
        "SMA" => ta.sma(source, length)
        "Bollinger Bands" => ta.sma(source, length)
        "EMA" => ta.ema(source, length)
        "SMMA (RMA)" => ta.rma(source, length)
        "WMA" => ta.wma(source, length)
        "VWMA" => ta.vwma(source, length)

rsiLengthInput = input.int(14, minval=1, title="RSI Length", group="RSI Settings")
rsiSourceInput = input.source(close, "Source", group="RSI Settings")
maTypeInput = input.string("SMA", title="MA Type", options=["SMA", "Bollinger Bands", "EMA", "SMMA (RMA)", "WMA", "VWMA"], group="MA Settings")
maLengthInput = input.int(14, title="MA Length", group="MA Settings")
bbMultInput = input.float(2.0, minval=0.001, maxval=50, title="BB StdDev", group="MA Settings")

up = ta.rma(math.max(ta.change(rsiSourceInput), 0), rsiLengthInput)
down = ta.rma(-math.min(ta.change(rsiSourceInput), 0), rsiLengthInput)
rsi = down == 0 ? 100 : up == 0 ? 0 : 100 - (100 / (1 + up / down))
rsiMA = ma(rsi, maLengthInput, maTypeInput)
isBB = maTypeInput == "Bollinger Bands"

//plot(rsi, "RSI", color=#7E57C2)
//plot(rsiMA, "RSI-based MA", color=color.yellow)
rsiUpperBand = hline(70, "RSI Upper Band", color=#787B86)
hline(50, "RSI Middle Band", color=color.new(#787B86, 50))
rsiLowerBand = hline(30, "RSI Lower Band", color=#787B86)
//fill(rsiUpperBand, rsiLowerBand, color=color.rgb(126, 87, 194, 90), title="RSI Background Fill")
bbUpperBand = plot(isBB ? rsiMA + ta.stdev(rsi, maLengthInput) * bbMultInput : na, title = "Upper Bollinger Band", color=color.green)
bbLowerBand = plot(isBB ? rsiMA - ta.stdev(rsi, maLengthInput) * bbMultInput : na, title = "Lower Bollinger Band", color=color.green)
//fill(bbUpperBand, bbLowerBand, color= isBB ? color.new(color.green, 90) : na, title="Bollinger Bands Background Fill")

//ADX

adxlen = input(14, title="ADX Smoothing")
dilen = input(14, title="DI Length")
dirmov(len) =>
	up1 = ta.change(high)
	down1 = -ta.change(low)
	plusDM = na(up1) ? na : (up1 > down1 and up1 > 0 ? up1 : 0)
	minusDM = na(down1) ? na : (down1 > up1 and down1 > 0 ? down1 : 0)
	truerange = ta.rma(ta.tr, len)
	plus = fixnan(100 * ta.rma(plusDM, len) / truerange)
	minus = fixnan(100 * ta.rma(minusDM, len) / truerange)
	[plus, minus]
adx(dilen, adxlen) =>
	[plus, minus] = dirmov(dilen)
	sum = plus + minus
	adx = 100 * ta.rma(math.abs(plus - minus) / (sum == 0 ? 1 : sum), adxlen)
sig = adx(dilen, adxlen)


out = ta.sma(close, 14)

sma1=ta.sma(close,42)

ema200=ta.ema(close,200)


longCondition = (out>sma1) and ta.crossover(source1, lower1)

if (longCondition )
    strategy.entry("long", strategy.long)

shortCondition = (out<sma1) and ta.crossunder(source1, lower1)

if (shortCondition )
    strategy.entry("short", strategy.short)


stopl=strategy.position_avg_price-50
tptgt=strategy.position_avg_price+100
stopshort=strategy.position_avg_price+50
tptgtshort=strategy.position_avg_price-100

strategy.exit("longclose","long",trail_offset=50,trail_points=100,when=ta.crossover(sma1,out))
strategy.exit("shortclose","short",trail_offset=50,trail_points=100,when=ta.crossover(out,sma1))


//if strategy.position_avg_price<0


plot(sma1 , color=color.blue)
plot(out, color=color.green)
//plot(ema200,color=color.red)
সম্পর্কিত
- মঙ্গলবারের টার্নআরাউন্ড কৌশল (উইকেন্ড ফিল্টার)
- RSI এবং MACD এর উপর ভিত্তি করে নিম্ন ঝুঁকিপূর্ণ স্থিতিশীল ক্রিপ্টোকারেন্সি উচ্চ ফ্রিকোয়েন্সি ট্রেডিং কৌশল
- চলমান গড় এবং আরএসআই-এর ব্যাপক ট্রেডিং কৌশল
- আলফা ট্রেডিংবট ট্রেডিং কৌশল
- কৌশল অনুসরণ করে মাল্টি-ইন্ডিকেটর ট্রেন্ড
- ডাবল এমএ এবং আরএসআই এর সংমিশ্রণ
- ইলিয়ট ওয়েভ থিওরি 4-9 ইমপলস ওয়েভ স্বয়ংক্রিয় সনাক্তকরণ ট্রেডিং কৌশল
- বোলিংজার + আরএসআই, ডাবল স্ট্র্যাটেজি v1.1
- আরএসআই এমটিএফ ওব+ও
- RSI পরিসংখ্যানগত সুইচিং কৌশল
আরো
- নিক স্টোক
- স্টোক সুপারট্রাড এট্রা 200 এমএ
- এমটিএফ আরএসআই ও স্টক কৌশল
- EMA + AROON + ASH
- ইম্পুটাম ২.০
- ইএইচএমএ রেঞ্জ কৌশল
- মুভিং গড় ক্রয়-বিক্রয়
- মিডাস এম কে ২ - চূড়ান্ত ক্রিপ্টো সুইং
- TMA-Legacy
- টিভি উচ্চ-নিম্ন কৌশল
- বিগ স্ন্যাপার সতর্কতা R3.0 + Chaiking Volatility condition + TP RSI
- চাঁদ ক্রোল স্টপ
- আরএসআই ক্রস স্ট্র্যাটেজি সহ সিসিআই + ইএমএ
- EMA ব্যান্ড + leledc + Bollinger ব্যান্ড ট্রেন্ড ক্যাচিং কৌশল
- আরএসআই এমটিএফ ওব+ও
- এমএসিডি উইলি কৌশল
- RSI - কিনুন বিক্রয় সংকেত
- হেকিন-আশি প্রবণতা
- HA বাজার পক্ষপাতিত্ব
- ইচিমোকু মেঘ মসৃণ দোলক