MacD-Anpassungsindicator - mehrfacher Zeitrahmen + alle verfügbaren Optionen!
Schriftsteller:ChaoZhang, Datum: 2022-05-06 20:46:48Tags:MACD
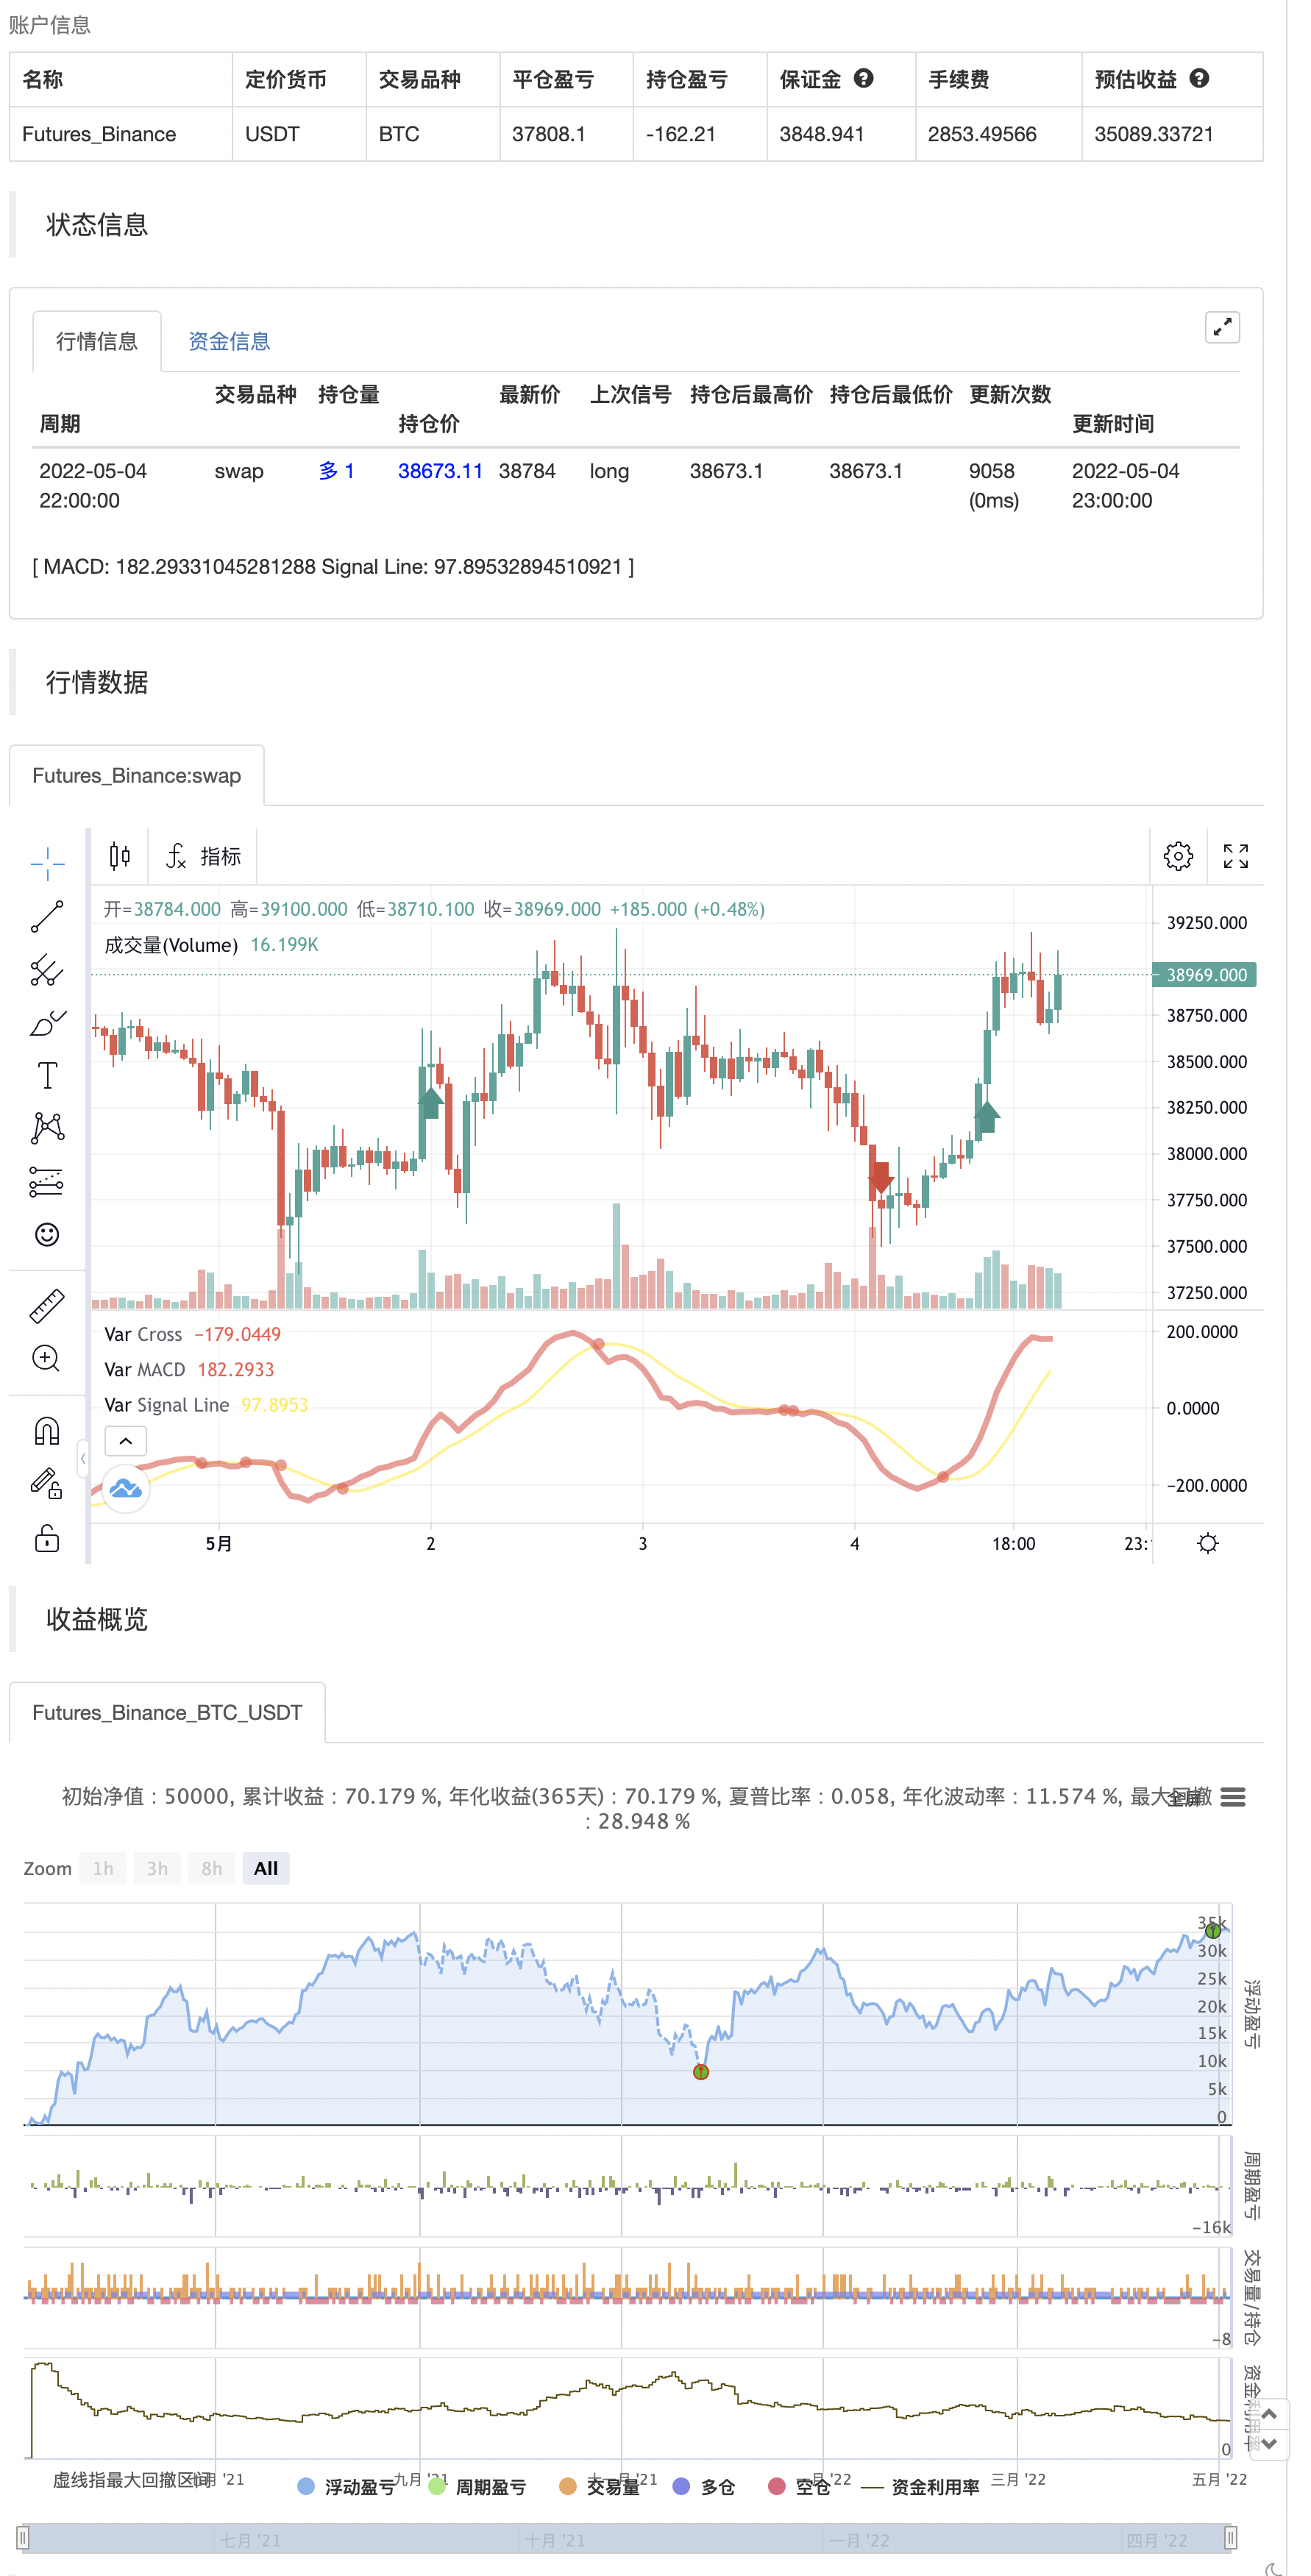
Regelmäßiger MACD-Indikator mit Histogramm, das 4 Farben auf der Grundlage der Richtung über und unter der Nulllinie darstellt Das Update erlaubt Checkbox-Optionen, Anzeigen von MacD und Signallinie, Anzeigen von Farbwechseln von MacD-Linie basierend auf der Kreuzung der Signallinie. Zeigen Sie Punkte an der Kreuzung von MacD und Signallinie, Histogramm kann 4 Farben oder 1 zeigen, Histogramm ein- und ausschalten. Ein besonderes Dankeschön an diese unglaubliche Person im Tech Support, deren Namen ich nicht nennen werde, damit Sie nicht mit E-Mails bombardiert werden. Beachten Sie die Funktion Tech Support zeigte mir, wie man den Standard-Zeitrahmen des Indikators auf das Diagramm Timeframe setzen, aber auch erlauben Sie einen anderen Zeitrahmen zu wählen. Ich habe die Punkte am Macd Cross von "TheLark" komplett gestohlen.
Wiederholung
/*backtest
start: 2021-05-05 00:00:00
end: 2022-05-04 23:59:00
period: 1h
basePeriod: 15m
exchanges: [{"eid":"Futures_Binance","currency":"BTC_USDT"}]
*/

//Created by user ChrisMoody updated 4-10-2014
//Regular MACD Indicator with Histogram that plots 4 Colors Based on Direction Above and Below the Zero Line
//Update allows Check Box Options, Show MacD & Signal Line, Show Change In color of MacD Line based on cross of Signal Line.
//Show Dots at Cross of MacD and Signal Line, Histogram can show 4 colors or 1, Turn on and off Histogram.
//Special Thanks to that incredible person in Tech Support whoem I won't say you r name so you don't get bombarded with emails
//Note the feature Tech Support showed me on how to set the default timeframe of the indicator to the chart Timeframe, but also allow you to choose a different timeframe.
//By the way I fully disclose that I completely STOLE the Dots at the MAcd Cross from "TheLark"

study(title="CM_MacD_Ult_MTF", shorttitle="CM_Ult_MacD_MTF")
source = close
useCurrentRes = input(true, title="Use Current Chart Resolution?")
resCustom = input(title="Use Different Timeframe? Uncheck Box Above", defval="60")
smd = input(true, title="Show MacD & Signal Line? Also Turn Off Dots Below")
sd = input(true, title="Show Dots When MacD Crosses Signal Line?")
sh = input(true, title="Show Histogram?")
macd_colorChange = input(true,title="Change MacD Line Color-Signal Line Cross?")
hist_colorChange = input(true,title="MacD Histogram 4 Colors?")

res = useCurrentRes ? timeframe.period : resCustom

fastLength = input(12, minval=1), slowLength=input(26,minval=1)
signalLength=input(9,minval=1)

fastMA = ta.ema(source, fastLength)
slowMA = ta.ema(source, slowLength)

outMacD = fastMA - slowMA
outSignal = ta.sma(outMacD, signalLength)
outHist = outMacD - outSignal

//outMacD = request.security(timeframe.period, res, mymacd)
//outSignal = request.security(timeframe.period, res, signal)
//outHist = request.security(timeframe.period, res, hist)

histA_IsUp = outHist > outHist[1] and outHist > 0
histA_IsDown = outHist < outHist[1] and outHist > 0
histB_IsDown = outHist < outHist[1] and outHist <= 0
histB_IsUp = outHist > outHist[1] and outHist <= 0

//MacD Color Definitions
macd_IsAbove = outMacD >= outSignal
macd_IsBelow = outMacD < outSignal

plot_color = hist_colorChange ? histA_IsUp ? color.aqua : histA_IsDown ? color.blue : histB_IsDown ? color.red : histB_IsUp ? color.maroon :color.yellow :color.gray
macd_color = macd_colorChange ? macd_IsAbove ? color.lime : color.red : color.red
signal_color = macd_colorChange ? macd_IsAbove ? color.yellow : color.yellow : color.lime

circleYPosition = outSignal

plot(smd and outMacD ? outMacD : na, title="MACD", color=macd_color, linewidth=4)
plot(smd and outSignal ? outSignal : na, title="Signal Line", color=signal_color, style=plot.style_line ,linewidth=2)
//plot(sh and outHist ? outHist : na, title="Histogram", color=plot_color, style=histogram, linewidth=4)
plot(sd and ta.cross(outMacD, outSignal) ? circleYPosition : na, title="Cross", style=plot.style_circles, linewidth=4, color=macd_color)
//hline(0, '0 Line', linestyle=hline.style_solid, linewidth=2, color=color.white)

if outMacD > outSignal and math.abs(outMacD - outSignal) >90
    strategy.entry("entry long", strategy.long)
else if outMacD < outSignal and math.abs(outMacD - outSignal) >90
    strategy.entry("entry short", strategy.short)
- Erweiterte MACD-Strategie mit begrenztem Martingale
- H1 Trend Bias + M15 MACD Signal + M5 Schnelle Volatilitätslücke Strategie
- MACD Dual Moving Average Crossover-Strategie
- MACD RSI Ichimoku Momentum Trend nach langfristiger Strategie
- Handelsstrategie auf der Grundlage von aufeinanderfolgenden MACD-Gold- und Todeskreuzungen
- Erweiterte EMA-Crossover-Strategie mit RSI/MACD/ATR
- Kombination von MACD und RSI für die langfristige Handelsstrategie
- Strategie zur Kombination von mehreren Indikatoren (CCI, DMI, MACD, ADX)
- Mehrindikatortrend nach Strategie
- Die Kommission stellt fest, dass die in den Erwägungsgründen 1 und 2 genannten Risikopositionen nicht berücksichtigt werden dürfen.
- Elliott-Wellen-Theorie 4-9 Impulswellen automatische Detektion Handelsstrategie
- SuperTrend
- Demark-Umkehrpunkte
- Swing Highs/Lows und Kerzenmuster
- TMA-Überlagerung
- MACD + SMA 200-Strategie
- CM-Schleudersystem
- Bollinger + RSI, Doppelstrategie v1.1
- Bollinger-Band-Strategie
- Optimierter Trend-Tracker
- Monatliche Renditen in PineScript-Strategien
- ADX und DI für v4
- Indikator: WaveTrend-Oszillator
- Indikator für die Druckdynamik
- Alpha-Trend
- Handel mit mehreren Zeitrahmen
- Stimmungs-Oszillator
- Antennen werden für den Handel mit Papier und Papierpapier verwendet, um den Marktpreis zu klären.
- Schildkrötenstrategie
- Holen Sie sich Ihren Trend.
- AlphaTrend-Verwendung