Auf Bollinger-Bändern basierende kurzfristige Trendverfolgungsstrategie

Überblick
Die Brin-Band-Break-Strategie ist eine kurzfristige Trend-Tracking-Strategie, die auf den Brin-Band-Indikatoren basiert. Sie kann sowohl in mehreren als auch in leeren Richtungen operieren. Sie ist sowohl für Cash- als auch für Fixed-Term-Kontrakte geeignet, insbesondere für Trendbewegungen.
Die Strategie ist hoch konfigurierbar und erlaubt dem Benutzer, die Perioden- und Abweichungsparameter des Brinbands, Trendfilter, Volatilitätsfilter, Handelsrichtungfilter, Wechselkursfilter und Datumsfilter einzusetzen. Darüber hinaus wird ein Stop-Loss, Stop-Stopp und Stop-Loss-Tracking für mehrere und leere Positionen eingerichtet, um eine umfassende Risikomanagementmethode zu gewährleisten. Das Hinzufügen des größten Tagesverlusts bietet eine weitere Schicht an Schutz, was es zu einem vertrauenswürdigen professionellen, anpassenden Handelssystem macht.
Strategieprinzip
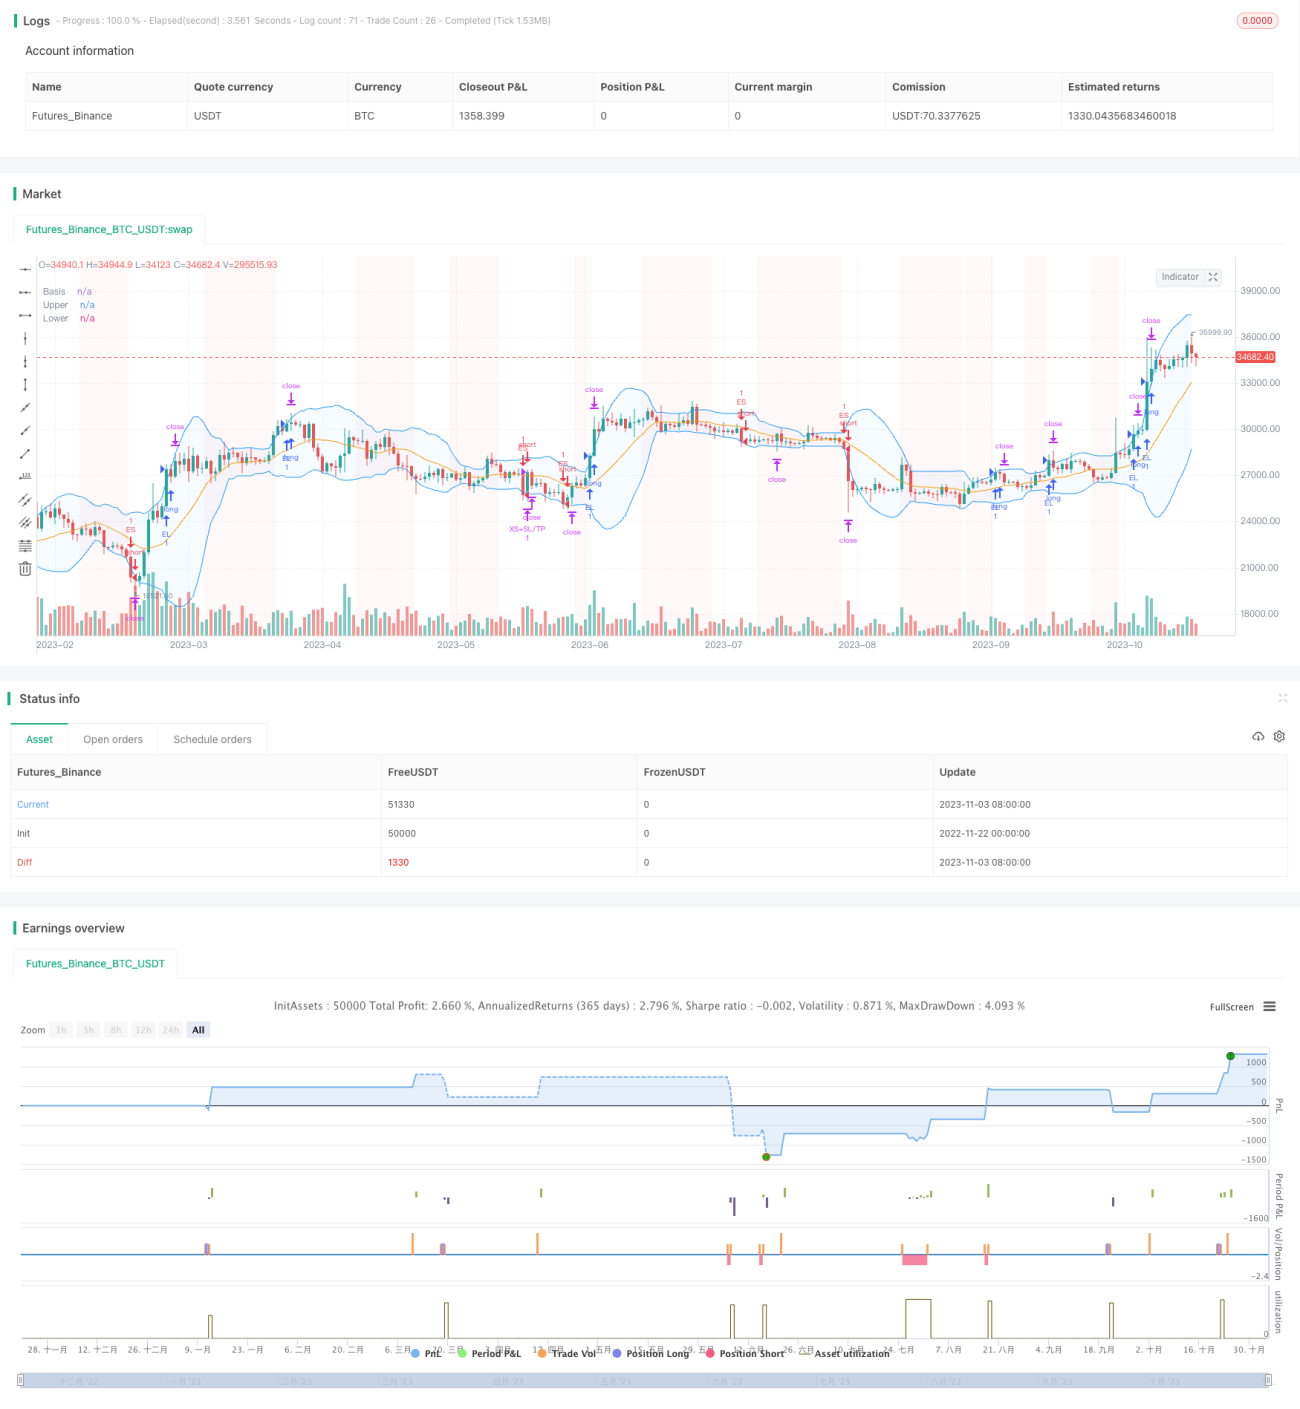
Der Kern der Strategie ist der Brin-Band. Der Brin-Band besteht aus drei Linien mittel-, ober- und unterhalb der Bahn, die die Durchschnittslinie des Preises, die Obergrenze für die Fluktuation und die untere Grenze für die Fluktuation darstellen. Wenn der Preis die Oberbahn durchbricht, machen Sie mehr; wenn der Preis die Unterbahn durchbricht, machen Sie weniger.
Darüber hinaus werden in der Strategie mehrere Hilfsfilter eingesetzt, um Noise-Transaktionen zu vermeiden. Diese Filter umfassen:
-
Trendfilter: Preise sind über dem gleitenden Durchschnitt hoch und unter dem gleitenden Durchschnitt niedrig.
-
Volatilitätsfilter: Handel nur, wenn die Volatilität steigt.
-
Filter für die Handelsrichtung: Nur Plus-, Nur Negativ- oder Zwei-Wege-Handel, je nach Eigenschaft des Signals;
-
Veränderungsrate-Filter: Der Preis wird nur eingegeben, wenn die Veränderungsrate gegenüber dem Schlusskurs des vorangegangenen Handelstages ein bestimmtes Niveau erreicht;
-
Datum-Filter: Einstellung des Zeitraums für die Rückmessung.
Das Trading-Signal wird erzeugt, wenn alle Filterbedingungen erfüllt sind. Stop, Stop Loss und Tracking Stop Loss sorgen für Risikomanagement. Darüber hinaus verhindert die maximale Tagesverlust-Einstellung einen massiven Rückzug in einem Tag.
Analyse der Stärken
Diese Strategie hat folgende Vorteile:
-
Der Blinker ist ein etablierter Indikator, der zuverlässig als zentrales Handelssignal verwendet wird.
-
Mehrfachfilter sind konfigurierbar und so konzipiert, dass Fehltransaktionen vermieden werden können.
-
Umfassende und flexible Lösungen für die Verhinderung, Verhinderung und Nachverfolgung von Schäden;
-
Die maximale Tagesverlust-Einstellung wirkt als Ein-Tages-Rücknahme.
-
Das ist ein Trendmarkt mit großem Gewinnpotenzial.
Risikoanalyse
Die Strategie birgt einige Risiken:
-
Brin-Band-Bruch ist anfällig für Kopf- und Boden-Falschbruch, was zu Schäden führen kann.
-
Die Filter sind möglicherweise zu streng und verpassen Handelschancen bei der Bilanzierung.
-
Ein großer Sprung kann zu Verlusten führen, die direkt über die Stop-Line hinausgehen.
-
In extremen Situationen können große Verluste nicht vollständig vermieden werden.
Angesichts der oben genannten Risiken können Filterbedingungen entsprechend gelockert werden, oder es kann manuell eingegriffen werden, um einige Positionen zu schließen, die Stop-Loss-Distanz zu verringern usw.
Optimierungsrichtung
Die Strategie kann in folgenden Bereichen optimiert werden:
-
Versuchen Sie, verschiedene Parameterkombinationen auszuprobieren, um die optimale Parameterpalette zu finden.
-
Die Entwicklung von Modellen für das Maschinelle Lernen, um die dynamische Optimierung von Parametern zu ermöglichen.
-
Erforschung effektiverer Methoden zur Verlustdämpfung, wie z. B. Zeitverlust, Vibrationsverlustdämpfung;
-
In Verbindung mit emotionalen Indikatoren wird in extremen Situationen aktiv eingegriffen.
-
In Verbindung mit den entsprechenden Produkten wird ein statistischer Arbitrage durchgeführt.
Zusammenfassen
Die Brin-Band-Breakout-Strategie ist eine bewährte und zuverlässige Kurzlinie-Trend-Follow-Strategie. Sie verwendet Brin-Band-Indikatoren als Signal und setzt mehrere Filter ein, um die Zuverlässigkeit des Signals zu gewährleisten. Gleichzeitig ist ein umfassender Stop-Loss- und Risikokontrollmechanismus zur Risikokontrolle vorgesehen. Die Strategie eignet sich für aktive Trendmärkte und hat ein gutes Ertragspotenzial.
- 1