Trendfolgende kurzfristige Handelsstrategien
Erstellungsdatum:
2024-01-04 17:52:21
zuletzt geändert:
2024-01-04 17:52:21
Kopie:
3
Klicks:
704
1
konzentrieren Sie sich auf
1750
Anhänger
Überblick
Diese Strategie basiert auf dem Trendbeurteilungsindikator ADX Average Trend Index und einer Kombination aus Mittellinien, um Trendbeurteilungen und -verfolgungen durchzuführen. Wenn ein Trendwechsel festgestellt wird, wird ein Durchbruch eingesetzt, um einen kurzen Handel durchzuführen.
Strategieprinzip
- Der ADX-Durchschnitts-Trendindex wird verwendet, um die Richtung des Trends zu bestimmen. Wenn der ADX größer als 20 ist, ist er im Trend.
- Die EMA dient als Trendmessgröße, die EMA-Goldfalke als Aufwärtstrend und die EMA-Deckfalke als Abwärtstrend.
- VWAP als wichtige Referenzpreise, die Preise sind oberhalb von VWAP mehrköpfigen Markt, unterhalb der leeren Markt.
- Auf der Grundlage der oben genannten mehreren Indikatoren, um die Markttrends und Umkehrungen zu beurteilen, brechen Sie durch, folgen Sie den Trends und handeln Sie kurz.
Analyse der Stärken
- Der Trend wird durch die Kombination mehrerer Indikatoren beurteilt, um die größeren Trends zu beurteilen.
- VWAP als wichtige Referenzpreise, um den Handel in ungültigen Zonen zu vermeiden.
- ADX entscheidet, dass ein Trend vorhanden ist, und handelt dann weiter, um ungültige Geschäfte zu reduzieren.
- Die Erfolgsrate der Durchbruchoperationen ist hoch und entspricht dem Trend.
Risikoanalyse
- Die Wahrscheinlichkeit, dass ein Durchbruch fehlschlägt, führt zu einem Stop-Loss. Das Risiko kann durch Optimierung der Stop-Loss-Position verringert werden.
- Die Anzahl der Transaktionen ist höher, und es kann zu Verlusten kommen. Sie können die Anzahl der Positionen entsprechend anpassen, um die Verlustquote zu verringern.
- Die Wahl der Handelszeiten und der Handelsvarianten beeinflusst auch die Strategie. Verschiedene Handelszeiten und verschiedene Handelsvarianten können getestet werden.
Optimierungsrichtung
- Optimierung der ADX-Parameter, um Trends besser zu unterscheiden und ADX-Werte zu sammeln.
- Optimieren Sie die Kombination der Mittellinienparameter, um eine bessere Mittellinienkombination zu finden, die den Trend repräsentiert.
- Optimierung der Stop-Loss-Position. Entspannung der Stop-Loss-Range, um zu hohe Stop-Loss-Kosten zu vermeiden.
- Optimierung der Positionsgröße.
Zusammenfassen
Die Strategie verwendet eine umfassende Anwendung von Mittellinienindikatoren, Trendbeurteilungsindikatoren und wichtigen Referenzpreisen, um die großen Trends genau zu beurteilen; und bei der Beurteilung der Trendumkehr wird der Trend mit Durchbruchoperationen verfolgt, um kurze Linien zu erzielen. Durch die Optimierung der Parameter kann die Strategie weiter verbessert werden.
Strategiequellcode
/*backtest
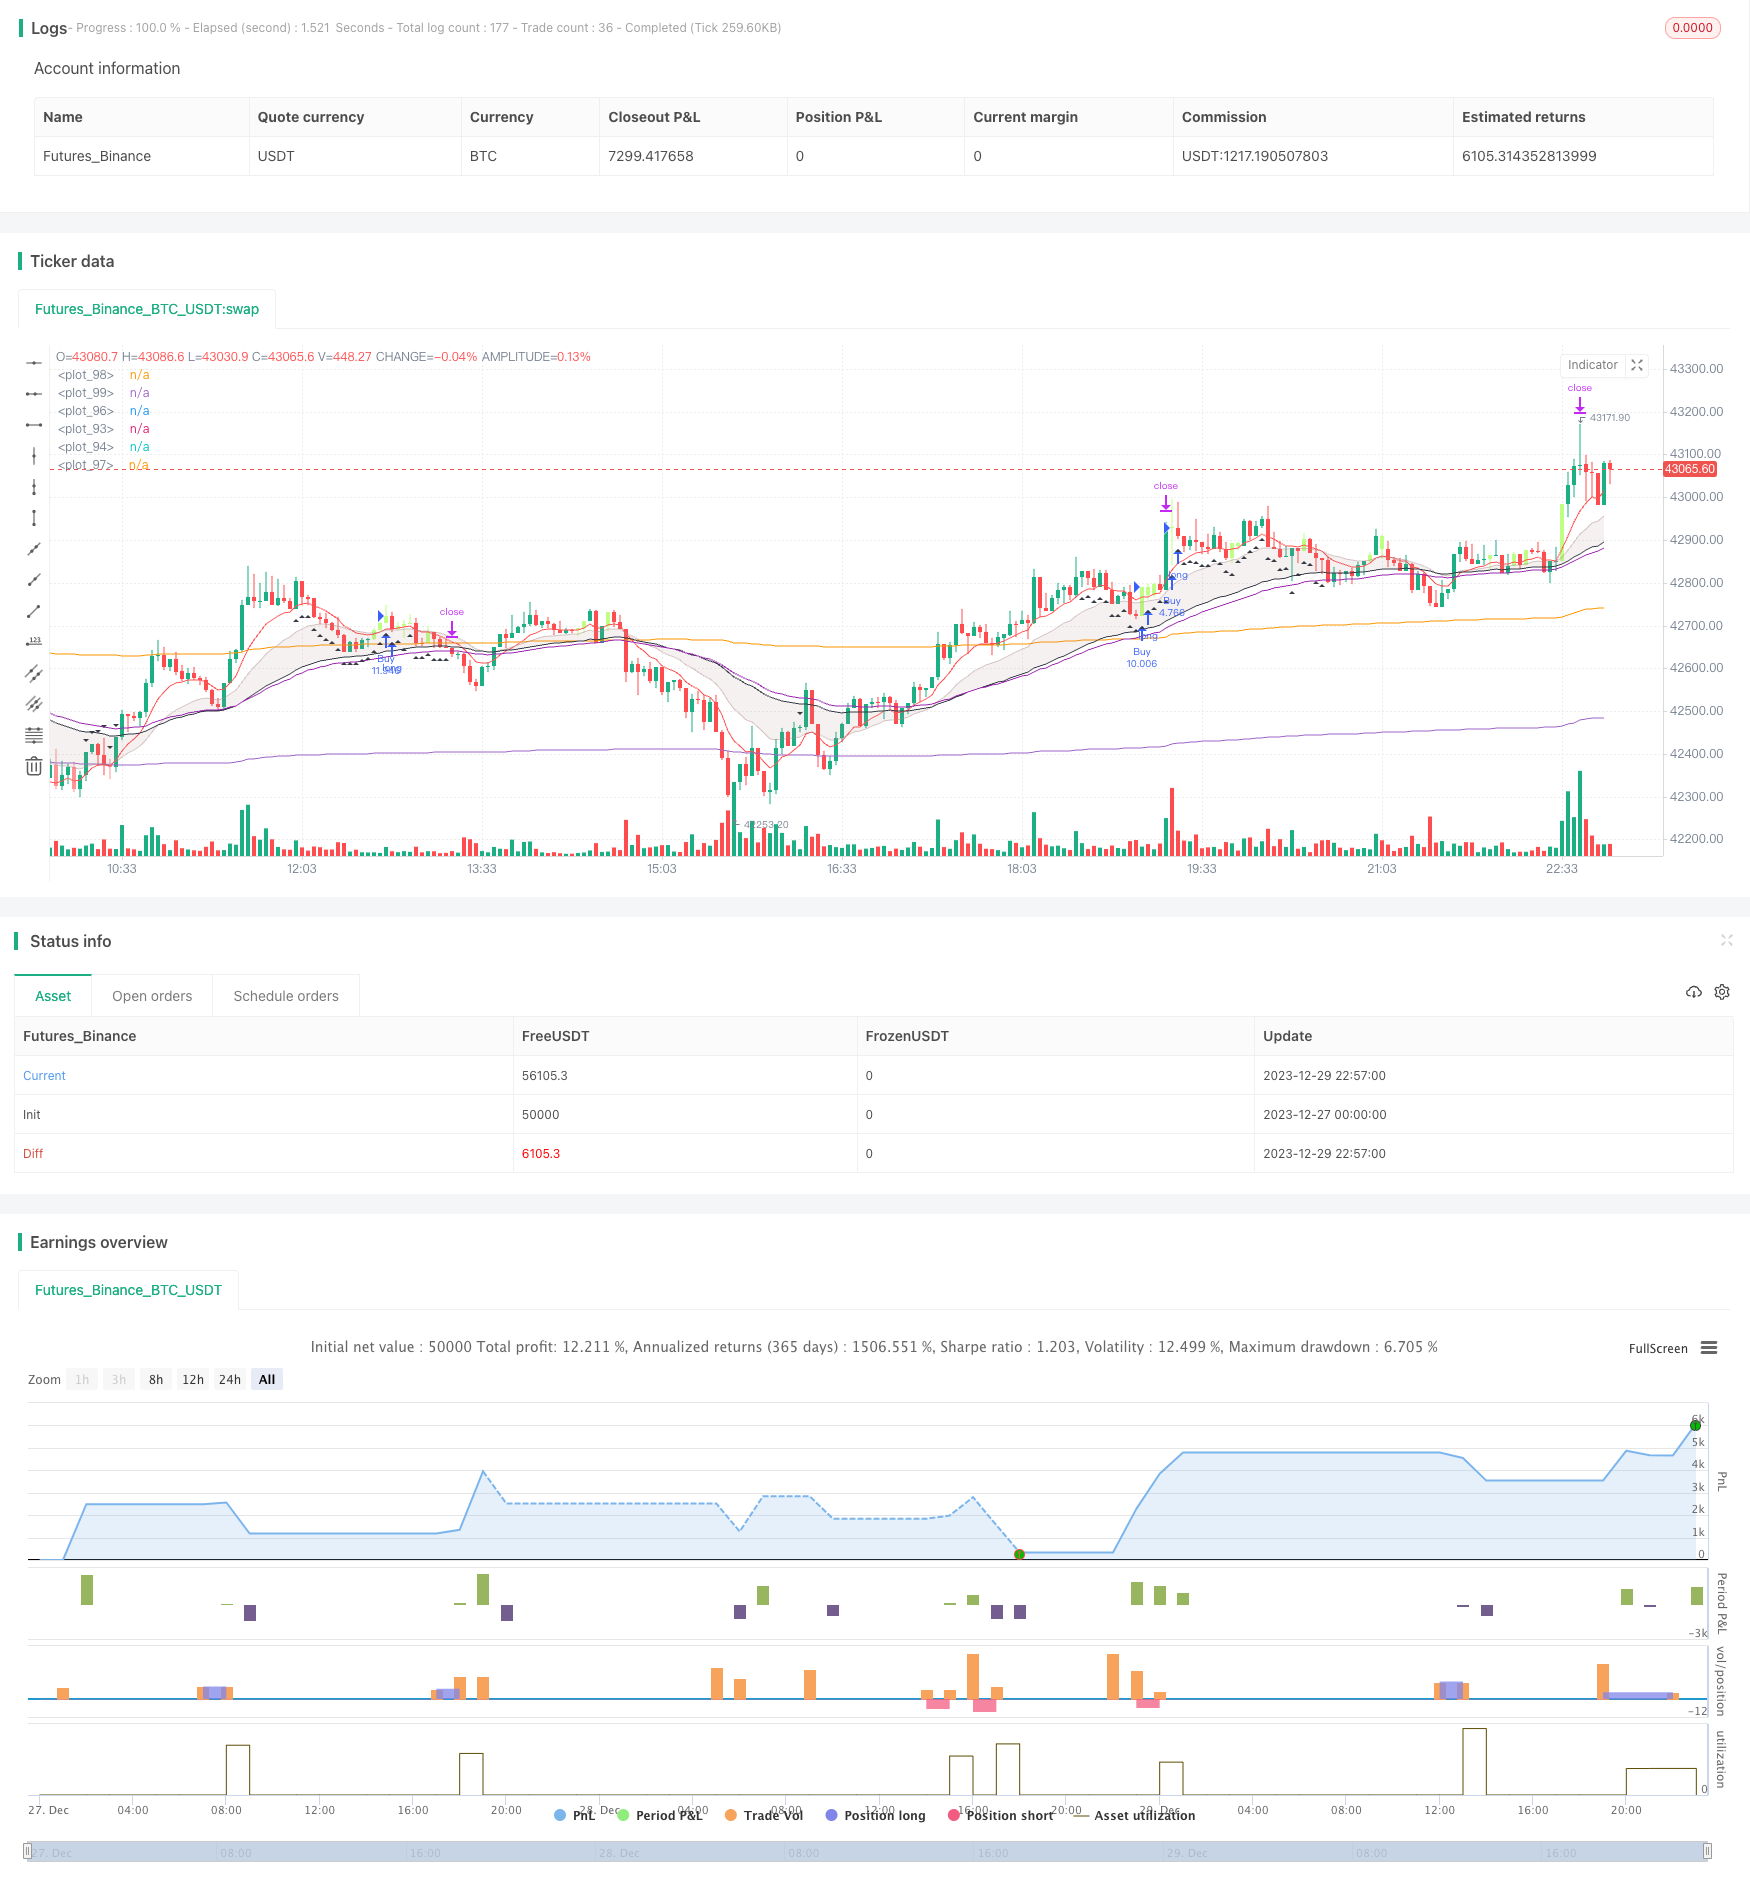
start: 2023-12-27 00:00:00
end: 2023-12-29 23:00:00
period: 3m
basePeriod: 1m
exchanges: [{"eid":"Futures_Binance","currency":"BTC_USDT"}]
*/
// This source code is subject to the terms of the Mozilla Public License 2.0 at https://mozilla.org/MPL/2.0/
// © mariocastel
//@version=5
strategy("Wave Rider", overlay=true, initial_capital = 100000)
session = input(defval = "1400-1500", title = "Session Time")
t = not na(time(timeframe.period,session))
RR = input.float(1.5, "Risk to reward", step=0.5)
var bool movetoBE = input(false, "Move to Break Even")
BE = input.float(1, "Break Even at", step=0.5)
vwap_mult = 0.001 * input(3, "VWAP Multiplier")
aboveVWAP = ta.vwap(close) * (1 + vwap_mult)
belowVWAP = ta.vwap(close) * (1 - vwap_mult)
sym = input("BTC_USDT:swap", "VWAP Source")
QQQaboveVWAP = request.security(sym, "3", aboveVWAP)
QQQbelowVWAP = request.security(sym, "3", belowVWAP)
QQQclose = request.security(sym, "3", close)
ema20 = ta.ema(close, 20)
ema50 = ta.ema(close, 50)
ema60 = ta.ema(close, 60)
ema9 = ta.ema(close, 9)
opentrades = strategy.opentrades > 0
aboveEMA = close > ema60
belowEMA = close < ema60
uptrend = aboveEMA and aboveEMA[1] and aboveEMA[2] and aboveEMA[3] and aboveEMA[4] and aboveEMA[5] and aboveEMA[6] and aboveEMA[7] and aboveEMA[8] and aboveEMA[9] and aboveEMA[10] and aboveEMA[11] and aboveEMA[12] and aboveEMA[13] and aboveEMA[14] and aboveEMA[15] and aboveEMA[16] and aboveEMA[17] and aboveEMA[18] and aboveEMA[19] and aboveEMA[20] and aboveEMA[21] and aboveEMA[22] and aboveEMA[23] and aboveEMA[24] and aboveEMA[25] and aboveEMA[26] and aboveEMA[27] and aboveEMA[28] and aboveEMA[29]
downtrend = belowEMA and belowEMA[1] and belowEMA[2] and belowEMA[3] and belowEMA[4] and belowEMA[5] and belowEMA[6] and belowEMA[7] and belowEMA[8] and belowEMA[9] and belowEMA[10] and belowEMA[11] and belowEMA[12] and belowEMA[13] and belowEMA[14] and belowEMA[15] and belowEMA[16] and belowEMA[17] and belowEMA[18] and belowEMA[19] and belowEMA[20] and belowEMA[21] and belowEMA[22] and belowEMA[23] and belowEMA[24] and belowEMA[25] and belowEMA[26] and belowEMA[27] and belowEMA[28] and belowEMA[29]
buy = (low < ema20 and low > ema50 and close > ema9) and QQQclose > QQQaboveVWAP or (low[1] < ema20 and low[1] > ema50 and close > ema9) and QQQclose > QQQaboveVWAP and uptrend
sell = (high > ema20 and high < ema50 and close < ema9) and QQQclose < QQQbelowVWAP or (high[1] > ema20 and high[1] < ema50 and close < ema9) and QQQclose < QQQbelowVWAP and downtrend
var float entry = na
var float sl = na
var float qty = na
var float tp = na
var float be = na
if ema20 > ema50 and ema9 > ema20
if buy and not opentrades and t and uptrend
alert("Wave Rider Setup")
entry := close
sl := ema50
qty := 1000/(close - sl) * 1
if close - sl > syminfo.mintick*300
tp := close + ((close - sl)*1)
else
tp := close + ((close - sl)*RR)
be := close + ((close - sl)*BE)
strategy.entry("Buy", strategy.long, qty=qty)
strategy.exit("Close Buy", "Buy",qty=qty, stop=sl, limit=tp)
if ema20 < ema50 and ema9 < ema20
if sell and not opentrades and t and downtrend
alert("Wave Rider Setup")
entry := close
sl := ema50
qty := 1000/(sl - close) * 1
if sl - close > syminfo.mintick*300
tp := close - ((sl - close)*1)
else
tp := close - ((sl - close)*RR)
be := close - ((sl - close)*BE)
strategy.entry("Sell", strategy.short, qty=qty)
strategy.exit("Close Sell", "Sell", qty=qty, stop=sl, limit=tp)
// Adjust BEs
if movetoBE == true
if strategy.position_size > 0
if high >= be
sl := entry
strategy.cancel("Close Buy")
strategy.exit("Close Buy", "Buy", qty=qty, stop=sl, limit=tp)
if strategy.position_size < 0
if low <= be
sl := entry
strategy.cancel("Close Sell")
strategy.exit("Close Sell", "Sell", qty=qty, stop=sl, limit=tp)
EoD_time = timestamp(year, month, dayofmonth, 15, 58, 00)
EoD = time == EoD_time
if EoD
strategy.close_all()
barcolor(color=buy ? color.rgb(191, 255, 131): na)
barcolor(color=sell ? color.rgb(255, 149, 149): na)
ema20plot = plot(ema20, color=color.rgb(168, 131, 131, 55))
ema50plot = plot(ema50, color=color.black)
fill(ema20plot, ema50plot, color=color.rgb(168, 131, 131, 85))
plot(ema9, color=color.red)
plot(ema60, color=color.purple)
plot(QQQaboveVWAP)
plot(QQQbelowVWAP)
plotshape(uptrend, style=shape.triangleup, location=location.belowbar, color=color.black)
plotshape(downtrend, style=shape.triangledown, location=location.abovebar, color=color.black)