Handelsstrategie mit doppeltem gleitenden Durchschnitt über verschiedene Zeitrahmen hinweg
Überblick
Die Strategie erzeugt Kauf- und Verkaufssignale auf zwei verschiedenen Zeiträumen, indem sie zwei verschiedene Arten von Moving Averages berechnet. Es ist eine sehr gute Sandkastenstrategie, die verwendet werden kann, um mit verschiedenen Arten von Moving Averages und verschiedenen Kombinationen von Zeiträumen zu experimentieren.
Strategieprinzip
Diese Strategie verwendet zwei Moving Averages, einen schnellen Moving Average und einen langsamen Moving Average. Der Zeitrahmen des schnellen Moving Average ist größer oder gleich dem Zeitrahmen des Diagramms. Ein Kaufsignal wird erzeugt, wenn der schnelle Moving Average den langsamen Moving Average nach oben durchbricht; ein Verkaufsignal wird erzeugt, wenn der schnelle Moving Average den langsamen Moving Average nach unten durchbricht.
Der Benutzer kann verschiedene Arten von Moving Averages wie SMA, EMA, KAMA und andere wählen, wobei die Zeitrahmen variieren können, um die optimalen Parameter durch Kombinationsversuche zu ermitteln.
Analyse der Stärken
Der größte Vorteil dieser Strategie besteht darin, dass die verschiedenen Kombinationen von Parameter-Experimenten sehr einfach angepasst werden können, um die optimale Parameter-Einstellung zu finden.
Der Benutzer kann die Art, die Dauer und den Zeitrahmen der beiden Moving Averages frei wählen, und das System berechnet und zeigt die Ergebnisse in Echtzeit an. Das ist viel einfacher als die Kombinationsstrategie, bei der ein einzelner Parameter getestet wird.
Die Strategie beinhaltet eine Stop-Loss-Funktion, die das Risiko verringert und die Gewinnwahrscheinlichkeit erhöht.
Risikoanalyse
Die größte Gefahr dieser Strategie besteht darin, dass die falsche Einstellung der Parameter zu zu häufigen Handelssignalen führen kann, was zu erhöhten Handelskosten und einem Verlust von Gleitpunkten führt.
Außerdem erzeugt der Doppel-Moving-Average selbst leicht falsche Signale, und wenn die Parameter nicht richtig gewählt werden, kann das Kauf- und Verkaufssignal unzuverlässig sein.
Diese Risiken können durch Optimierung von Parametern und Kombinationen anderer Indikatoren gemindert werden.
Optimierungsrichtung
Es kann in Erwägung gezogen werden, eine andere Kombination von Indikatoren auf der Basis von zwei Moving Averages zu filtern, z. B. RSI-Indikatoren, um Kauf- und Verkaufssignale zu bestätigen und so falsche Signale zu reduzieren.
Alternativ kann man versuchen, die Parameter-Training von Moving Averages zu optimieren, um die beste Parameterkombination zu finden. Man kann auch überlegen, Methoden des Maschinellen Lernens zu verwenden, um die Parameter dynamisch zu optimieren.
Zusammenfassen
Diese Strategie ist eine sehr gute Doppel-Moving-Average-Experiment-Sandbox. Ihr Vorteil besteht darin, dass verschiedene Parameterkombinationen schnell in Kombination miteinander kombiniert werden können, um die optimale Handelsstrategie zu finden. Natürlich besteht auch das Risiko, dass einige Parameter falsch eingestellt werden, was das Risiko durch Filterung durch Hinzufügen anderer Indikatorkombinationen verringert.
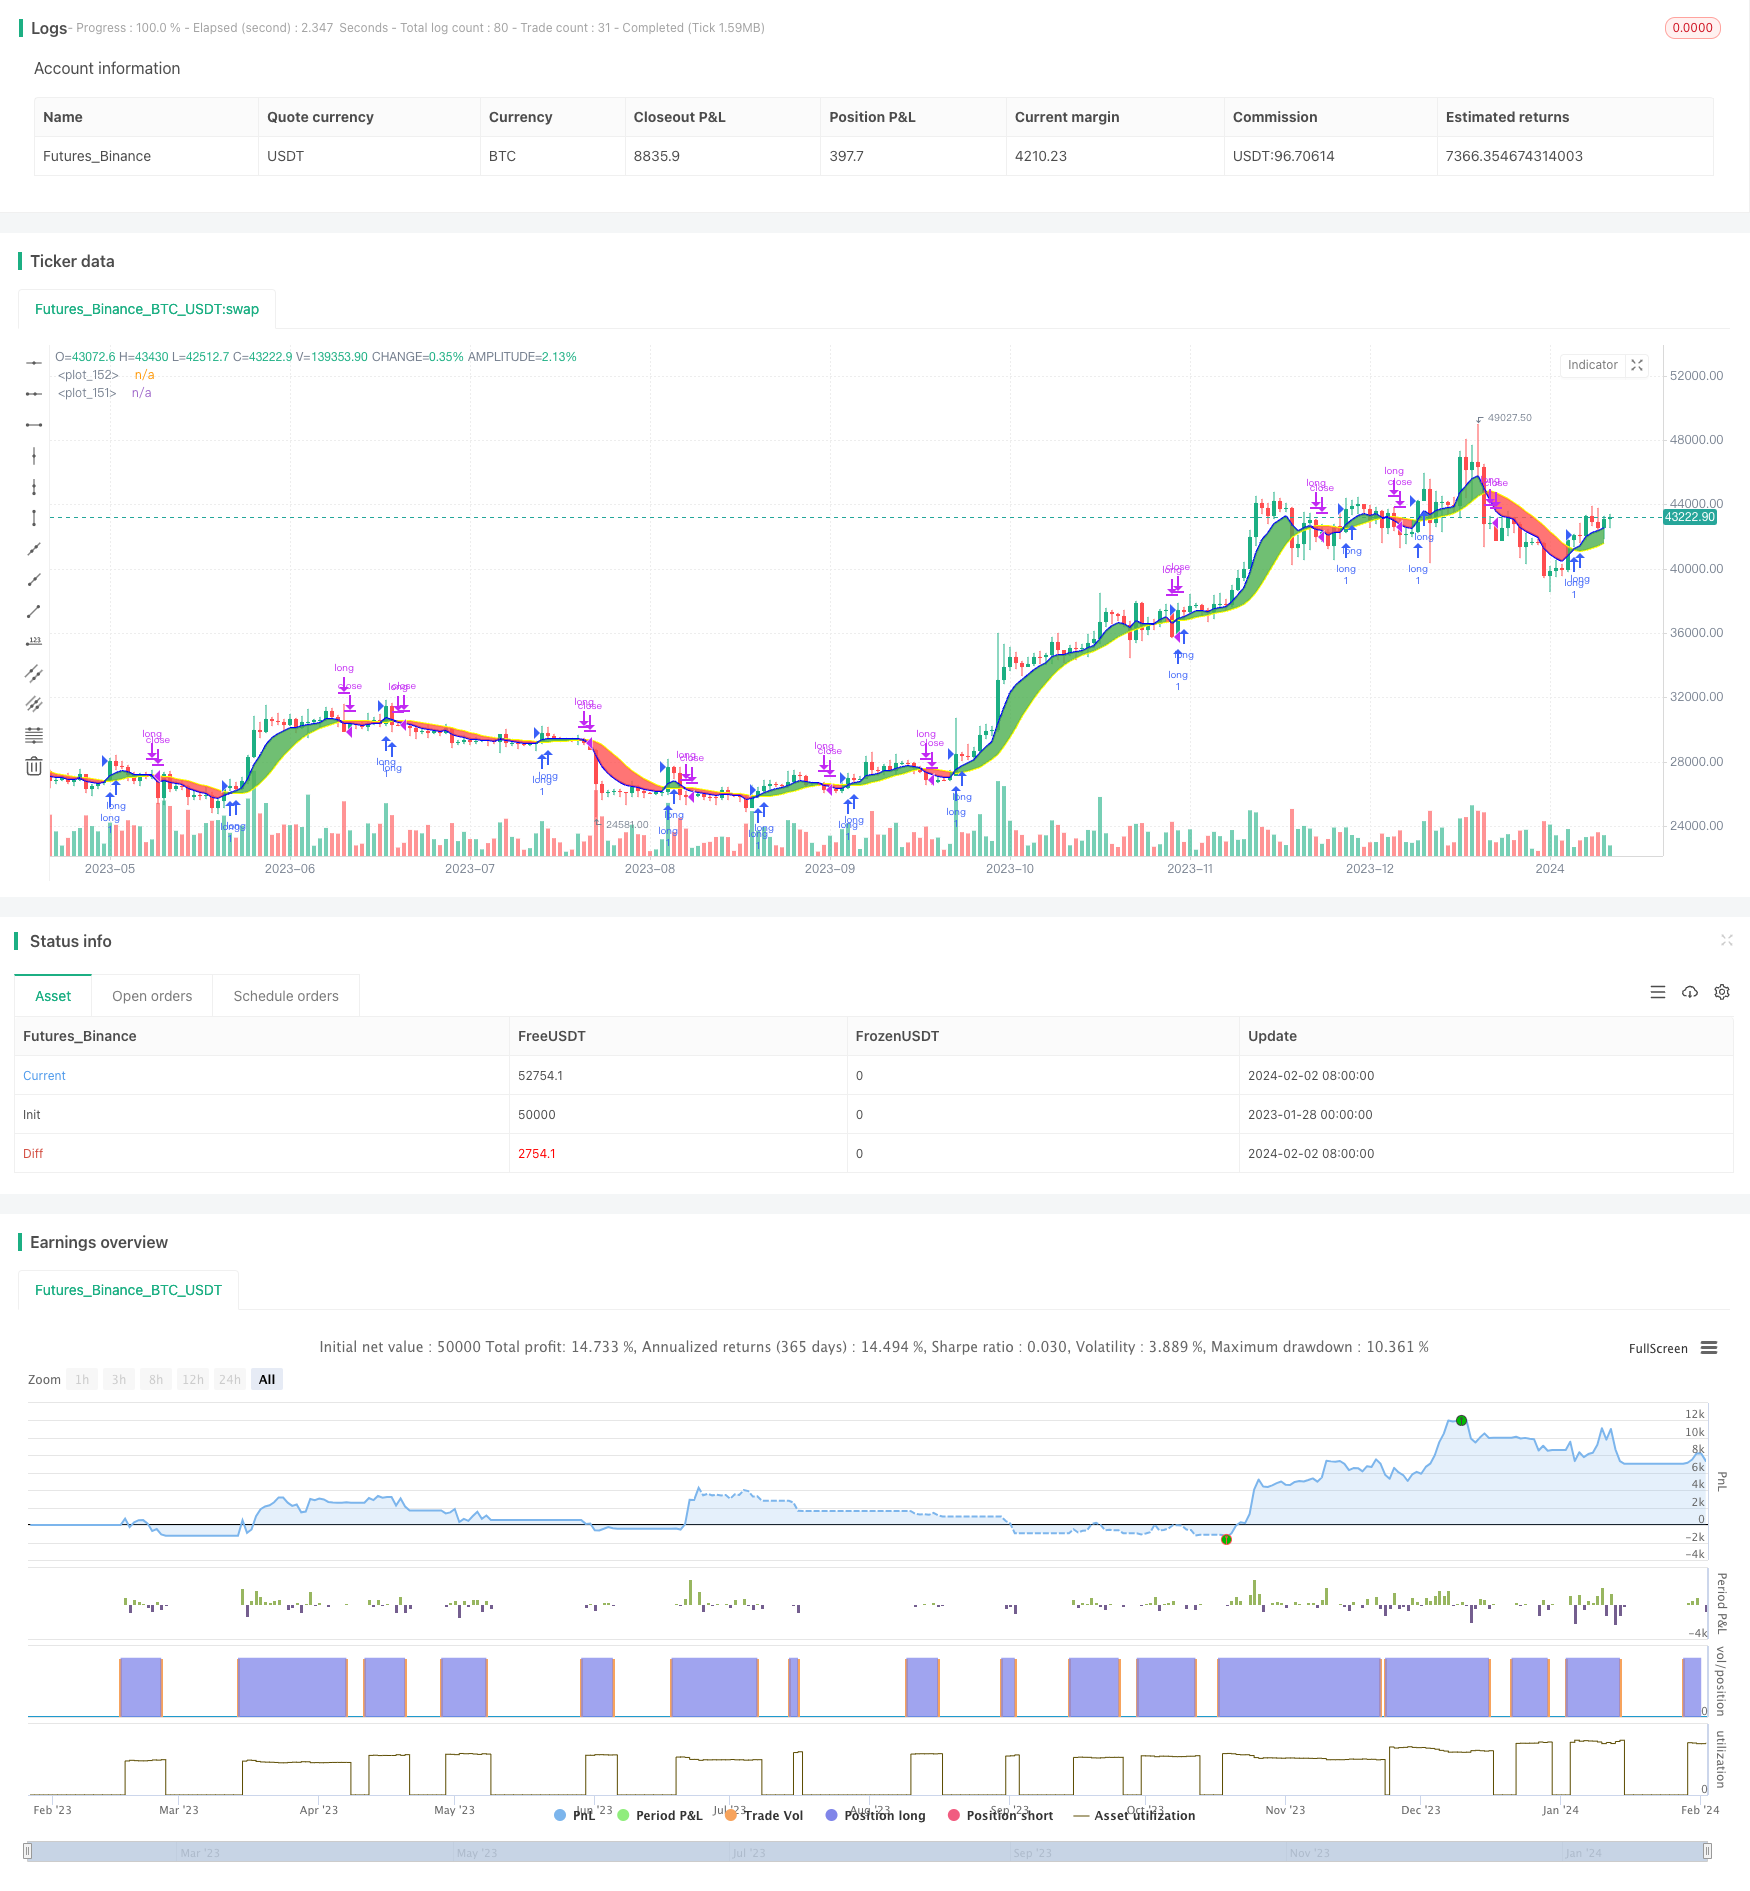
/*backtest
start: 2023-01-28 00:00:00
end: 2024-02-03 00:00:00
period: 1d
basePeriod: 1h
exchanges: [{"eid":"Futures_Binance","currency":"BTC_USDT"}]
*/

// This work is licensed under a Creative Commons Attribution-ShareAlike 4.0 International License https://creativecommons.org/licenses/by-sa/4.0/
// © dman103
// A moving averages SandBox strategy where you can experiment using two different moving averages (like KAMA, ALMA, HMA, JMA, VAMA and more) on different time frames to generate BUY and SELL signals, when they cross.
// Great sandbox for experimenting with different moving averages and different time frames.
//
// == How to use ==
// We select two types of moving averages on two different time frames:
//
// First is the FAST moving average that should be at the same time frame or higher.
// Second is the SLOW moving average that should be on the same time frame or higher.
// When FAST moving average cross over the SLOW moving average we have a BUY signal (for LONG)
// When FAST moving average cross under the SLOW moving average we have a SELL signal (for SHORT)


// WARNING: Using a lower time frame than your chart time frame will result in unrealistic results in your backtesting and bar replay.
// == NOTES ==
// You can select BOTH, LONG, SHORT or NONE in the strategy settings.
// You can also enable Stop Loss and Take Profit.
// More sandboxes to come, Follow to get notified.
// Can also act as indicator by settings 'What trades should be taken' to 'NONE'

//@version=4
strategy("Multi MA MTF SandBox Strategy","Multi MA SandBox",overlay=true)
tradeType = input("LONG", title="What trades should be taken:", options=["LONG", "SHORT", "BOTH", "NONE"])
fast_title = input(true,     title='---------------- Fast Moving Average (BLUE)----------------', type=input.bool)
ma_select1 = input(title="First Slow moving average", defval="EMA", options=["SMA", "EMA", "WMA", "HMA", "JMA", "KAMA", "TMA", "VAMA", "SMMA", "DEMA" , "VMA", "WWMA", "EMA_NO_LAG", "TSF","ALMA"])
resma_fast = input(title="First Time Frame", type=input.resolution, defval="")
lenma_fast = input(title="First MA Length", type=input.integer, defval=6)
slow_title = input(true,     title='---------------- Slow Moving Average (YELLOW)----------------', type=input.bool)
ma_select2 = input(title="Second Fast moving average", defval="JMA", options=["SMA", "EMA", "WMA", "HMA", "JMA", "KAMA", "TMA", "VAMA", "SMMA", "DEMA" , "VMA", "WWMA", "EMA_NO_LAG", "TSF","ALMA"])
resma_slow = input(title="Second time frame", type=input.resolution, defval="")
lenma_slow = input(title="Second MA length", type=input.integer, defval=14)

settings = input(true,     title='---------------- Other Settings ----------------', type=input.bool)
lineWidth = input(2,title="Line Width")
colorTransparency=input(50,title="Color Transparency",step=10,minval=0,maxval=100)
color_fast=input(color.blue,type=input.color)
color_slow=input(color.yellow,type=input.color)
fillColor = input(title="Fill Color", type=input.bool, defval=true)
IndicatorSettings = input(true,     title='---------------- Indicators Settings ----------------', type=input.bool)
offset=input(title="Alma Offset (only for ALMA)",defval=0.85, step=0.05)
volatility_lookback =input(title="Volatility lookback (only for VAMA)",defval=12)
i_fastAlpha = input(1.25,"KAMA's alpha (only for KAMA)", minval=1,step=0.25)
fastAlpha = 2.0 / (i_fastAlpha + 1)
slowAlpha = 2.0 / (31)
///////Moving Averages
MA_selector(src, length,ma_select) =>
    ma = 0.0
    if ma_select == "SMA"
        ma := sma(src, length)
        ma

    if ma_select == "EMA"
        ma := ema(src, length)
        ma

    if ma_select == "WMA"
        ma := wma(src, length)
        ma
    if ma_select == "HMA"
        ma := hma(src,length)
        ma
    if ma_select == "JMA"
        beta = 0.45*(length-1)/(0.45*(length-1)+2)
        alpha = beta
        tmp0 = 0.0, tmp1 = 0.0, tmp2 = 0.0, tmp3 = 0.0, tmp4 = 0.0
        tmp0 := (1-alpha)*src + alpha*nz(tmp0[1])
        tmp1 := (src - tmp0[0])*(1-beta) + beta*nz(tmp1[1])
        tmp2 := tmp0[0] + tmp1[0]
        tmp3 := (tmp2[0] - nz(tmp4[1]))*((1-alpha)*(1-alpha)) + (alpha*alpha)*nz(tmp3[1])
        tmp4 := nz(tmp4[1]) + tmp3[0]
        ma := tmp4
        ma
    if ma_select == "KAMA"
        momentum = abs(change(src, length))
        volatility = sum(abs(change(src)), length)
        efficiencyRatio = volatility != 0 ? momentum / volatility : 0
        smoothingConstant = pow((efficiencyRatio * (fastAlpha - slowAlpha)) + slowAlpha, 2)
        var kama = 0.0
        kama := nz(kama[1], src) + smoothingConstant * (src - nz(kama[1], src))
        ma:=kama
        ma
    if ma_select == "TMA"
        ma := sma(sma(src, ceil(length / 2)), floor(length / 2) + 1)
        ma

    if ma_select == "VMA"
        valpha=2/(length+1)
        vud1=src>src[1] ? src-src[1] : 0
        vdd1=src<src[1] ? src[1]-src : 0
        vUD=sum(vud1,9)
        vDD=sum(vdd1,9)
        vCMO=nz((vUD-vDD)/(vUD+vDD))
        VAR=0.0
        VAR:=nz(valpha*abs(vCMO)*src)+(1-valpha*abs(vCMO))*nz(VAR[1])
        ma := VAR
        ma

    if ma_select == "WWMA"
        wwalpha = 1/ length
        WWMA = 0.0
        WWMA := wwalpha*src + (1-wwalpha)*nz(WWMA[1])
        ma := WWMA
        ma

    if ma_select == "EMA_NO_LAG"
        EMA1= ema(src,length)
        EMA2= ema(EMA1,length)
        Difference= EMA1 - EMA2
        ma := EMA1 + Difference
        ma

    if ma_select == "TSF"
        lrc = linreg(src, length, 0)
        lrc1 = linreg(src,length,1)
        lrs = (lrc-lrc1)
        TSF = linreg(src, length, 0)+lrs
        ma := TSF
        ma

    if ma_select =="VAMA" // Volatility Adjusted from @fractured
        mid=ema(src,length)
        dev=src-mid
        vol_up=highest(dev,volatility_lookback)
        vol_down=lowest(dev,volatility_lookback)
        ma := mid+avg(vol_up,vol_down)
        ma
    if ma_select == "SMMA"
        smma = float (0.0)
        smaval=sma(src, length)
        smma := na(smma[1]) ? smaval : (smma[1] * (length - 1) + src) / length
        ma := smma

    if ma_select == "DEMA"
        e1 = ema(src, length)
        e2 = ema(e1, length)
        ma := 2 * e1 - e2
        ma
    if ma_select == "ALMA"
        ma := alma(src, length,offset, 6)
        ma
    ma

// Calculate EMA
ma_fast = MA_selector(close, lenma_fast,ma_select1)
ma_slow = MA_selector(close, lenma_slow,ma_select2)

maFastStep = security(syminfo.tickerid, resma_fast, ma_fast)
maSlowStep = security(syminfo.tickerid, resma_slow, ma_slow)

ma1_plot=plot(maFastStep, color=color_fast,linewidth=lineWidth,transp=colorTransparency)
ma2_plot=plot(maSlowStep, color=color_slow,linewidth=lineWidth,transp=colorTransparency)
colors=ma_fast>ma_slow ? color.green : color.red
fill(ma1_plot,ma2_plot, color=fillColor? colors: na,transp=colorTransparency+15)

closeStatus = strategy.openprofit > 0 ? "win" : "lose"
////////Long Rules
long = crossover(maFastStep,maSlowStep) and (tradeType == "LONG" or tradeType == "BOTH")
longClose =crossunder(maFastStep,maSlowStep)//and falling(maSlowStep,1)
///////Short Rules
short =crossunder(maFastStep,maSlowStep) and (tradeType == "SHORT" or tradeType == "BOTH")
shortClose =  crossover(maFastStep,maSlowStep)


longShape= crossover(maFastStep,maSlowStep) and tradeType == "NONE"
shortShape = crossunder(maFastStep,maSlowStep) and tradeType == "NONE"
plotshape(longShape, style=shape.triangleup,location=location.belowbar, color=color.lime,size=size.small)
plotshape(shortShape,style=shape.triangledown,location=location.abovebar, color=color.red,size=size.small)
// === Stop LOSS ===
useStopLoss = input(false, title='----- Add Stop Loss / Take profit -----', type=input.bool)

sl_inp = input(2.5, title='Stop Loss %', type=input.float, step=0.1)/100
tp_inp = input(5, title='Take Profit %', type=input.float, step=0.1)/100
stop_level = strategy.position_avg_price * (1 - sl_inp)
take_level = strategy.position_avg_price * (1 + tp_inp)
stop_level_short = strategy.position_avg_price * (1 + sl_inp)
take_level_short = strategy.position_avg_price * (1 - tp_inp)
if (long)
    strategy.entry("long", strategy.long)
if (short)
    strategy.entry("short", strategy.short)

strategy.close ("long", when = longClose, comment=closeStatus)
strategy.close ("short", when = shortClose, comment=closeStatus)

if (useStopLoss)
    strategy.exit("Stop Loss/Profit Long","long", stop=stop_level, limit=take_level,comment =closeStatus )
    strategy.exit("Stop Loss/Profit Short","short", stop=stop_level_short, limit=take_level_short, comment = closeStatus)