Bolban Bands + RSI + ADX + ATR Umkehr-Handelsstrategie
Überblick
Diese Strategie kombiniert mehrere technische Indikatoren, um die Struktur des Marktes in Kombination mit RSI, ADX und ATR zu beurteilen, wenn der Bollinger Bands-Indikator ein Preisumkehrsignal sendet, und sucht nach hochwahrscheinlichen Umkehrhandelsmöglichkeiten.
Strategieprinzip
Mit einem 20-Zyklus-Borband wartet der Kurs auf ein Kauf- und Verkaufssignal, das aus einer umgekehrten K-Linie besteht.
Der RSI-Indikator beurteilt, ob sich der Markt in einem Schwankungsbereich befindet, wobei der RSI über 60 als Bollraum und unter 40 als Bollraum gilt.
ADX unter 20 beurteilt den Markt als in Erschütterung, über 20 beurteilt den Markt als Trend.
ATR-Stoppschaden-Einstellungen und Tracking-Stoppschaden.
In Kombination mit EMA einheitlichen Filtersignalen.
Strategische Stärkenanalyse
Mehrere Indikatoren verschmelzen, um ein hochprobables Handelssignal zu bilden.
Konfigurationsfähige Parameter für unterschiedliche Marktumgebungen.
Die Regeln sind streng und die Risiken wirksam kontrolliert.
Strategische Risikoanalyse
Die falsche Einstellung der Parameter kann zu zu häufigen Transaktionen führen.
Die Wahrscheinlichkeit, dass die Umkehrung fehlschlägt, besteht nach wie vor.
Das Stop-Loss-Tracking kann in bestimmten Märkten nicht funktionieren.
Richtung der Strategieoptimierung
Versuchen Sie, eine Kombination aus mehr Indikatoren zu testen, um eine geeignete Parameterkonfiguration zu finden.
Es ist wichtig, die Chancen zu erkennen, die sich nach einem gescheiterten Durchbruch wieder umkehren.
Verschiedene Arten von Stop Loss werden getestet, um die Stop-Loss-Methode intelligenter zu gestalten.
Zusammenfassen
Die Strategie ist mit dem Bohrband als Basis-Trading-Signal ausgestattet, aber auch mit einer Vielzahl von Hilfsindikatoren, die ein hochprobables Filtersystem bilden. Die Stop-Loss-Regel ist relativ vollständig. Die Strategie kann durch Parameteranpassung und Kennzahlenoptimierung noch weiter verbessert werden. Insgesamt bildet die Strategie ein zuverlässiges System für den Umkehrhandel.
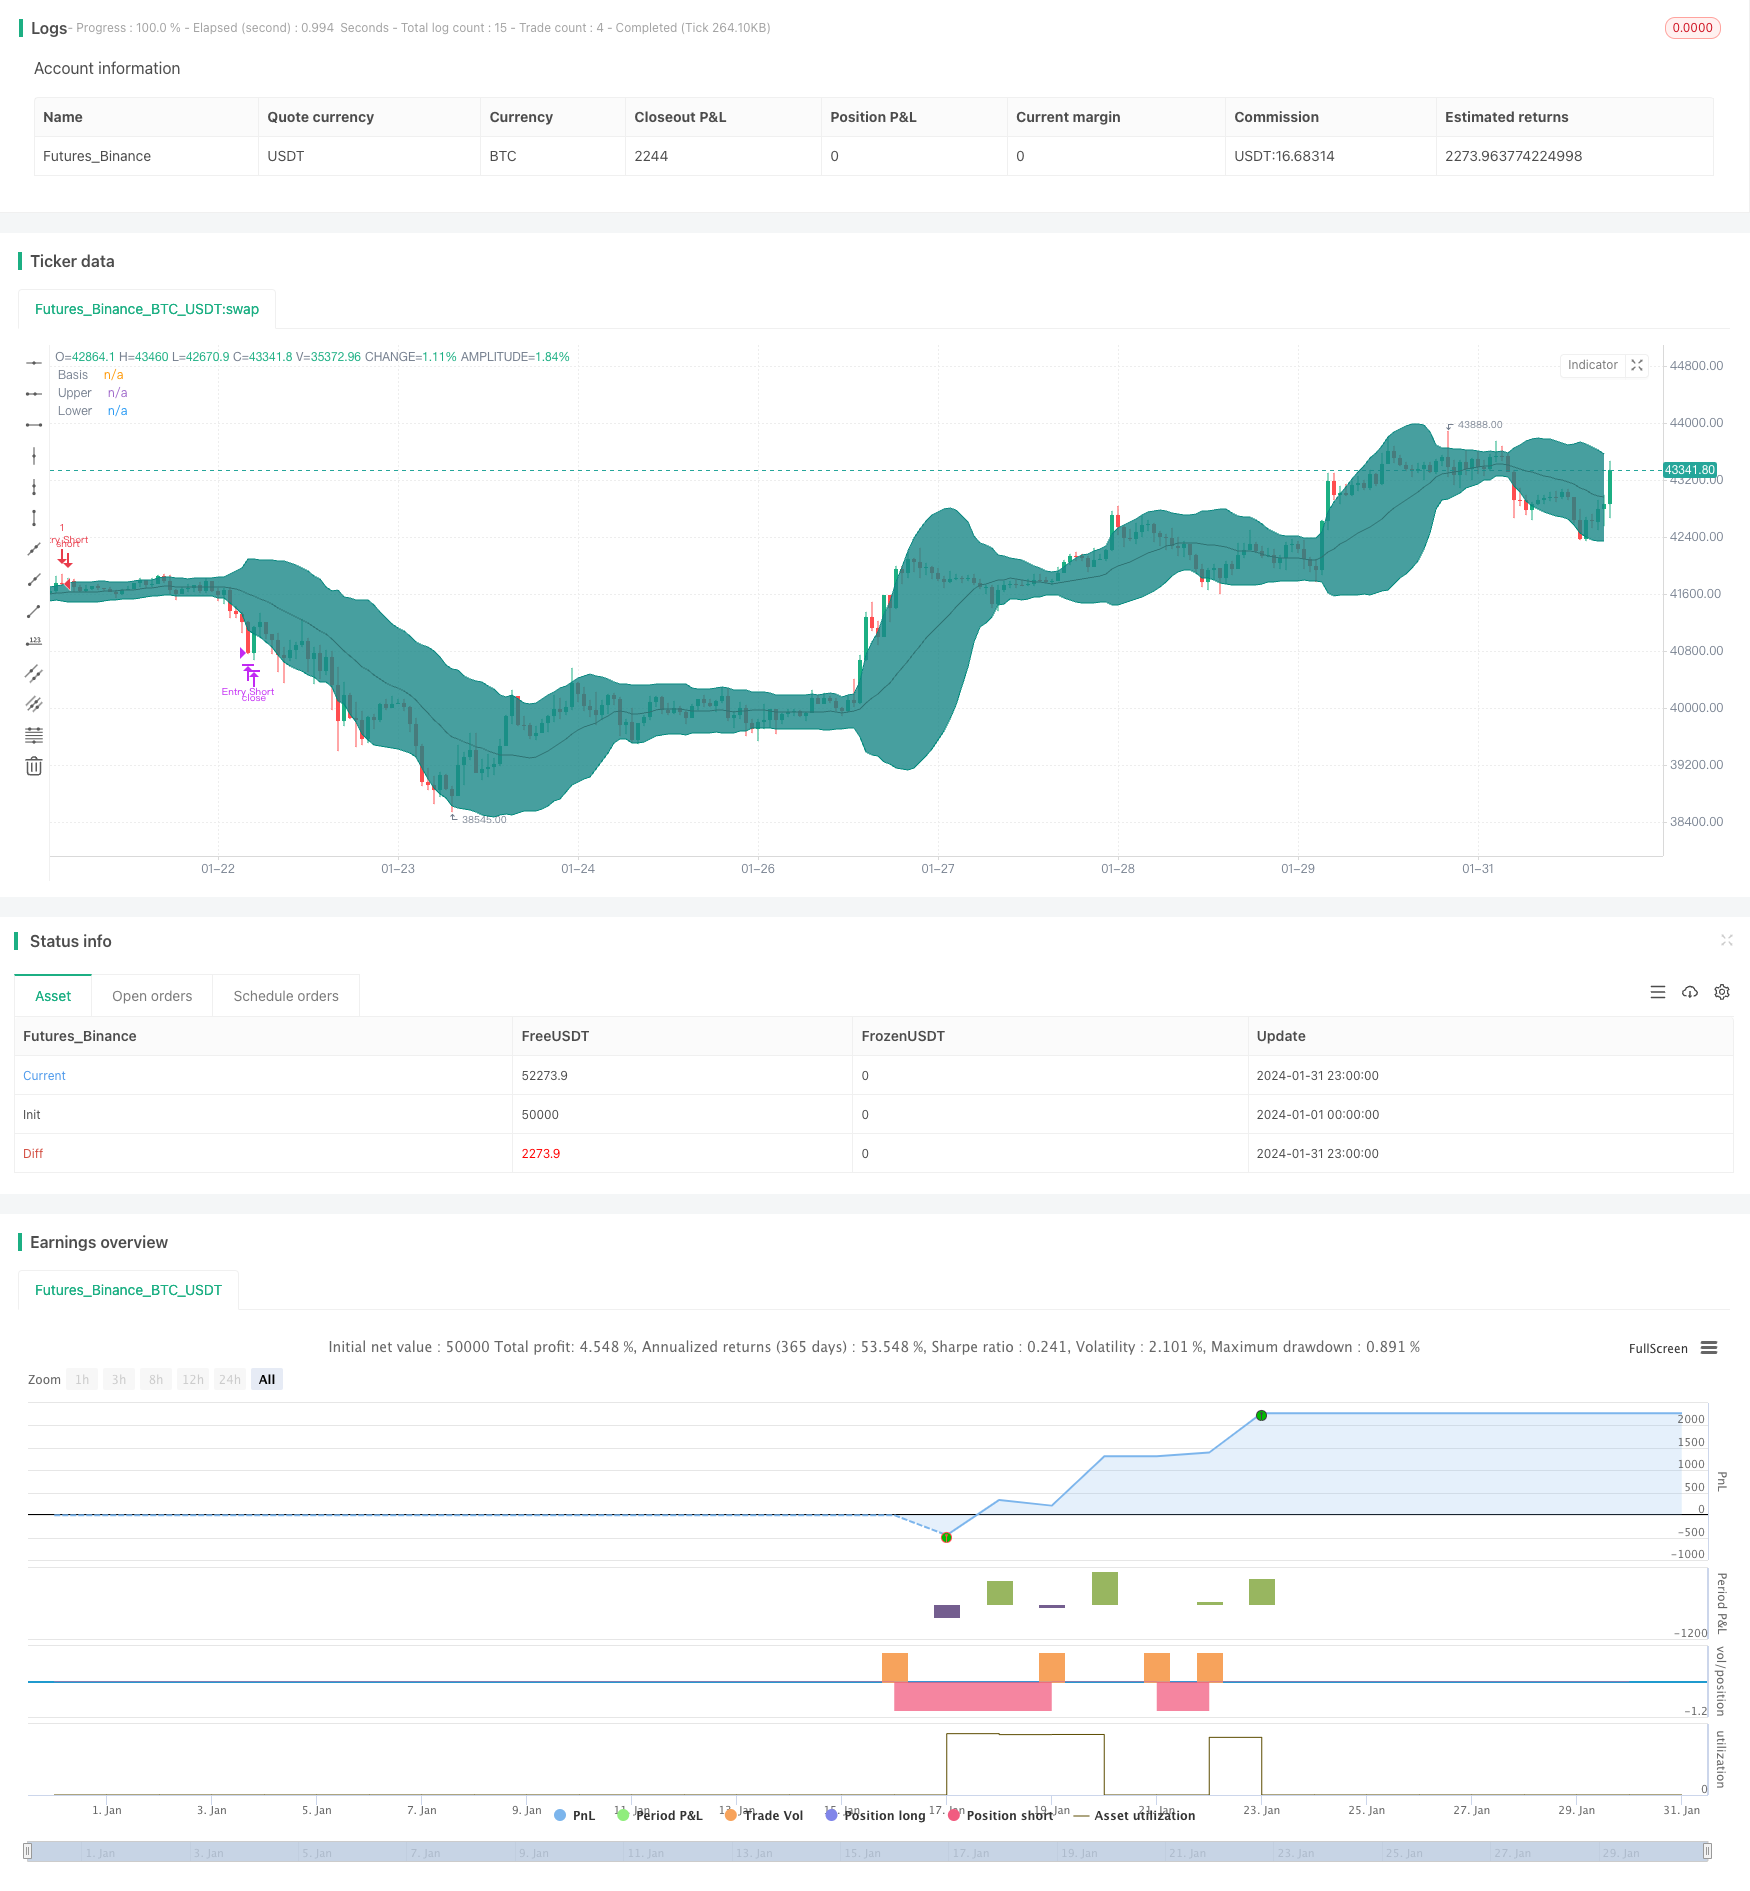
/*backtest
start: 2024-01-01 00:00:00
end: 2024-01-31 23:59:59
period: 1h
basePeriod: 15m
exchanges: [{"eid":"Futures_Binance","currency":"BTC_USDT"}]
*/

//@version=4
strategy(shorttitle="BB + EMA + RSI + ADX + ATR Reversal", title="Bollinger Bands Reversal", overlay=true)

// Inputs
ema1Input       = input(title = "EMA1 Input",                          defval = 200,   minval = 10,    maxval = 400,   step = 10,                      group = "Indicators")
ema2Input       = input(title = "EMA2 Input",                          defval = 100,   minval = 10,    maxval = 400,   step = 10,                      group = "Indicators")
length          = input(title = "BB Length",                           defval = 20,    minval=1,                                                       group = "Bollinger Band Indicator")
bbsrc           = input(title = "BB Source",                            defval = close,                                                                 group = "Bollinger Band Indicator")
mult            = input(title = "BB Standard Deviation",            type = input.float,     defval = 2.0,   minval=0.001,   maxval=50,                                      group = "Bollinger Band Indicator")
offset          = input(title = "BB Offset",                           defval = 0,     minval = -500,  maxval = 500,                                   group = "Bollinger Band Indicator")
rsilen          = input(title = "RSI Length",                          defval = 14,    minval=1,                                                       group = "RSI Indicator")
rsisrc          = input(title = "RSI Source",                           defval = close,                                                                 group = "RSI Indicator")
rsiMaxEntry     = input(title = "RSI Maximum Value",                   defval = 60,    minval = 50,    maxval = 100,                                   group = "RSI Indicator")
rsiMinEntry     = input(title = "RSI Minimum Value",                   defval = 40,    minval = 0,     maxval = 50,                                    group = "RSI Indicator")
rsiMaxExit      = input(title = "RSI Max Exit Value",                  defval = 70,    minval = 50,    maxval = 100,                                   group = "RSI Indicator")
rsiMinExit      = input(title = "RSI Min Exit Value",                  defval = 30,    minval = 0,     maxval = 50,                                    group = "RSI Indicator")
atrLength       = input(title = "ATR Length",                          defval = 14,    minval = 1,                                                     group = "ATR Indicator")
useStructure    = input(title = "Use Trailing Stop?",               type = input.bool,      defval = true,                                                                  group = "ATR Indicator")
atrlookback     = input(title = "ATR Lookback Period",                 defval = 7,     minval = 1,                                                     group = "ATR Indicator")
atrMultiplier   = input(title = "ATR Multiplier",                   type = input.float,     defval = 1.0,   minval = 0.1,                                                   group = "ATR Indicator")
sigMaxValue     = input(title = "ADX Max Value",                    type = input.float,     defval = 20.0,  minval = 0,     maxval = 100,   step = 0.1,                     group = "ADX Indicator")
adxlen          = input(title = "ADX Smoothing",                       defval = 14,                                                                    group = "ADX Indicator")
dilen           = input(title = "DI Length",                           defval = 14,                                                                    group = "ADX Indicator")

// Date input
fromMonth       = input(defval = 1,    title = "From Month",           minval = 1,     maxval = 12,    group = "Backtest Date Range")
fromDay         = input(defval = 1,    title = "From Day",             minval = 1,     maxval = 31,    group = "Backtest Date Range")
fromYear        = input(defval = 2000, title = "From Year",            minval = 1970,                  group = "Backtest Date Range")
thruMonth       = input(defval = 1,    title = "Thru Month",           minval = 1,     maxval = 12,    group = "Backtest Date Range")
thruDay         = input(defval = 1,    title = "Thru Day",             minval = 1,     maxval = 31,    group = "Backtest Date Range")
thruYear        = input(defval = 2099, title = "Thru Year",            minval = 1970,                  group = "Backtest Date Range")
inDataRange     = true

// Built in Bollinger Band
basis           = sma(bbsrc, length)
dev             = mult * stdev(bbsrc, length)
upper           = basis + dev
lower           = basis - dev
// Built in RSI
up              = rma(max(change(rsisrc), 0), rsilen)
down            = rma(-min(change(rsisrc), 0), rsilen)
rsi             = down == 0 ? 100 : up == 0 ? 0 : 100 - (100 / (1 + up / down))
// Built in ADX
dirmov(len) =>
	up = change(high)
	down = -change(low)
	plusDM = na(up) ? na : (up > down and up > 0 ? up : 0)
	minusDM = na(down) ? na : (down > up and down > 0 ? down : 0)
	truerange = rma(tr, len)
	plus = fixnan(100 * rma(plusDM, len) / truerange)
	minus = fixnan(100 * rma(minusDM, len) / truerange)
	[plus, minus]
adx(dilen, adxlen) =>
	[plus, minus] = dirmov(dilen)
	sum = plus + minus
	adx = 100 * rma(abs(plus - minus) / (sum == 0 ? 1 : sum), adxlen)
sig = adx(dilen, adxlen)

// Custom variables
ema1 = ema(close, ema1Input)
ema2 = ema(close, ema2Input)
atr = atr(atrLength)

// Entry and exit signals
CrossLongEntry  = (close <= lower or close[1] <= lower[1]) and close > open and close[1] < open[1] and close > ema1 and close > ema2 and strategy.position_size == 0 and inDataRange and rsi > rsiMinEntry and rsi < rsiMaxEntry and sig < sigMaxValue
CrossShortEntry = (close >= upper or close[1] >= upper[1]) and close < open and close[1] > open[1] and close < ema1 and close < ema2 and strategy.position_size == 0 and inDataRange and rsi > rsiMinEntry and rsi < rsiMaxEntry and sig < sigMaxValue

CrossLongExit   = (close >= upper or close[1] >= upper[1]) and close < open and close[1] > open[1] and strategy.position_size > 0 and inDataRange or rsi < rsiMinExit or rsi > rsiMaxExit
CrossShortExit  = (close <= lower or close[1] <= lower[1]) and close > open and close[1] < open[1] and strategy.position_size < 0 and inDataRange or rsi < rsiMinExit or rsi > rsiMaxExit

// Determining the stop loss based on ATR
StopLossLong    = (useStructure ? lowest(low, atrlookback) : close) - atr * atrMultiplier
StopLossShort   = (useStructure ? highest(high, atrlookback) : close) + atr * atrMultiplier

// Custom variables used to store the stoploss value
var StopLong    = 0.0
var StopShort   = 0.0
// Telling my script to store the stoploss value in the corresponding variables
if CrossLongEntry
    StopLong := StopLossLong
if CrossShortEntry
    StopShort := StopLossShort

// Strategy
strategy.entry("Entry Long", strategy.long, when = CrossLongEntry, comment = "Entry Long")
strategy.close("Entry Long", when = CrossLongExit or close < StopLong, comment = "Long Exit")

strategy.entry("Entry Short", strategy.short, when = CrossShortEntry, comment = "Entry Short")
strategy.close("Entry Short", when = CrossShortExit or close > StopShort, comment = "Short Exit")

// Plots the Bollinger Band
plot(basis, "Basis", color=#872323, offset = offset)
p1 = plot(upper, "Upper", color=color.teal, offset = offset)
p2 = plot(lower, "Lower", color=color.teal, offset = offset)
fill(p1, p2, title = "Background", color=#198787, transp=95)

// Use this if you want to see the stoploss visualised, be aware though plotting these can be confusing
// plot(StopLong)
// plot(StopShort)