BabyShark-Handelsstrategie basierend auf VWAP- und OBV-RSI-Indikatoren
Strategieübersicht
Die BabyShark VWAP-Handelsstrategie ist eine quantitative Handelsstrategie, die auf dem durchschnittlich gewichteten Durchschnittspreis (VWAP) und dem relativ schwachen OBV RSI basiert. Die Strategie soll potenzielle Kauf- und Verkaufssignale basierend auf der Abweichung des VWAP-Preises und dem Durchbruch des OBV RSI durch die spezifische Schwelle erkennen.
Strategieprinzip
Der VWAP ist ein dynamischer Durchschnitt, der auf Preis und Transaktionsmenge basiert und die wichtigsten Handelsbereiche des Marktes widerspiegelt. Wenn der Preis signifikant von VWAP abweicht, bedeutet dies normalerweise, dass der Markt überkauft oder überverkauft ist. Der OBV RSI führt einen Transaktionsfaktor auf der Grundlage des traditionellen RSI ein, um die Robustheit der Markttrends zu beurteilen, indem er die Stärke der Transaktionsänderungen misst.
Konkret verwendet die Strategie 60 K-Linien als Berechnungszyklus für VWAP und verwendet den Schlusskurs als Eingabedaten. Dann werden Überkauf- und Überverkaufszonen basierend auf der Preisdifferenz von 3 positiven und negativen Standards abweichend von VWAP erstellt. Für den OBV RSI wird 5 K-Linien als Berechnungszyklus verwendet und zwei Schwellenwerte von 70 und 30 als Kriterien für Überkauf und Überverkauf eingestellt.
In Bezug auf die Handelslogik gibt die Strategie ein Mehrsignal aus, wenn der Preis in der Überverkaufszone des VWAP-Rennens liegt und der OBV-RSI kleiner als 30 ist. Die Strategie gibt ein Nullsignal aus, wenn der Preis in der Überkaufszone des VWAP-Rennens liegt und der OBV-RSI größer als 70 ist. Die Strategie setzt außerdem eine Stop-Loss-Rate von 0,6% ein und führt nach fortlaufenden Verlusten eine Ruhezeit von 10 K-Linien ein, um das Risiko zu kontrollieren.
Strategische Vorteile
- Die Analyse der Markttrends und -bewegungen wird durch die Kombination verschiedener Marktfaktoren wie Preis und Umsatz erfasst.
- Der VWAP- und OBV-RSI-Indikator ist dynamisch und kann sich an Veränderungen in verschiedenen Marktzyklen anpassen.
- Setzen Sie eine angemessene Stop-Loss-Ratio und Ruhezeit, um Risiken effektiv zu kontrollieren und gleichzeitig Chancen zu nutzen.
- Die Logik ist klar, leicht zu verstehen und umzusetzen, mit einer gewissen Interpretierbarkeit.
- Die Parameter sind anpassbar und können für Händler mit unterschiedlichen Stilrichtungen optimiert und verbessert werden.
Strategisches Risiko
- Häufige Handelssignale können zu Überhandelungen und erhöhten Slip-Point-Kosten führen.
- In einem Trend kann die bloße Abhängigkeit von VWAP zum Stoppen zu einem vorzeitigen Ausstieg der Strategie führen, wodurch die Gewinne aus dem nachfolgenden Trend verpasst werden.
- Festgelegte Parameter-Einstellungen können sich nicht an veränderte Marktbedingungen anpassen und müssen für verschiedene Sorten und Zyklen optimiert werden.
- OBV-Indikatoren sind stark abhängig von der Transaktionsmenge, und wenn die Transaktionsdaten unwahr sind oder manipuliert werden, kann die Verfälschung der Indikatoren die Beurteilung beeinträchtigen.
- Die fehlende Berücksichtigung von externen Faktoren wie der Makroökonomie, der Nachrichtenseite und anderen Faktoren kann die Strategie bei extremen Situationen schwächen.
Optimierungsrichtung
- Die Einführung von Filterbedingungen wie Trendbestätigung, Volatilitätsindikatoren usw. für unsichere Märkte reduziert die Häufigkeit des Handels.
- Optimierung der Ausweichbedingungen, z. B. durch die Verwendung von mobilen Stopps oder in Kombination mit anderen Trend-Tracking-Indikatoren, um die Trendentwicklung besser zu erfassen.
- Die Parameter für VWAP und OBV RSI werden adaptiert und optimiert, wobei die Berechnungszyklen und die Threshold-Einstellungen dynamisch angepasst werden.
- Die Einführung eines Authentizitätsprüfmechanismus für die Transaktionsmenge erhöht die Zuverlässigkeit der OBV-RSI-Indikatoren.
- Erwägen Sie die Einbeziehung von makroökonomischen Datenanalysen, Stimmungsindikatoren usw. zur Verbesserung der Anpassungsfähigkeit und Stabilität der Strategie.
Zusammenfassen
Die BabyShark VWAP-Handelsstrategie ist eine quantitative Handelsstrategie, die eine Kombination aus einem relativ starken Index für den gewichteten Durchschnittspreis und den Energie-Trend-Indikatoren kombiniert, um Handelssignale zu erzeugen, indem sie den Überkauf-Überverkaufszustand und die Trenddynamik der Märkte erfasst. Die Strategie ist klar in der Logik und kombiniert mehrere Marktfaktoren wie Preis und Umsatz, um die Pulsfähigkeit des Marktes zu erfassen.
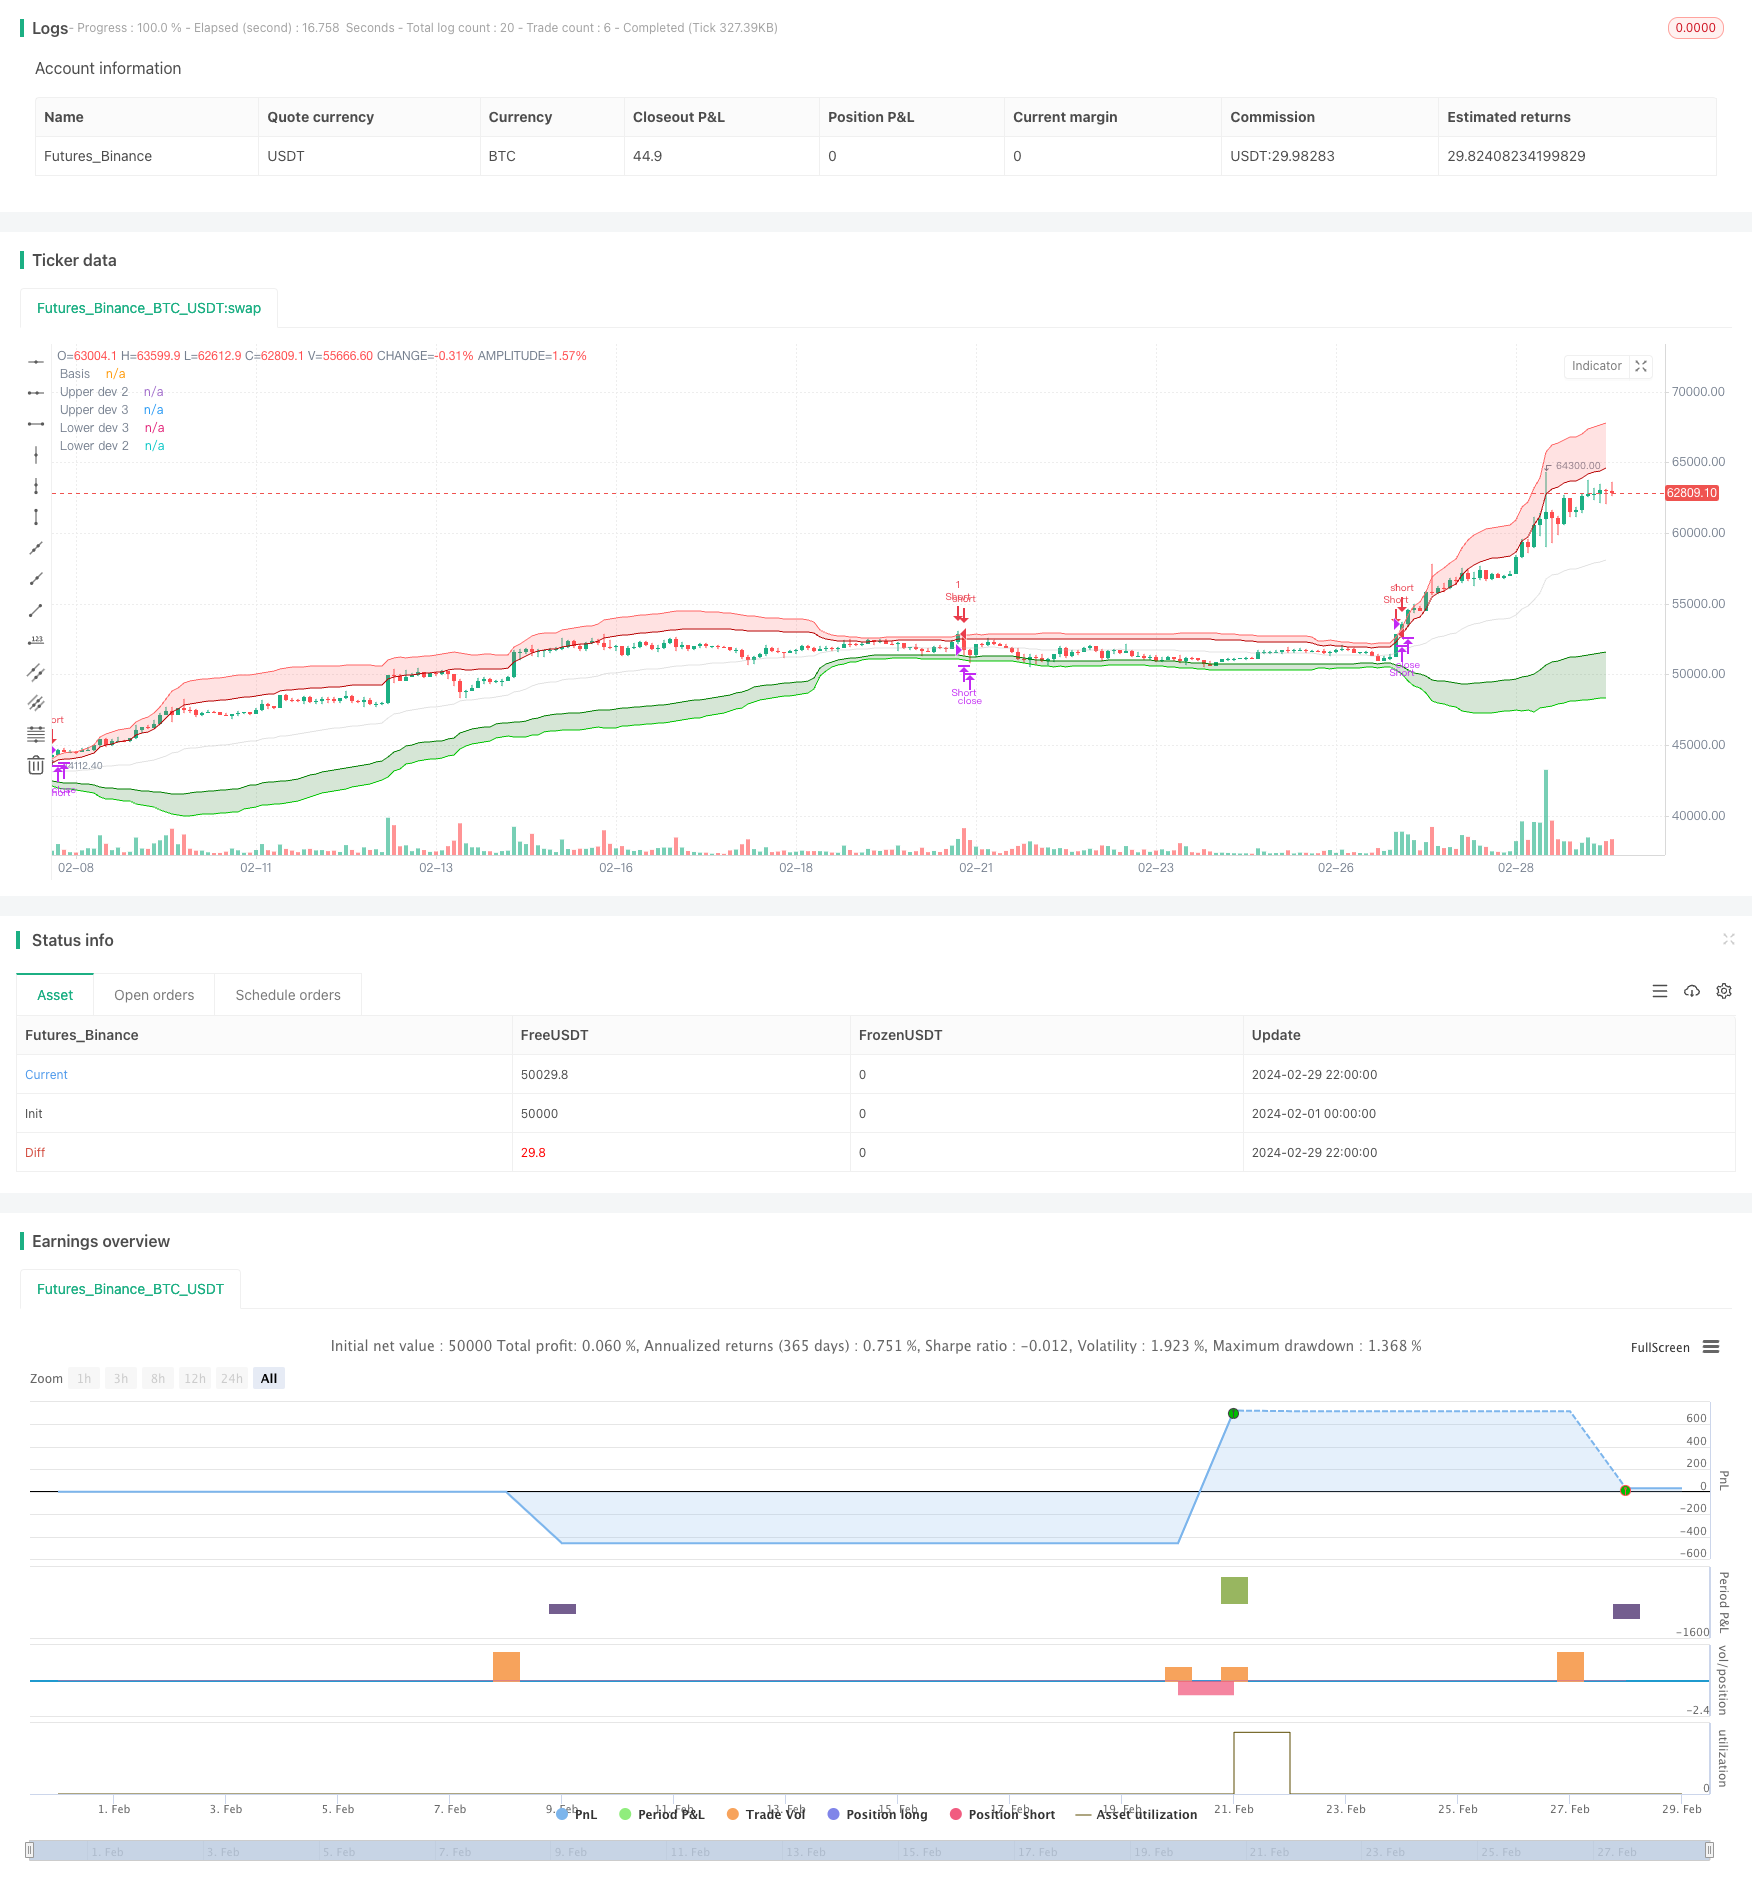
/*backtest
start: 2024-02-01 00:00:00
end: 2024-02-29 23:59:59
period: 2h
basePeriod: 15m
exchanges: [{"eid":"Futures_Binance","currency":"BTC_USDT"}]
*/

// This Pine Script™ code is subject to the terms of the Mozilla Public License 2.0 at https://mozilla.org/MPL/2.0/
// © GreatestUsername

//@version=5
strategy("BabyShark VWAP Strategy", overlay=true, margin_long=100, margin_short=100, calc_on_every_tick = true)


// VWAP
ls = input(false, title='Log-space', group = "Optional")
type = 'Average Deviation'
length = input(60, group="Strategy Modification")
source = input(close, group="Strategy Modification")
_low = ls == true ? math.log(low) : low
_high = ls == true ? math.log(high) : high
src = ls == true ? math.log(source) : source

//weighted mean
pine_vwmean(x, y) =>
    cw = 0.0
    cd = 0.0
    w_sum = 0.0
    d_sum = 0.0
    for i = 0 to y - 1 by 1
        cd := x[i]
        cw := volume[i]
        d_sum += cw * cd
        w_sum += cw
        w_sum
    d_sum / w_sum

//weighted standard deviation
pine_vwstdev(x, y, b) =>
    d_sum = 0.0
    w_sum = 0.0
    cd = 0.0
    for i = 0 to y - 1 by 1
        cd := x[i]
        cw = volume[i]
        d_sum += cw * math.pow(cd - b, 2)
        w_sum += cw
        w_sum
    math.sqrt(d_sum / w_sum)

//weighted average deviation
pine_vwavdev(x, y, b) =>
    d_sum = 0.0
    w_sum = 0.0
    cd = 0.0
    for i = 0 to y - 1 by 1
        cd := x[i]
        cw = volume[i]
        d_sum += cw * math.abs(cd - b)
        w_sum += cw
        w_sum
    d_sum / w_sum

vwmean = pine_vwmean(src, length)

//consider using Average Deviation instead of Standard Deviatio if there are values outside of 3rd upper & lower bands within a rolling window
dev = if type == 'Standard Deviation'
    dev = pine_vwstdev(src, length, vwmean)
    dev
else if type == 'Average Deviation'
    dev = pine_vwavdev(src, length, vwmean)
    dev

basis = ls == true ? math.exp(vwmean) : vwmean
plot(basis, color=color.new(#b7b7b7, 60), title='Basis')

upper_dev_2 = vwmean + dev * 2
upper_dev_3 = vwmean + dev * 3

lower_dev_2 = vwmean - dev * 2
lower_dev_3 = vwmean - dev * 3

fill(
     plot1=plot(ls == true ? math.exp(upper_dev_2) : upper_dev_2, color=color.new(#B20000, 0), title='Upper dev 2'),
     plot2=plot(ls == true ? math.exp(upper_dev_3) : upper_dev_3, color=color.new(#FF6666, 0), title='Upper dev 3', display=display.none),
     color=color.new(#FF4D4D, 80), title='Upper band'
     )
fill(
     plot1=plot(ls == true ? math.exp(lower_dev_3) : lower_dev_3, color=color.new(#00CC00, 0), title='Lower dev 3', display=display.none),
     plot2=plot(ls == true ? math.exp(lower_dev_2) : lower_dev_2, color=color.new(#008000, 0), title='Lower dev 2'),
     color=color.new(#006600, 80), title='Lower band'
     )


// Input to enable or disable the table visibility
table_visible = input(false, title="Show Table", group="Deviation Cross Monitor")
// Input for the number of candles to look back
table_length = input(300, title="Table Lookback Length", group="Deviation Cross Monitor")

// Custom count function
count_occurrences(cond, length) =>
    count = 0
    for i = 0 to length - 1
        if cond[i]
            count := count + 1
    count

// Count occurrences of prices above Upper dev 2 and below Lower dev 2

above_upper_dev_2 = count_occurrences(close > upper_dev_2, table_length)
below_lower_dev_2 = count_occurrences(close < lower_dev_2, table_length)

// Create table in the bottom right corner
var table tbl = table.new(position=position.bottom_right, rows=2, columns=2)

if table_visible
    if barstate.islast
        // Update the table headers
        table.cell(tbl, 0, 0, "Above Upper Dev 2", bgcolor=color.gray, text_color=color.white)
        table.cell(tbl, 0, 1, "Below Lower Dev 2", bgcolor=color.gray, text_color=color.white)

        // Update the table values
        table.cell(tbl, 1, 0, str.tostring(above_upper_dev_2), bgcolor=color.new(color.green, 90), text_color=color.green)
        table.cell(tbl, 1, 1, str.tostring(below_lower_dev_2), bgcolor=color.new(color.red, 90), text_color=color.red)
else
    table.delete(tbl)

// RSI
obvsrc = close
change_1 = ta.change(obvsrc)
obv = ta.cum(ta.change(obvsrc) > 0 ? volume : change_1 < 0 ? -volume : 0 * volume)

src2 = obv
len = input.int(5, minval=1, title="RSI Length", group="Strategy Modification")
up = ta.rma(math.max(ta.change(src2), 0), len)
down = ta.rma(-math.min(ta.change(src2), 0), len)
rsi = down == 0 ? 100 : up == 0 ? 0 : 100 - 100 / (1 + up / down)
higherlvl = input(70, title="Higher Level", group="Strategy Modification")
lowerlvl = input(30, title="Lower Level", group="Strategy Modification")


plot_color = rsi >= higherlvl ? color.red : rsi <= lowerlvl ? color.green : color.new(#b7b7b7, 60)
// plot(rsi, color=plot_color)

//plot(rsi, color=color.white)


// Count occurrences of RSI crossing higher level and lower level
cross_above_higher = ta.crossover(rsi, higherlvl)
cross_below_lower = ta.crossunder(rsi, lowerlvl)
above_higher_count = count_occurrences(cross_above_higher, table_length)
below_lower_count = count_occurrences(cross_below_lower, table_length)

// Create table in the bottom right corner
if (table_visible)
    var table tbl2 = table.new(position=position.bottom_right, rows=2, columns=2)
    if (barstate.islast)
        // Update the table headers
        table.cell(tbl2, 0, 0, "Higher Level Cross", bgcolor=color.gray, text_color=color.white)
        table.cell(tbl2, 0, 1, "Lower Level Cross", bgcolor=color.gray, text_color=color.white)

        // Update the table values
        table.cell(tbl2, 1, 0, str.tostring(above_higher_count), bgcolor=color.new(color.red, 90), text_color=color.red)
        table.cell(tbl2, 1, 1, str.tostring(below_lower_count), bgcolor=color.new(color.green, 90), text_color=color.green)


// Entries

// Long Entry:
// Price is in the shaded GREEN area of [Hoss] VWAP Deviation
// and the [Hoss] OBV RSI is GREEN.
longCondition1 = close <= lower_dev_3
longConditions = plot_color == color.green and longCondition1 and strategy.position_size == 0

// Short Entry:
// Price is in the shaded RED area of [Hoss] VWAP Deviation
// and the [Hoss] OBV RSI is RED.
shortCondition1 = close >= upper_dev_3
shortConditions = plot_color == color.red and shortCondition1 and strategy.position_size == 0

var int lastEntryBar = 0


shortEMA = ta.ema(close, 12)
longEMA = ta.ema(close, 21)
uptrend = shortEMA > longEMA

if longConditions and lastEntryBar < bar_index - 10 //and uptrend
    strategy.entry("Long", strategy.long, stop=close * 0.994)
    lastEntryBar := bar_index

if shortConditions and lastEntryBar < bar_index - 10 //and not uptrend
    strategy.entry("Short", strategy.short, stop=close * 1.006)
    lastEntryBar := bar_index


if strategy.position_size > 0 and (ta.crossover(close, basis) or strategy.opentrades.entry_price(strategy.opentrades - 1) * 0.994 > close)
    strategy.close("Long", immediately = true)
if strategy.position_size < 0 and (ta.crossunder(close, basis) or strategy.opentrades.entry_price(strategy.opentrades - 1) * 1.006 < close)
    strategy.close("Short", immediately = true)

// Stop Loss:
// 0.6%
// After 1 Loss => NO more Trades for 10 Candles (10 minutes) (usually a breakout will happen, and it takes average 10min till it ranges again. So basically wait for range to form again)

// Take Profit:
// Grey line on [Hoss] VWAP Deviation or 0.6%