TrendHunter w/MF Mehrzeitrahmen-Trendstrategie

Überblick
Die TrendHunter w/MF Multi-Timeframe-Trendstrategie ist eine Trendfolgestrategie, die auf mehreren technischen Indikatoren und einer Multi-Timeframe-Analyse basiert. Die Strategie berücksichtigt Faktoren wie Ichimoku-Wolken, gleitende Durchschnitte, SuperTrend, WaveTrend und MoneyFlow, um Einstiegspunkte unter strengen Bedingungen zu bestimmen und so den Haupttrend des Marktes zu erfassen.
Strategieprinzip
Das Kernprinzip der Strategie beruht auf einer integrierten Analyse mehrerer technischer Indikatoren über mehrere Zeitrahmen. Im Einzelnen:
-
Ichimoku-Wolke: Durch die Analyse der relativen Position des Kurses zur Wolke sowie der relativen Position des gleitenden Durchschnitts zur Wolke wird der aktuelle Markttrend beurteilt. Wenn der Kurs über der Wolke liegt und auch der gleitende Durchschnitt über der Wolke liegt, gilt dies als Aufwärtstrend; andernfalls als Abwärtstrend.
-
SuperTrend: Durch die Analyse der relativen Position des Kurses zum SuperTrend wird der aktuelle Markttrend bestätigt. Wenn der Kurs über dem SuperTrend liegt, gilt dies als Aufwärtstrend; andernfalls als Abwärtstrend.
-
WaveTrend: Durch die Analyse der Richtung und Position des WaveTrend-Indikators wird der aktuelle Markttrend beurteilt. Wenn der WaveTrend nach oben zeigt und den überkauften Bereich nicht erreicht hat, gilt dies als Aufwärtstrend; wenn er nach unten zeigt und den überverkauften Bereich nicht erreicht hat, als Abwärtstrend.
-
MoneyFlow: Durch die Analyse des Zustands des MoneyFlow-Indikators wird der aktuelle Markttrend bestätigt. Wenn der MoneyFlow positiv ist, gilt dies als Aufwärtstrend; andernfalls als Abwärtstrend.
Bei Long-Positionen verlangt die Strategie, dass der Kurs über der Wolke liegt, der gleitende Durchschnitt über der Wolke liegt, der SuperTrend nach oben zeigt, der WaveTrend nach oben zeigt und den überkauften Bereich nicht erreicht hat, und der MoneyFlow positiv ist. Bei Short-Positionen gilt das Gegenteil. Diese strenge Filterung mit mehreren Indikatoren und Zeitrahmen vermeidet effektiv häufige Trades in Seitwärtsmärkten und erhöht so die Stabilität und Zuverlässigkeit der Strategie.
Vorteilsanalyse
-
Hohe Zuverlässigkeit durch integrierte Beurteilung mehrerer Indikatoren: Die Strategie berücksichtigt mehrere technische Indikatoren, die sich in unterschiedlichen Marktzuständen gegenseitig ergänzen. Dies ermöglicht eine umfassende Abbildung des Markttrends und vermeidet Fehler, die bei einem einzelnen Indikator auftreten könnten.
-
Strenge Einstiegsbedingungen vermeiden häufige Trades: Die Strategie legt strenge Einstiegsbedingungen fest, bei denen mehrere Indikatoren gleichzeitig erfüllt sein müssen. Dies vermeidet effektiv häufige Trades in Seitwärtsmärkten und reduziert die Abnutzung der Strategie.
-
Multi-Timeframe-Analyse zur Erfassung des Haupttrends: Die Strategie analysiert über mehrere Zeitrahmen. Dies hilft, den Haupttrend des Marktes aus einer größeren Perspektive zu erfassen und kurzfristige Störgeräusche zu vermeiden.
-
Klare Stop-Loss-Strategie für kontrolliertes Risiko: Die Strategie verwendet den SuperTrend als Stop-Loss-Bedingung. Sobald sich der Markttrend ändert, kann die Strategie rechtzeitig stoppen und den Verlust in einem akzeptablen Rahmen halten.
Risikoanalyse
-
Fehlende dynamische Anpassung, begrenzte Anpassungsfähigkeit an Marktveränderungen: Die Parametereinstellungen der Strategie sind festgelegt und bieten keine Möglichkeit zur dynamischen Anpassung an den Marktzustand. Bei erheblichen Veränderungen des Marktzustands könnte die Strategie ihre Wirksamkeit verlieren.
-
Zu strenge Einstiegsbedingungen können Chancen verpassen: Die Einstiegsbedingungen der Strategie sind sehr streng. Dies vermeidet zwar häufige Trades, führt aber möglicherweise dazu, dass einige gute Einstiegsmöglichkeiten verpasst werden.
-
Unbekannte Anpassungsfähigkeit an extreme Marktbedingungen: Die Strategie funktioniert unter normalen Marktbedingungen gut. Ihre Anpassungsfähigkeit an extreme Marktbedingungen, wie schnelle und starke Trendwenden, muss jedoch noch getestet werden.
-
Relativ einfache Stop-Loss-Strategie mit Optimierungspotenzial: Derzeit verwendet die Strategie nur den SuperTrend als Stop-Loss-Bedingung. Dies ist zwar einfach und klar, aber es gibt Spielraum für eine weitere Optimierung der Stop-Loss-Strategie, um das Risiko besser zu kontrollieren.
Optimierungsrichtung
-
Einführung einer Marktzustandsbeurteilung zur dynamischen Parametereinstellung: Es könnte erwogen werden, Indikatoren zur Marktzustandsbeurteilung wie Volatilitätsindikatoren einzuführen. Die Strategieparameter könnten dann dynamisch an die Veränderungen des Marktzustands angepasst werden, um unterschiedlichen Marktumgebungen gerecht zu werden.
-
Optimierung der Einstiegsbedingungen zur Steigerung der Sensitivität: Es könnte eine Optimierung der Einstiegsbedingungen in Betracht gezogen werden, z. B. durch Einführung weiterer Bestätigungsindikatoren, um bei gleichbleibender Zuverlässigkeit die Sensitivität der Strategie zu erhöhen und mehr Handelsmöglichkeiten zu erfassen.
-
Hinzufügen von Maßnahmen für extreme Marktbedingungen: Für extreme Marktbedingungen, wie schnelle und starke Trendwenden, könnten spezielle Maßnahmen eingeführt werden, z. B. verstärkte Stop-Loss-Maßnahmen oder eine Handelsunterbrechung, um das Risiko der Strategie unter extremen Bedingungen zu verringern.
-
Optimierung der Stop-Loss-Strategie zur Verbesserung der Risikokontrolle: Es könnten weitere Stop-Loss-Bedingungen eingeführt werden, wie Zeit-Stop-Loss oder Balken-Stop-Loss. Auch dynamische Stop-Loss-Strategien wie Trailing-Stop-Loss könnten in Betracht gezogen werden, um das Risiko besser zu kontrollieren.
Zusammenfassung
Die TrendHunter w/MF Multi-Timeframe-Trendstrategie ist eine Trendfolgestrategie, die auf einer Multi-Indikator- und Multi-Timeframe-Analyse basiert. Durch die integrierte Berücksichtigung von Ichimoku-Wolken, gleitenden Durchschnitten, SuperTrend, WaveTrend und MoneyFlow, strenge Einstiegsbedingungen sowie eine Multi-Timeframe-Analyse kann die Strategie zuverlässig den Haupttrend des Marktes erfassen, häufige Trades in Seitwärtsmärkten vermeiden und weist eine gute Stabilität und Zuverlässigkeit auf.
Gleichzeitig hat die Strategie auch einige Einschränkungen und Risiken, wie fehlende dynamische Anpassungsfähigkeit, möglicherweise zu strenge Einstiegsbedingungen, unbekannte Anpassungsfähigkeit an extreme Marktbedingungen und eine relativ einfache Stop-Loss-Strategie. Dies sind Bereiche, in denen die Strategie in Zukunft optimiert und verbessert werden kann.
Insgesamt ist die TrendHunter w/MF Multi-Timeframe-Trendstrategie eine Trendfolgestrategie mit gutem Potenzial. Bei der Anwendung der Strategie sollten Händler ihre Prinzipien, Vorteile und Risiken vollständig verstehen und je nach eigener Risikobereitschaft und Handelsstil notwendige Anpassungen und Optimierungen vornehmen. Gleichzeitig sollten sie die Veränderungen des Marktzustands genau beobachten und die Strategie rechtzeitig anpassen, um auf Marktveränderungen zu reagieren. Nur auf der Grundlage eines tiefen Verständnisses und einer sorgfältigen Anwendung kann die Strategie ihre potenziellen Vorteile entfalten und den Händlern stabile Erträge bringen.
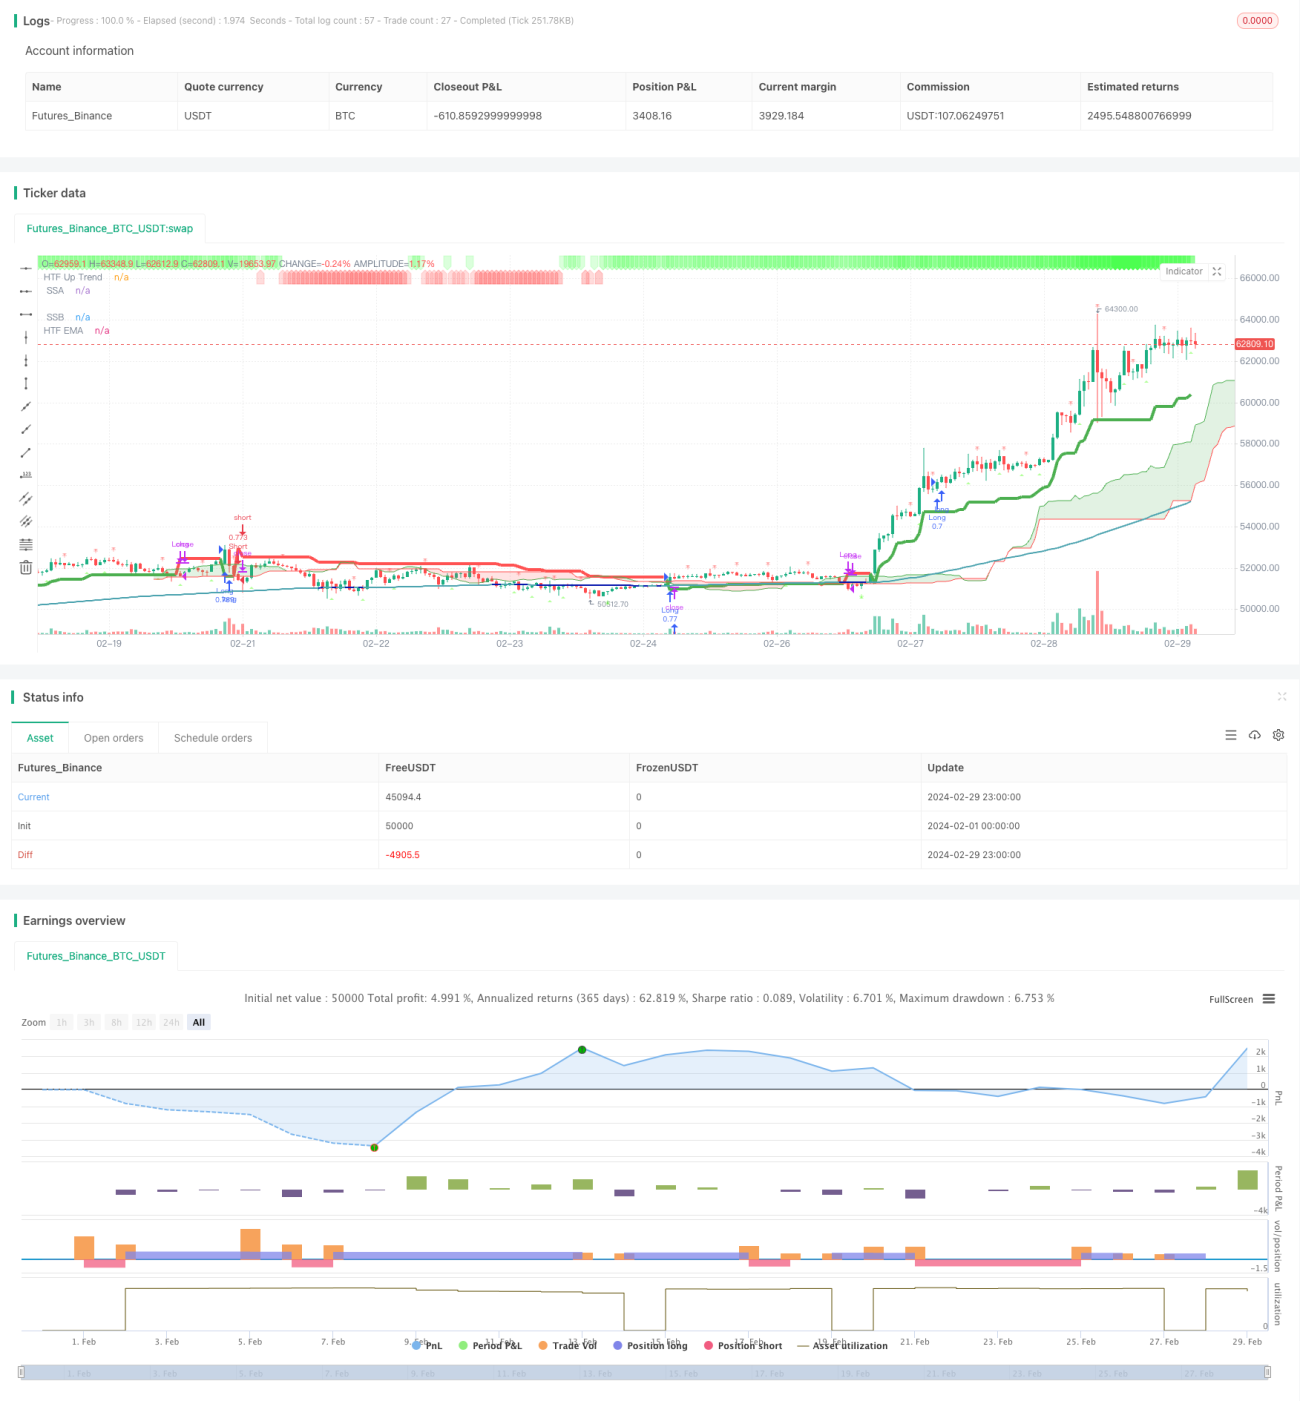
/*backtest
start: 2024-02-01 00:00:00
end: 2024-02-29 23:59:59
period: 1h
basePeriod: 15m
exchanges: [{"eid":"Futures_Binance","currency":"BTC_USDT"}]
*/

// This Pine Script™ code is subject to the terms of the Mozilla Public License 2.0 at https://mozilla.org/MPL/2.0/
// © godzcopilot / blockybears

// Thanks to anthonyf50 for his MTF Ichimoku https://www.tradingview.com/script/Pw9cBFma/- 1