MacD Indicador personalizado-marco de tiempo múltiple + Todas las opciones disponibles!
El autor:¿ Qué pasa?, Fecha: 2022-05-06 20:46:48Las etiquetas:El MACD
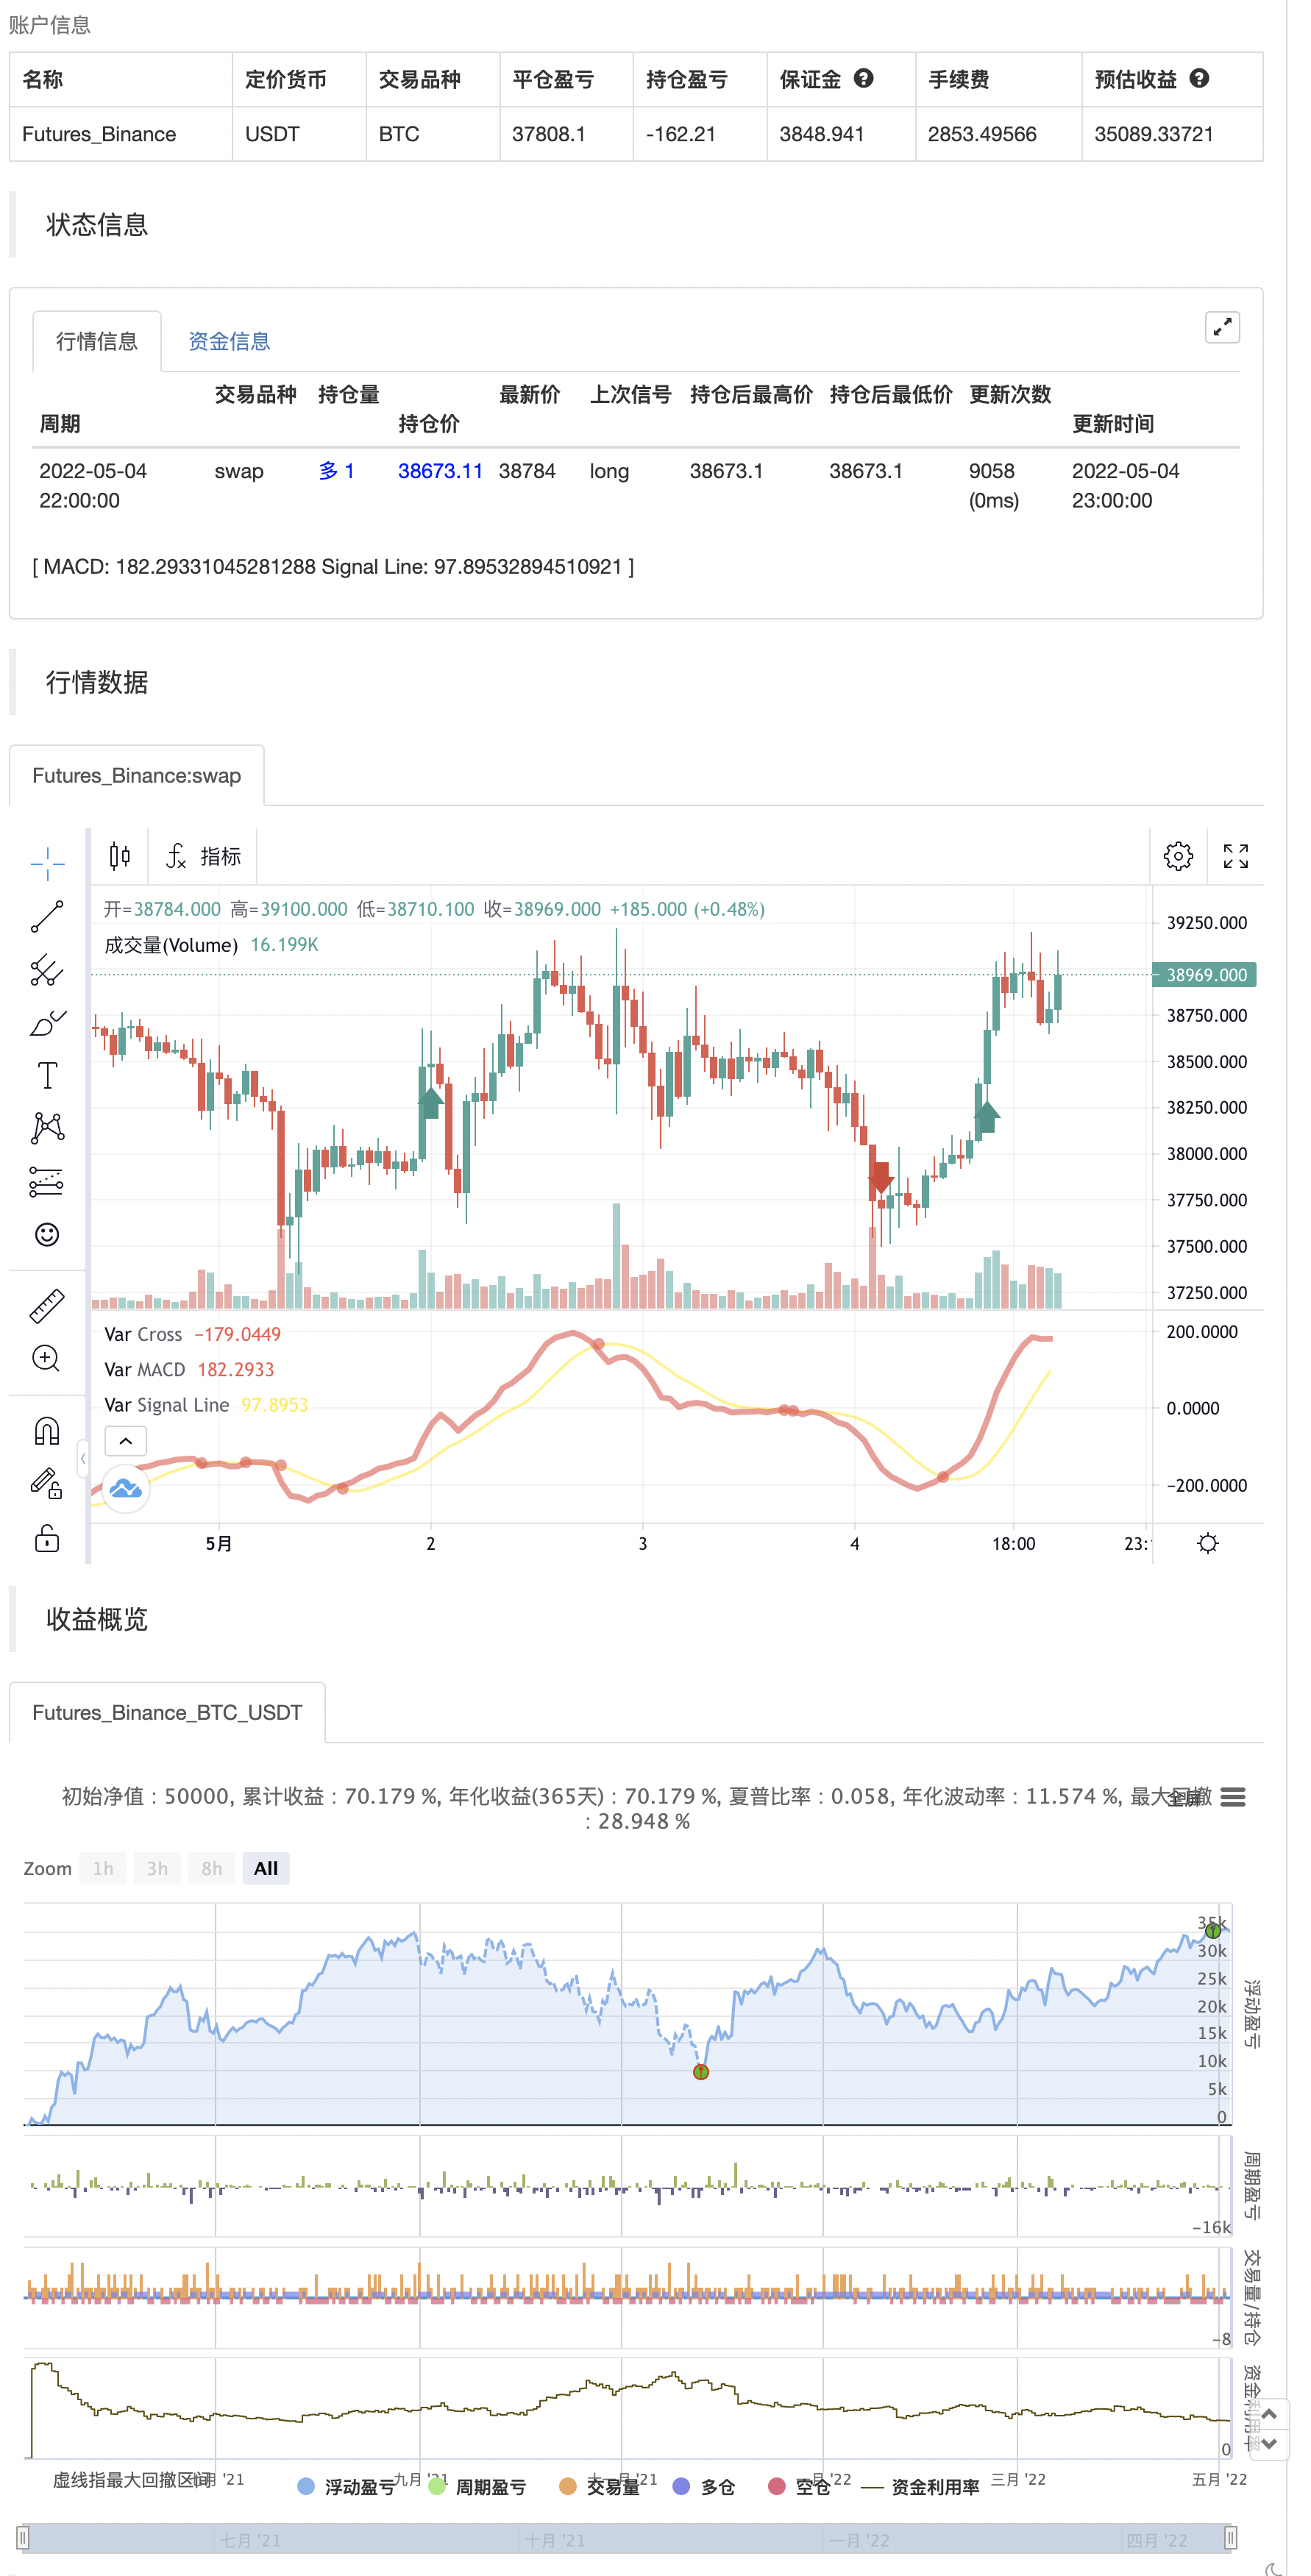
Indicador MACD regular con histograma que traza 4 colores basados en la dirección por encima y por debajo de la línea cero La actualización permite opciones de casilla de verificación, Mostrar MacD y línea de señal, Mostrar cambio en el color de la línea de MacD basado en el cruce de la línea de señal. Muestra puntos en la cruz de MacD y la línea de señal, el histograma puede mostrar 4 colores o 1, enciende y apaga el histograma. Gracias a esa increíble persona en el soporte técnico que no diré tu nombre para que no te bombardeen con correos electrónicos Tenga en cuenta la función de soporte técnico me mostró sobre cómo establecer el marco de tiempo predeterminado del indicador para el gráfico de marco de tiempo, pero también le permite elegir un marco de tiempo diferente. Por cierto, te digo que robé los puntos de la cruz de TheLark.
Las pruebas
/*backtest
start: 2021-05-05 00:00:00
end: 2022-05-04 23:59:00
period: 1h
basePeriod: 15m
exchanges: [{"eid":"Futures_Binance","currency":"BTC_USDT"}]
*/

//Created by user ChrisMoody updated 4-10-2014
//Regular MACD Indicator with Histogram that plots 4 Colors Based on Direction Above and Below the Zero Line
//Update allows Check Box Options, Show MacD & Signal Line, Show Change In color of MacD Line based on cross of Signal Line.
//Show Dots at Cross of MacD and Signal Line, Histogram can show 4 colors or 1, Turn on and off Histogram.
//Special Thanks to that incredible person in Tech Support whoem I won't say you r name so you don't get bombarded with emails
//Note the feature Tech Support showed me on how to set the default timeframe of the indicator to the chart Timeframe, but also allow you to choose a different timeframe.
//By the way I fully disclose that I completely STOLE the Dots at the MAcd Cross from "TheLark"

study(title="CM_MacD_Ult_MTF", shorttitle="CM_Ult_MacD_MTF")
source = close
useCurrentRes = input(true, title="Use Current Chart Resolution?")
resCustom = input(title="Use Different Timeframe? Uncheck Box Above", defval="60")
smd = input(true, title="Show MacD & Signal Line? Also Turn Off Dots Below")
sd = input(true, title="Show Dots When MacD Crosses Signal Line?")
sh = input(true, title="Show Histogram?")
macd_colorChange = input(true,title="Change MacD Line Color-Signal Line Cross?")
hist_colorChange = input(true,title="MacD Histogram 4 Colors?")

res = useCurrentRes ? timeframe.period : resCustom

fastLength = input(12, minval=1), slowLength=input(26,minval=1)
signalLength=input(9,minval=1)

fastMA = ta.ema(source, fastLength)
slowMA = ta.ema(source, slowLength)

outMacD = fastMA - slowMA
outSignal = ta.sma(outMacD, signalLength)
outHist = outMacD - outSignal

//outMacD = request.security(timeframe.period, res, mymacd)
//outSignal = request.security(timeframe.period, res, signal)
//outHist = request.security(timeframe.period, res, hist)

histA_IsUp = outHist > outHist[1] and outHist > 0
histA_IsDown = outHist < outHist[1] and outHist > 0
histB_IsDown = outHist < outHist[1] and outHist <= 0
histB_IsUp = outHist > outHist[1] and outHist <= 0

//MacD Color Definitions
macd_IsAbove = outMacD >= outSignal
macd_IsBelow = outMacD < outSignal

plot_color = hist_colorChange ? histA_IsUp ? color.aqua : histA_IsDown ? color.blue : histB_IsDown ? color.red : histB_IsUp ? color.maroon :color.yellow :color.gray
macd_color = macd_colorChange ? macd_IsAbove ? color.lime : color.red : color.red
signal_color = macd_colorChange ? macd_IsAbove ? color.yellow : color.yellow : color.lime

circleYPosition = outSignal

plot(smd and outMacD ? outMacD : na, title="MACD", color=macd_color, linewidth=4)
plot(smd and outSignal ? outSignal : na, title="Signal Line", color=signal_color, style=plot.style_line ,linewidth=2)
//plot(sh and outHist ? outHist : na, title="Histogram", color=plot_color, style=histogram, linewidth=4)
plot(sd and ta.cross(outMacD, outSignal) ? circleYPosition : na, title="Cross", style=plot.style_circles, linewidth=4, color=macd_color)
//hline(0, '0 Line', linestyle=hline.style_solid, linewidth=2, color=color.white)

if outMacD > outSignal and math.abs(outMacD - outSignal) >90
    strategy.entry("entry long", strategy.long)
else if outMacD < outSignal and math.abs(outMacD - outSignal) >90
    strategy.entry("entry short", strategy.short)
- Estrategia MACD avanzada con Martingale limitado
- Tendencia prejuiciada de H1 + señal MACD de M15 + estrategia de brecha de volatilidad rápida de M5
- Estrategia de cruce de la media móvil doble del MACD
- MACD RSI Ichimoku Tendencia de impulso después de una estrategia larga
- Estrategia de negociación basada en cruces de oro y de muerte MACD consecutivos
- Estrategia reforzada de cruce de la EMA con el RSI/MACD/ATR
- Estrategia de negociación a largo plazo combinada del MACD y del RSI
- Estrategia de combinación de múltiples indicadores (CCI, DMI, MACD, ADX)
- Tendencia de múltiples indicadores siguiendo la estrategia
- El CCI, el DMI y la estrategia de corto plazo híbrida MACD
- Teoría de las ondas de Elliott 4-9 Detección automática de ondas de impulso Estrategia de negociación
- Super Tendencia
- Puntos de reversión de Demark
- Los patrones de swing altos/bajos y de velas
- Superposición de TMA
- El valor de las operaciones de mercado se calcula a partir de las siguientes cifras:
- Sistema de disparo por honda CM
- Bollinger + RSI, doble estrategia v1.1
- Estrategia de bandas de Bollinger
- Seguimiento de tendencias optimizado
- Retorno mensual en las estrategias de PineScript
- ADX y DI para v4
- Indicador: Oscilador de tendencia de onda
- Indicador de impulso de compresión
- La tendencia alfa
- el comercio en marcos de tiempo múltiples
- Oscilador de sentimiento
- Bitcoin Ando se utiliza para el comercio de pares de bitcoins en efectivo para la liquidación del precio del mercado
- Estrategia de las tortugas
- Obtener su tendencia
- El uso de AlphaTrend