
Esta estrategia utiliza la ley de los promedios móviles para buscar oportunidades de rebote después de una caída a corto plazo de una acción. Cuando el promedio móvil rápido está por debajo del promedio móvil lento, indica que la acción está en una tendencia a la baja. Cuando el precio cae por debajo del promedio móvil rápido, el espacio para volver a caer es limitado.
Configure el EMA de media móvil rápida (como la línea de 8 días) y el SMA de media móvil lenta (como la línea de 20 días).
Cuando el SMA está por encima de la EMA, el indicador está en una tendencia ascendente; cuando el SMA está por debajo de la EMA, el indicador está en una tendencia descendente.
Cuando el precio rompe un cierto margen de la EMA (por ejemplo, 2-10%), las acciones entran en la zona de la sobrecaída, en este caso la probabilidad de rebote es mayor.
Cuando el precio vuelve a subir y cruza la EMA, es una señal de compra.
La línea de parada está situada cerca de la EMA, la línea de parada está situada cerca de la media media de movimiento lento intermedio (SMA) (como la línea de 50 días), o se detiene en cierta proporción.
Cuando el precio vuelve a caer por debajo de la EMA, se detiene la liquidación.
El uso de la ley de la media móvil es relativamente fiable.
El uso de medias móviles rápidas y condiciones de sobrevaloración puede aumentar la probabilidad de determinar un rebote de sobrevaloración.
Se puede configurar el Stop Loss y el Stop Stop para controlar el riesgo.
Se puede configurar con flexibilidad la proporción de posiciones para diferentes preferencias de riesgo.
Aunque se ha añadido una condición de sobrevaloración, existe la probabilidad de que el rebote falle.
Las medias móviles son por sí mismas bastante retrasadas y suelen sufrir rebote local.
El punto de parada está cerca de la media móvil rápida, y es fácil de golpear cuando hay grandes fluctuaciones.
Algunos de los parámetros requieren configuración manual, y los diferentes parámetros tienen un mayor impacto en los resultados.
El efecto es más correlacionado con la elección de la acción.
Aumentar los indicadores de tendencia y evitar las operaciones en contra.
Se incluyen filtros de indicadores como el volumen de transacciones para aumentar la probabilidad de éxito.
El punto de parada puede tener en cuenta el seguimiento dinámico, reduciendo la probabilidad de que el punto de parada sea golpeado.
Se puede estudiar la combinación óptima de parámetros para reducir la dependencia de los mismos.
Se puede combinar con las condiciones de selección de acciones para mejorar la efectividad de la selección de acciones.
La idea general de la estrategia es clara, fácil de entender y es un ejemplo típico de la estrategia de inversión de la media móvil. La ventaja es que es relativamente estable, puede controlar el riesgo y es adecuado para los principiantes. Pero también existe el problema de que no se puede juzgar correctamente el punto de inflexión con cierta probabilidad.
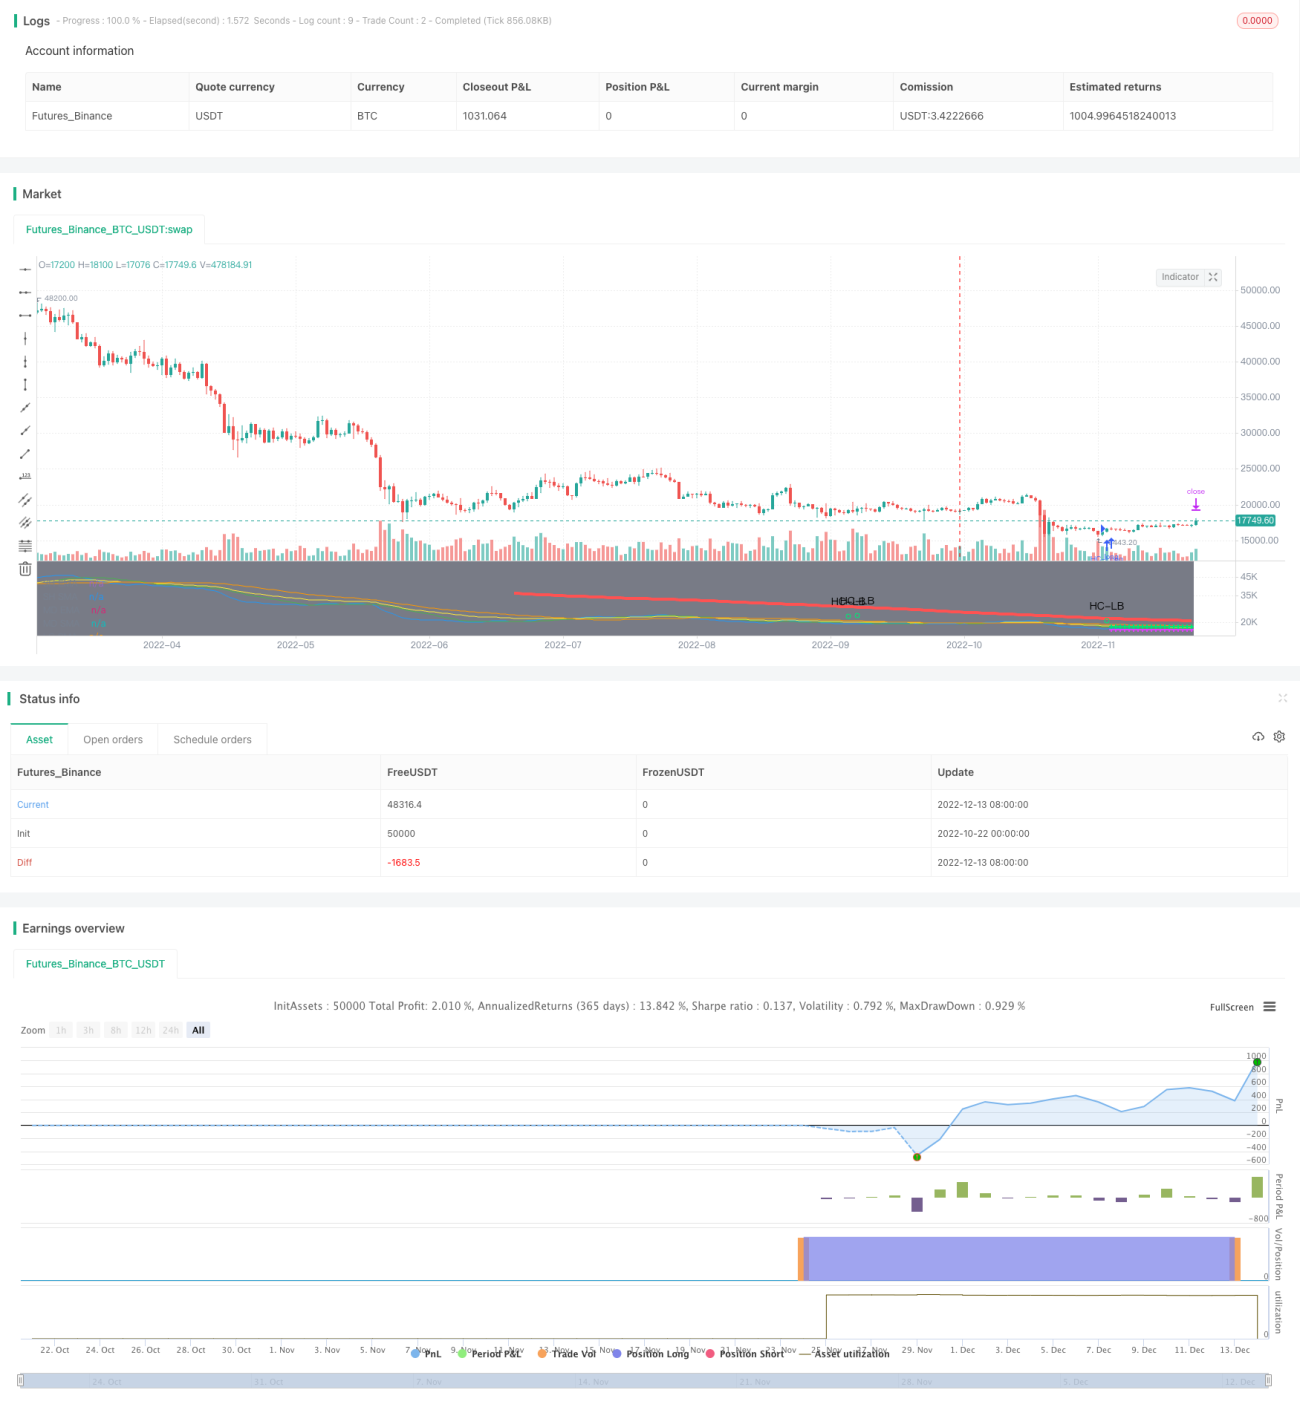
/*backtest
start: 2022-10-22 00:00:00
end: 2022-12-14 00:00:00
period: 1d
basePeriod: 1h
exchanges: [{"eid":"Futures_Binance","currency":"BTC_USDT"}]
*/
//@version=4
// This source code is subject to the terms of the Mozilla Public License 2.0 at https://mozilla.org/MPL/2.0/
// © MakeMoneyCoESTB2020
//*********************Notes for continued work***************
//************************************************************
//I. Intro
//This strategy is designed to allow you to catch the bounce or "SNAP Back" of a equity that has been in a downward trend.
//Once the moving averages are in the order of 200SMA > 50 SMA > 34EMA > 20SMA > 8EMA, the strategy is setup.
//Next you wait for a trigger of the closing price crossing over the 8EMA, while there is a desired gap size between the 8EMA and the 20SMA (2-10% of stock value preferred).
//Exit position based on target profit reached (conservative sell half at 34EMA and engage a trailing stop loss for remainder or set static limit) or price crosses 8EMA or stop loss%
//*)This code also allows you to determine your desired backtesting date compliments of alanaster
//This code is the product of many hours of hard work on the part of the greater tradingview community. The credit goes to everyone in the community who has put code out there for the greater good.
//The idea for the coding came from video I watched on YouTube presented by TradeStation called Snap Back - thank you guys for the inspiration.
//UPDATE: I have coded the other side of the strategy to allow you to take advantage of the same set-up in an uptrend for Short plays. You can turn the up or downsides on, off, or both.
//Happy Hunting!
//II. Table Of Contents
// 1. Define Strategy Variables
// 2. Perform Calculations
// 3. Display Chart Information
// 4. Determine Entry Conditions
// 5. Determine Exit Conditions
// 1. Define Strategy Variables*************************************************************************************************************************************************************************
//Title
// strategy("SNAP BACK 2.0 Strategy", shorttitle="SNAP Back 2.0", default_qty_type=strategy.percent_of_equity, default_qty_value=5, initial_capital=20000,slippage=2, currency=currency.USD, overlay=true)
//Define calculations price source
price = input(title="Price Source", defval=close)
//Define Trade Agression Level
aggro=input(title="Aggressive = 0, Conservative = 1", defval=0, options=[0, 1])
//Define Gap percentage allowed between 8EMA and 20SMA
GAP=input(title="Gap% between 8EMA & 20SMA", defval=2, minval=0, maxval=25, step=1)/100
//Does user want to run the Strategy for Trending Up or Trending Down
RunTrend=input(title="Run Strategy Trending Up, Down, or Both", defval="Up", options=["Up", "Down", "Both"])
//Initialize 8/34EMA 20/50/200/200SMA
SH_EMA_length= input(title="SH EMA Length", defval=8) //short EMA length
MD_EMA_length= input(title="MD EMA Length", defval=34) //medium EMA length
SH_SMA_length= input(title="SH SMA Length", defval=20) //short SMA length
MD_SMA_length= input(title="LG SMA Length", defval=50) //medium SMA length
LG_SMA_length= input(title="SH SMA Length", defval=200) //long SMA length
SH_EMA=ema(price, SH_EMA_length) //short EMA
MD_EMA=ema(price, MD_EMA_length) //medium EMA
SH_SMA=sma(price, SH_SMA_length) //short SMA
MD_SMA=sma(price, MD_SMA_length) //medium SMA
LG_SMA=sma(price, LG_SMA_length) //long SMA
// 2. Perform Calculations*************************************************************************************************************************************************************************
// ************************************ INPUT BACKTEST RANGE ******************************************=== coutesy of alanaster
fromMonth = input(defval = 4, title = "From Month", type = input.integer, minval = 1, maxval = 12)
fromDay = input(defval = 1, title = "From Day", type = input.integer, minval = 1, maxval = 31)
fromYear = input(defval = 2020, title = "From Year", type = input.integer, minval = 1970)
thruMonth = input(defval = 1, title = "Thru Month", type = input.integer, minval = 1, maxval = 12)
thruDay = input(defval = 1, title = "Thru Day", type = input.integer, minval = 1, maxval = 31)
thruYear = input(defval = 2112, title = "Thru Year", type = input.integer, minval = 1970)
// === INPUT SHOW PLOT ===
showDate = input(defval = true, title = "Show Date Range", type = input.bool)
// === FUNCTION EXAMPLE ===
start = timestamp(fromYear, fromMonth, fromDay, 00, 00) // backtest start window
finish = timestamp(thruYear, thruMonth, thruDay, 23, 59) // backtest finish window
window() => true // create function "within window of time"
bgcolor(color = showDate and window() ? color.gray : na, transp = 90)
// 3. Display Chart Information*************************************************************************************************************************************************************************
//plot EMAs
plot(SH_EMA, title = "SH EMA", color = color.blue)
plot(MD_EMA, title = "MD EMA", color = color.yellow)
//plot SMAs
plot(SH_SMA, title = "SH SMA", color = color.green)
plot(MD_SMA, title = "MD SMA", color = color.orange)
plot(LG_SMA, title = "LG SMA", color = color.red, linewidth = 4, transp = 70)
// 4. Determine Entry Conditions*************************************************************************************************************************************************************************
//Determine if SNAP Back (SB) setup is present:
SB_RB_Up= false //SB_RB_Up = Snap Back RainBow for an Uptrend Swing
SB_RB_Up:= iff(LG_SMA>MD_SMA and MD_SMA>MD_EMA and MD_EMA>SH_SMA and SH_SMA>SH_EMA, true, false) //is the 200SMA > 50 SMA > 34EMA > 20SMA > 8EMA
// plotshape(SB_RB, title= "SB_RB", color=color.black, style=shape.cross, text="Rainbow") //for testing only
SB_RB_DWN= false //SB_RB_DWN = Snap Back RainBow for a Downtrend Swing
SB_RB_DWN:= iff(LG_SMA<MD_SMA and MD_SMA<MD_EMA and MD_EMA<SH_SMA and SH_SMA<SH_EMA, true, false) //is the 200SMA < 50 SMA < 34EMA < 20SMA < 8EMA
SB_Gap=false
SB_Gap:= iff(abs(SH_SMA-SH_EMA)>(price*GAP), true, false) //is there a greater than "GAP"% of the price gap between the 8EMA and 20SMA
SB_SetUp_Up=false
SB_SetUp_Up:= iff(SB_RB_Up and SB_Gap, true, false)//Uptrend Setup both conditions must be true
//plotshape(SB_SetUp, title= "SB_SetUp", color=color.white, style=shape.diamond, text="Set Up") //for testing
SB_SetUp_DWN=false
SB_SetUp_DWN:= iff(SB_RB_DWN and SB_Gap, true, false)//Downtrend Setup both conditions must be true
//Determine trigger (TGR) for entry
SB_TGR_Up=false
SB_TGR_Up:= iff(iff(aggro==0, crossover(price, SH_EMA), true) and iff(aggro==1, crossover(price[aggro],SH_EMA) and price>open[aggro], true), true, false) //if the price crosses over the 8EMA that is our entry signal, aggro determines how aggressively we enter the position (wait for a confirmaiton bar or not)
SB_TGR_DWN=false
SB_TGR_DWN:= iff(iff(aggro==0, crossunder(price, SH_EMA), true) and iff(aggro==1, crossunder(price[aggro],SH_EMA) and price<open[aggro], true), true, false) //if the price crosses under the 8EMA that is our entry signal, aggro determines how aggressively we enter the position (wait for a confirmaiton bar or not)
//Determine when to run the strategy based on user input for uptrend or downtrend
RunTrendUp=false //Varibile for running the Strategy in an UpTrend
RunTrendUp:= iff(RunTrend == "Up" or RunTrend == "Both", true, false)
RunTrendDWN=false //Varibile for running the Strategy in a DownTrend
RunTrendDWN:= iff(RunTrend == "Down" or RunTrend == "Both", true, false)
//Determine full buy conditions
MAbuy=false//long entry variable
MAbuy := iff(SB_SetUp_Up and SB_TGR_Up and RunTrendUp, true, false) //when both the setup, the trigger, and RunTrend are true return true
plotshape(MAbuy, title= "HC-LB", color=color.lime, style=shape.circle, text="HC-LB")
strategy.entry("HC-Long", strategy.long, comment="HC-Long", when = MAbuy and window())
MAsell=false//short entry variable
MAsell := iff(SB_SetUp_DWN and SB_TGR_DWN and RunTrendDWN, true, false) //when both the setup, the trigger, and RunTrend are true return true
plotshape(MAsell, title= "HC-SB", color=color.purple, style=shape.circle, text="HC-SB")
strategy.entry("HC-Short", strategy.short, comment="HC-Short", when = MAsell and window())
// 5. Submit Profit and Loss Exit Calculations Orders*************************************************************************************************************************************************************************
//Stop Criteria
StpCri=input(title="Stop Criteria: SL or SH_EMA", defval="SL", options=["SL", "SH_EMA"])
//Profit Criteria
ProCri=input(title="Profit Criteria: TGT% or MD_EMA", defval="TGT%", options=["TGT%", "MD_EMA"])
// User Options to Change Inputs (%)
TrailPerc = input(title="Trail Loss %", type=input.float, minval=0, step=1, defval=6) /100
stopPer = input(4, title='Stop Loss %', type=input.float) / 100
takePer = input(6, title='Take Profit %', type=input.float) / 100
//Percent of SH_EMA to use for StopLoss
SH_EMA_percent = input(96, title="% of SH_EMA for Stop")/100
//Percent of MD_EMA to use for Take Profit
MD_EMA_percent = input(100, title="% of MD_EMA for Profit")/100
//calculate Trail stop price for MD_EMA TGT% condition
longStopPrice=0.0//long side entry stop variable
longStopPrice := if (strategy.position_size > 0)
stopValue = close * (1 - TrailPerc)
max(stopValue, longStopPrice[1])
else
0
shortStopPrice=0.0//short side entry stop variable
shortStopPrice := if (strategy.position_size < 0)
shortStopValue = close * (1 + TrailPerc)
min(shortStopValue, shortStopPrice[1])
else
999999
// Determine where you've entered and in what direction
longStop = strategy.position_avg_price * (1 - stopPer)
shortStop = strategy.position_avg_price * (1 + stopPer)
shortTake = strategy.position_avg_price * (1 - takePer)
longTake = strategy.position_avg_price * (1 + takePer)
//exit position conditions and orders
if strategy.position_size > 0 //long side exit conditions
if StpCri=="SL" and ProCri=="TGT%"
strategy.exit(id="Close Long", when = window(), stop=longStop, limit=longTake)// sell when either the TGT or the SL is hit
if StpCri=="SL" and ProCri=="MD_EMA"
strategy.exit(id="Close Long (50%)", when = window(), stop=longStop, limit=MD_EMA_percent*MD_EMA, qty_percent=50)// sell 50% when MD_EMA hit or SL then transition to a trailing stop loss
strategy.exit(id="Close Long Trailing Stop", when = window(), stop=longStopPrice, qty_percent=100)
if StpCri=="SH_EMA" and ProCri=="MD_EMA"
strategy.exit(id="Close Long (50%)", when = window(), stop=SH_EMA*SH_EMA_percent, limit=MD_EMA_percent*MD_EMA, qty_percent=50)// sell 50% when MD_EMA hit or SH_EMA hit then transition to a trailing stop loss
strategy.exit(id="Close Long Trailing Stop", when = window(), stop=longStopPrice, qty_percent=100)
if StpCri=="SH_EMA" and ProCri=="TGT%"
strategy.exit(id="Close Long", when = window(), stop=SH_EMA*SH_EMA_percent, limit=longTake)// sell when either the TGT or the SH_EMA is hit
if strategy.position_size < 0 //short side exit conditions
if StpCri=="SL" and ProCri=="TGT%"
strategy.exit(id="Close Short", when = window(), stop=shortStop, limit=shortTake)// sell when either the TGT or the SL is hit
if StpCri=="SL" and ProCri=="MD_EMA"
strategy.exit(id="Close Short (50%)", when = window(), stop=shortStop, limit=(2-MD_EMA_percent)*MD_EMA, qty_percent=50)// sell 50% when MD_EMA hit or SL then transition to a trailing stop loss
strategy.exit(id="Close Short Trailing Stop", when = window(), stop=shortStopPrice, qty_percent=100)
if StpCri=="SH_EMA" and ProCri=="MD_EMA"
strategy.exit(id="Close Short (50%)", when = window(), stop=SH_EMA*(2-SH_EMA_percent), limit=(2-MD_EMA_percent)*MD_EMA, qty_percent=50)// sell 50% when MD_EMA hit or SH_EMA hit then transition to a trailing stop loss
strategy.exit(id="Close Short Trailing Stop", when = window(), stop=shortStopPrice, qty_percent=100)
if StpCri=="SH_EMA" and ProCri=="TGT%"
strategy.exit(id="Close Short", when = window(), stop=SH_EMA*(2-SH_EMA_percent), limit=shortTake)// sell when either the TGT or the SH_EMA is hit
// Plot stop trailing loss values for confirmation
plot(series=(strategy.position_size > 0 and (ProCri == "MD_EMA")) ? longStopPrice : na, color=color.fuchsia, style=plot.style_cross, linewidth=2, title="Long Trail Stop") //plot the trailing stop on the chart for an uptrend
plot(series=(strategy.position_size < 0 and (ProCri == "MD_EMA")) ? shortStopPrice : na, color=color.fuchsia, style=plot.style_cross, linewidth=2, title="Short Trail Stop") //plot the trailing stop on the chart for a downtrend
//plot fixed stop loss value
plot(series=(strategy.position_size > 0 and (StpCri == "SL")) ? longStop : na, color=color.fuchsia, style=plot.style_cross, linewidth=2, title="Long Trail Stop") //plot the stop on the chart for an uptrend
plot(series=(strategy.position_size < 0 and (StpCri == "SL")) ? shortStop : na, color=color.fuchsia, style=plot.style_cross, linewidth=2, title="Short Trail Stop") //plot the stop on the chart for a downtrend
//plot highlight of SH_EMA% used for stop exit condition
plot(series=(strategy.position_size > 0 and (StpCri == "SH_EMA")) ? SH_EMA*SH_EMA_percent : na, color=color.fuchsia, style=plot.style_cross, linewidth=2, title="Short Trail Stop") //plot the SH_EMA based stop on the chart for a uptrend
plot(series=(strategy.position_size < 0 and (StpCri == "SH_EMA")) ? SH_EMA*(2-SH_EMA_percent) : na, color=color.fuchsia, style=plot.style_cross, linewidth=2, title="Short Trail Stop") //plot the SH_EMA based stop on the chart for a downtrend
//plot the TGT profit points
plot(series=(strategy.position_size > 0 and (ProCri == "TGT%")) ? longTake : na, color=color.lime, style=plot.style_cross, linewidth=2, title="Short Trail Stop") //plot the TGT% for long position
plot(series=(strategy.position_size > 0 and (ProCri == "MD_EMA")) ? MD_EMA_percent*MD_EMA : na, color=color.lime, style=plot.style_cross, linewidth=2, title="Short Trail Stop") //plot the MD_EMA % TGT for long position
plot(series=(strategy.position_size < 0 and (ProCri == "TGT%")) ? shortTake : na, color=color.lime, style=plot.style_cross, linewidth=2, title="Short Trail Stop") //plot the TGT% for short position
plot(series=(strategy.position_size < 0 and (ProCri == "MD_EMA")) ? (2-MD_EMA_percent)*MD_EMA : na, color=color.lime, style=plot.style_cross, linewidth=2, title="Short Trail Stop") //plot the MD_EMA % TGT for short position