
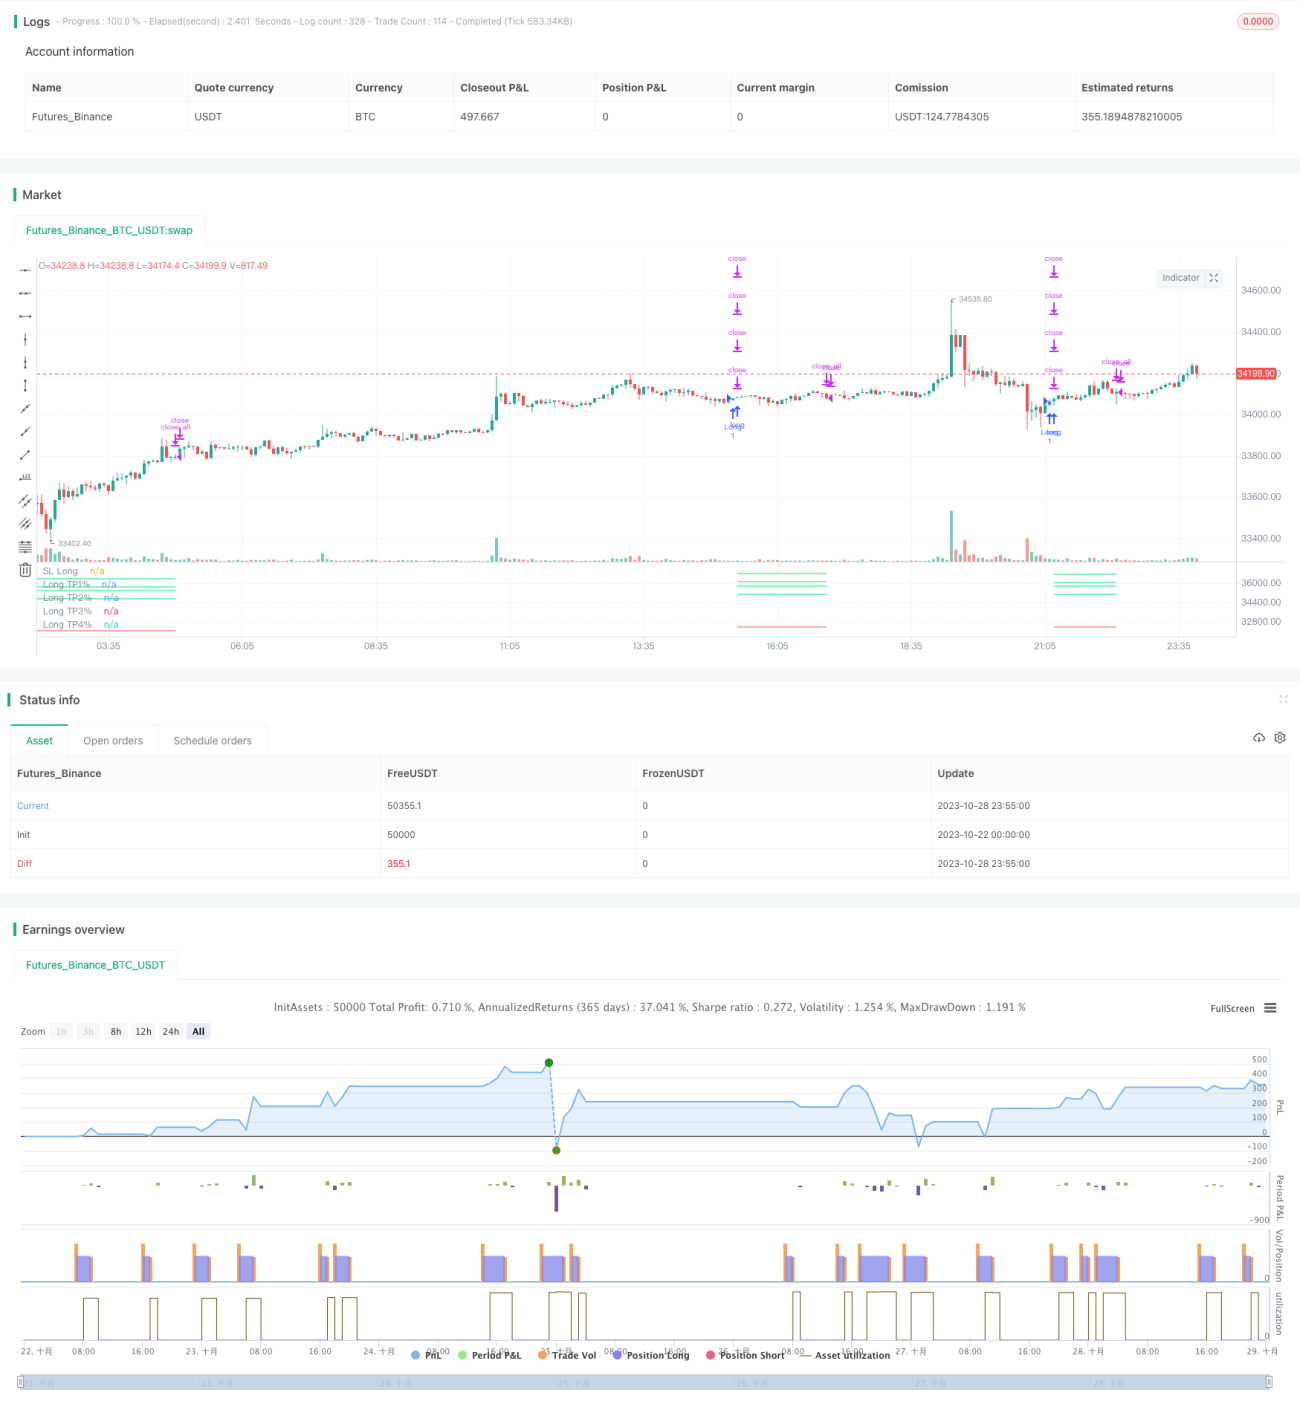
La estrategia tiene como objetivo lograr la gestión de las paradas en múltiples marcos de tiempo. La estrategia utiliza al mismo tiempo paradas porcentuales y paradas de áreas de precios clave por encima de los marcos de tiempo principales, para lograr una gestión de paradas más precisa y efectiva.
La estrategia comienza con la introducción de un indicador de tendencia de ondas, y se hace una entrada de múltiples señales según el indicador Gold Forks.
En el caso de la gestión de las paradas, la estrategia utiliza dos métodos de paradas:
Limite porcentual: establece varios límites por ciertos porcentajes del precio de entrada.
Paradas de marco temporal múltiple: se trazan líneas medias en el diagrama y en el diagrama de 4 horas, tomando el precio de estas líneas medias como precio de parada.
Para el porcentaje de stop, la estrategia establece 4 diferentes porcentajes de precio de parada. Cuando el precio toca cada precio de parada, se cancela la posición en función del porcentaje establecido.
Para los paros de varios marcos de tiempo, la estrategia es trazar el promedio de 100 días y el promedio de 200 días respectivamente en la línea diaria y la línea de 4 horas. Tomar el precio de estos promedios como precio de parada y cerrar la posición cuando el precio toque.
Además, la estrategia también establece un precio de stop loss. Cuando el precio es inferior al precio de stop loss, se cancela toda la posición.
La estrategia completa permite una gestión más completa y precisa de la detención mediante la combinación de la detención por porcentaje y la detención por marco de tiempo múltiple.
El uso de esterilización porcentual, esterilización en proporciones fijas, para evitar esterilización prematura o insuficiente.
El análisis de múltiples marcos de tiempo permite establecer precios de parada más precisos y una mejor selección de puntos de parada.
La prevención de la fiebre puede realizarse en varios niveles, lo que reduce el riesgo.
Establezca un precio de stop loss y controle el riesgo de bajada.
La combinación del uso de esterilización porcentual y el esterilización de múltiples marcos de tiempo, hace que la esterilización sea más completa y refinada.
El porcentaje de parada depende de la configuración de los parámetros, si los parámetros están mal configurados, puede causar parada prematura o tardía.
El análisis de múltiples marcos de tiempo depende de la mediana, que tiene un cierto retraso y puede desviarse.
La posición incorrecta de la parada de pérdidas puede causar pérdidas innecesarias.
Se necesitan parámetros de optimización adecuados para lograr la mejor combinación entre el estancamiento porcentual y el estancamiento de múltiples marcos de tiempo.
Se pueden probar más indicadores de la media y elegir una media más favorable como precio de parada clave.
Se puede probar el método de predicción del modelo, que predice las áreas clave del precio como precios de parada.
Se pueden introducir más reglas de frenado, como la proporción de frenado esperada, el frenado móvil, etc., para que el frenado sea más completo.
Se puede probar el parámetro de parálisis porcentual óptimo para diferentes períodos de tenencia de posiciones.
Se pueden optimizar los parámetros de frenado a través de la retroalimentación, lo que hace que el riesgo-beneficio general sea superior.
Esta estrategia permite la gestión de la parada de manera flexible y precisa mediante la combinación de la parada porcentual y la parada de múltiples marcos de tiempo. La estrategia tiene ventajas como una mejor selección de puntos de parada y una parada más completa. También hay problemas como la configuración de parámetros, la posición de la parada.
/*backtest
start: 2023-10-22 00:00:00
end: 2023-10-29 00:00:00
period: 5m
basePeriod: 1m
exchanges: [{"eid":"Futures_Binance","currency":"BTC_USDT"}]
*/
// This source code is subject to the terms of the Mozilla Public License 2.0 at https://mozilla.org/MPL/2.0/
// © TrendCrypto2022
//@version=5
// strategy("Take profit Multi timeframe", overlay=true, margin_long=100, margin_short=100)
takepercent = input.bool(title="Take profit %", defval=true ,group="Set up take profit")
takemtf = input.bool(title="Take profit Multi timeframe", defval=false ,group="Set up take profit")
//Paste your strategy at here. This is example strategy. I use WaveTrend indicator
//WaveTrend indicator
n1 = input(10, "Channel Length")
n2 = input(21, "Average Length")
oblv1 = input(60, "Over Bought Lv 1")
oblv2 = input(53, "Over Bought Lv 2")
oslv1 = input(-60, "Over Sold Lv 1")
oslv2 = input(-53, "Over Sold Lv 2")
ap = hlc3
esa = ta.ema(ap, n1)
d = ta.ema(math.abs(ap - esa), n1)
ci = (ap - esa) / (0.015 * d)
tci = ta.ema(ci, n2)
wt1 = tci
wt2 = ta.sma(wt1,4)
//Strategy
buy = ta.crossover(wt1, wt2) and wt1 < -40
if (buy)
strategy.entry("Long", strategy.long)
//Resistant in time D and 4H
ema_len1 = input.int(title='Ema1', defval=100, group='Take profit Mtf')
ema_len2 = input.int(title='Ema2', defval=200, group='Take profit Mtf')
src = input.source(title='Source', defval=close, group='Take profit Mtf')
tf1 = input.timeframe(title='Time frame 1', defval='240', group='Take profit Mtf')
tf2 = input.timeframe(title='Time frame 2', defval='D', group='Take profit Mtf')
htf_ma1 = ta.ema(src, ema_len1)
htf_ma2 = ta.ema(src, ema_len2)
ema1 = request.security(syminfo.tickerid, tf1, htf_ma1)
ema2 = request.security(syminfo.tickerid, tf1, htf_ma2)
ema3 = request.security(syminfo.tickerid, tf2, htf_ma1)
ema4 = request.security(syminfo.tickerid, tf2, htf_ma2)
//Plot
plotema1 = plot(ema1, color=color.new(color.silver, 0), style=plot.style_line, linewidth=1, offset=0, title='Ema100 4h', display=display.none)
plotema2 = plot(ema2, color=color.new(color.silver, 0), style=plot.style_line, linewidth=1, offset=0, title='Ema200 4h', display=display.none)
plotema3 = plot(ema3, color=color.new(color.orange, 20), style=plot.style_line, linewidth=1, offset=0, title='Ema100 D', display=display.none)
plotema4 = plot(ema4, color=color.new(color.orange, 20), style=plot.style_line, linewidth=1, offset=0, title='Ema200 D', display=display.none)
//Label take profit multitime frame
var label labelema1 = na
label.delete(labelema1)
labelema1 := label.new(x=time + 120, y=ema1, text='\n*****Ema100 4H: ' + str.tostring(math.round(ema1,4)) + '', color=color.new(#000000, 100), textcolor = color.yellow, size=size.small, style=label.style_label_left, xloc=xloc.bar_time, yloc=yloc.price)
var label labelema2 = na
label.delete(labelema2)
labelema2 := label.new(x=time + 120, y=ema2, text='\n*****Ema200 4H: ' + str.tostring(math.round(ema2,4)) + '', color=color.new(#000000, 100), textcolor = color.yellow, size=size.small, style=label.style_label_left, xloc=xloc.bar_time, yloc=yloc.price)
var label labelema3 = na
label.delete(labelema3)
labelema3 := label.new(x=time + 120, y=ema3, text='\n*****Ema100 1D: ' + str.tostring(math.round(ema3,4)) + '', color=color.new(#000000, 100), textcolor = color.yellow, size=size.small, style=label.style_label_left, xloc=xloc.bar_time, yloc=yloc.price)
var label labelema4 = na
label.delete(labelema4)
labelema4 := label.new(x=time + 120, y=ema4, text='\n*****Ema200 1D: ' + str.tostring(math.round(ema4,4)) + '', color=color.new(#000000, 100), textcolor = color.yellow, size=size.small, style=label.style_label_left, xloc=xloc.bar_time, yloc=yloc.price)
//Set up take profit %
percent(pcnt) =>
strategy.position_size != 0 ? math.round(pcnt / 100 * strategy.position_avg_price / syminfo.mintick) : float(na)
TP1=input.float(3, title="TP1 %", step=0.1, group="Take profit %")
TP2=input.float(5, title="TP2 %", step=1, group="Take profit %")
TP3=input.float(6, title="TP3 %", step=1, group="Take profit %")
TP4=input.float(8, title="TP4 %", step=1, group="Take profit %")
SL=input.float(5, title="Stop Loss %", step=1, group="Take profit %")
qty1=input.float(5, title="% Close At TP1", step=1, group="Take profit %")
qty2=input.float(5, title="% Close At TP2", step=1, group="Take profit %")
qty3=input.float(5, title="% Close At TP3", step=1, group="Take profit %")
qty4=input.float(5, title="% Close At TP4", step=1, group="Take profit %")
lossPnt_L = percent(SL)
//Set up take profit multi timeframe
a = array.from((ema1), (ema2), (ema3), (ema4))
tpmtf1 = array.min(a)
tpmtf2 = array.min(a, 2)
tpmtf3 = array.min(a, 3)
tpmtf4 = array.min(a, 4)
//Set up exit
long_sl_level = strategy.position_avg_price - lossPnt_L*syminfo.mintick
if takepercent == true
strategy.exit("TP1%", "Long", qty_percent = qty1, profit = percent(TP1), loss = lossPnt_L)
strategy.exit("TP2%", "Long", qty_percent = qty2, profit = percent(TP2), loss = lossPnt_L)
strategy.exit("TP3%", "Long", qty_percent = qty3, profit = percent(TP3), loss = lossPnt_L)
strategy.exit("TP4%", "Long", qty_percent = qty4, profit = percent(TP3), loss = lossPnt_L)
strategy.close_all(when= ta.crossunder(wt1, wt2) and wt1 > 0, comment="Close All")
if takemtf == true and array.max(a, 1) > strategy.position_avg_price
strategy.exit("TP1Mtf", "Long", qty_percent = qty1, limit = tpmtf1, stop = long_sl_level)
strategy.exit("TP2Mtf", "Long", qty_percent = qty2, limit = tpmtf2, stop = long_sl_level)
strategy.exit("TP3Mtf", "Long", qty_percent = qty3, limit = tpmtf3, stop = long_sl_level)
strategy.close_all(when= ta.crossunder(wt1, wt2) and wt1 > 0, comment="Close All")
// Plot TP & SL
long_tp1_level = strategy.position_avg_price + percent(TP1)*syminfo.mintick
long_tp2_level = strategy.position_avg_price + percent(TP2)*syminfo.mintick
long_tp3_level = strategy.position_avg_price + percent(TP3)*syminfo.mintick
long_tp4_level = strategy.position_avg_price + percent(TP4)*syminfo.mintick
plot(strategy.position_size > 0 ? long_sl_level : na, color=color.red, style=plot.style_linebr, title="SL Long")
plot(strategy.position_size > 0 ? long_tp1_level : na, color=color.lime, style=plot.style_linebr, title="Long TP1%")
plot(strategy.position_size > 0 ? long_tp2_level : na, color=color.lime, style=plot.style_linebr, title="Long TP2%")
plot(strategy.position_size > 0 ? long_tp3_level : na, color=color.lime, style=plot.style_linebr, title="Long TP3%")
plot(strategy.position_size > 0 ? long_tp4_level : na, color=color.lime, style=plot.style_linebr, title="Long TP4%")
plot(strategy.position_size > 0 ? tpmtf1 : na, color=color.orange, style=plot.style_linebr, title="Long TP1Mtf", display = display.none)
plot(strategy.position_size > 0 ? tpmtf2 : na, color=color.orange, style=plot.style_linebr, title="Long TP2Mtf", display = display.none)
plot(strategy.position_size > 0 ? tpmtf3 : na, color=color.orange, style=plot.style_linebr, title="Long TP3Mtf", display = display.none)
//Label TP
if strategy.position_size > 0
var label labellongtp1 = na
label.delete(labellongtp1)
labellongtp1 := label.new(x=time + 120, y=long_tp1_level, text='\nTP1: ' + str.tostring(math.round(long_tp1_level,2)) + '', color=color.new(#000000, 100), textcolor = color.lime, size=size.small, style=label.style_label_left, xloc=xloc.bar_time, yloc=yloc.price)
var label labellongtp2 = na
label.delete(labellongtp2)
labellongtp2 := label.new(x=time + 120, y=long_tp2_level, text='\nTP2: ' + str.tostring(math.round(long_tp2_level,2)) + '', color=color.new(#000000, 100), textcolor = color.lime, size=size.small, style=label.style_label_left, xloc=xloc.bar_time, yloc=yloc.price)
var label labellongtp3 = na
label.delete(labellongtp3)
labellongtp3 := label.new(x=time + 120, y=long_tp3_level, text='\nTP3: ' + str.tostring(math.round(long_tp3_level,2)) + '', color=color.new(#000000, 100), textcolor = color.lime, size=size.small, style=label.style_label_left, xloc=xloc.bar_time, yloc=yloc.price)
var label labellongtp4 = na
label.delete(labellongtp4)
labellongtp4 := label.new(x=time + 120, y=long_tp4_level, text='\nTP4: ' + str.tostring(math.round(long_tp4_level,2)) + '', color=color.new(#000000, 100), textcolor = color.lime, size=size.small, style=label.style_label_left, xloc=xloc.bar_time, yloc=yloc.price)