Estrategia de seguimiento de tendencias a corto plazo basada en bandas de Bollinger

Descripción general
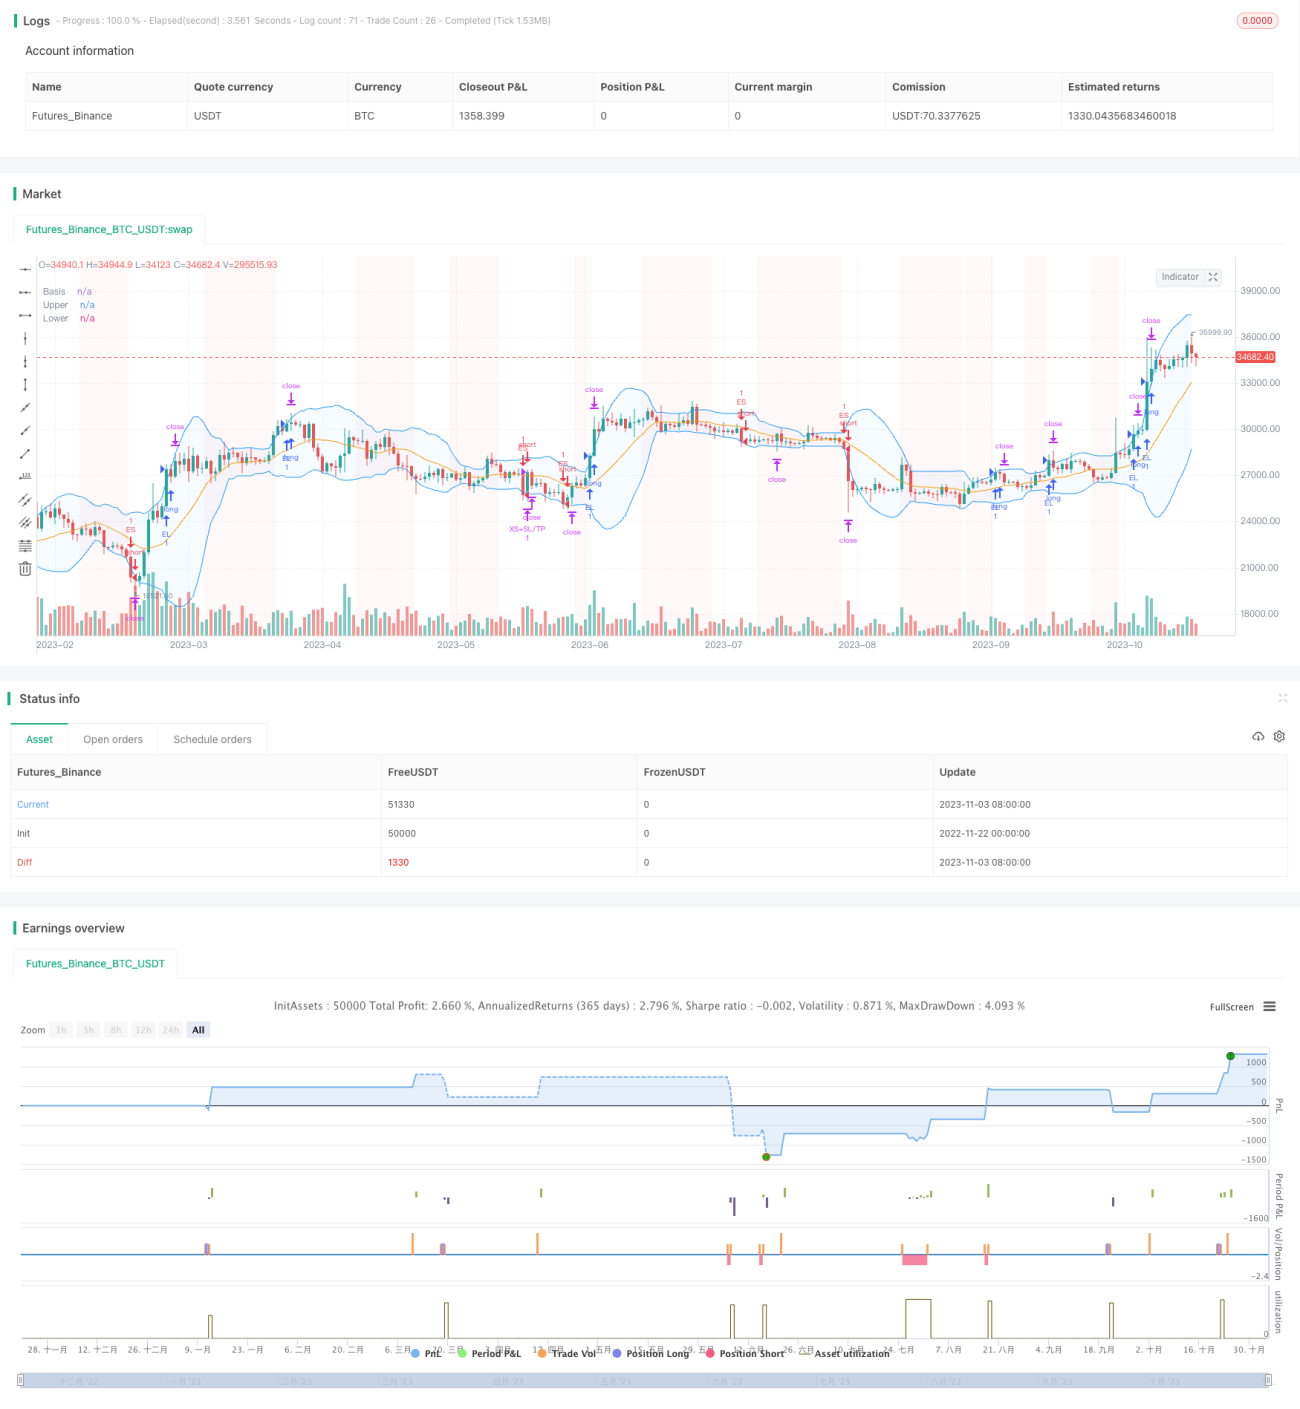
La estrategia de ruptura del cinturón de Brin es una estrategia de seguimiento de tendencias a corto plazo basada en el indicador del cinturón de Brin. Puede ejecutar operaciones en ambos sentidos de la cabeza y la cabeza vacía, y se aplica a contratos en efectivo y permanentes, especialmente en situaciones de tendencia.
La estrategia tiene una alta configurabilidad, permitiendo al usuario configurar los parámetros de la banda de Brin de período y desviación, filtros de tendencia, filtros de volatilidad, filtros de dirección de negociación, filtros de tasa de cambio y filtros de fecha, etc. Además, también configura paradas, paradas y paradas de seguimiento para las posiciones de más y menos cabeza, lo que garantiza un enfoque integral de gestión de riesgos. La adición de la mayor pérdida diaria proporciona otra capa de protección, lo que la convierte en un sistema de negociación adaptado y profesional de confianza.
Principio de estrategia
El indicador central de la estrategia es el Brin Belt. El Brin Belt está formado por tres líneas de trayectoria media, trayectoria superior y trayectoria inferior, que representan la línea media del precio, el límite superior de la fluctuación y el límite inferior de la fluctuación.
Además, la estrategia tiene varios filtros auxiliares para evitar el comercio de ruido. Estos filtros incluyen:
-
El filtro de tendencia: los precios están excedidos por encima de la media móvil, los precios están excedidos por debajo de la media móvil;
-
Filtro de volatilidad: solo se puede operar cuando la volatilidad aumenta.
-
Filtrador de dirección de negociación: solo hacer más, solo hacer menos o negociar en ambos sentidos según las propiedades de la marca;
-
Filtro de tasa de cambio: el precio entra cuando la tasa de cambio en relación con el precio de cierre del día de negociación anterior alcanza un cierto nivel;
-
El filtro de fecha: configuración del intervalo de tiempo para la retrospección.
Se emite una señal de negociación cuando se cumplen todas las condiciones de filtración. El stop, el stop loss y el stop loss de seguimiento aseguran la gestión del riesgo. Además, la configuración de pérdidas máximas en un día evita una retirada masiva en un día.
Análisis de las ventajas
La estrategia tiene las siguientes ventajas:
-
El uso de este indicador bien desarrollado como una señal de negociación central es de alta fiabilidad.
-
El diseño de los filtros múltiples evita errores de transacción y es altamente configurable.
-
La prevención, el control y el seguimiento de la prevención son integrales y flexibles.
-
La configuración de pérdidas máximas en un día es un control efectivo de la retirada en un día.
-
Es un mercado de tendencia con mucho potencial de ganancias.
Análisis de riesgos
La estrategia también tiene ciertos riesgos:
-
Las rupturas del cinturón de Brin son propensas a la formación de falsas rupturas en la cabeza y en la parte inferior, lo que puede causar daños.
-
En el mercado de liquidación, los filtros pueden ser demasiado estrictos y perder oportunidades de negociación.
-
Los grandes saltos aéreos pueden causar daños directos por encima de la línea de parada.
-
En casos extremos, las pérdidas masivas no pueden evitarse por completo.
En respuesta a los riesgos mencionados anteriormente, se pueden relajar las condiciones de filtración adecuadamente, o la intervención manual para cerrar algunas posiciones, reducir la distancia de parada de pérdidas, etc.
Dirección de optimización
La estrategia puede considerarse para optimizar en los siguientes aspectos:
-
Prueba diferentes combinaciones de parámetros para encontrar el mejor intervalo de parámetros.
-
El objetivo de este proyecto es mejorar la calidad de vida de las personas y mejorar la calidad de vida de los animales.
-
Investigar métodos más eficaces para detener el daño, como el deterioro en el tiempo, el deterioro en la amplitud, etc.
-
En la actualidad, la mayoría de los países de la región están en vías de desarrollo, y la mayor parte de los países están en vías de desarrollo.
-
Arbitraje estadístico en combinación con productos relacionados.
Resumir
La estrategia de ruptura de la banda de Brin es una estrategia de seguimiento de tendencias de línea corta y fiable. Utiliza el indicador de la banda de Brin como señal y establece múltiples filtros para garantizar la fiabilidad de la señal. Al mismo tiempo, un mecanismo de control de pérdidas y riesgos completo controla el riesgo. La estrategia es adecuada para mercados de tendencias activas y tiene un buen potencial de ganancias.
- 1