Estrategia de cambio rápido de RSI de Noro v1.7
Descripción general
La estrategia de cambio rápido RSI de Noro es una estrategia de comercio cuantitativa que utiliza el indicador RSI para identificar oportunidades de sobreventa y sobreventa. La estrategia combina al mismo tiempo la forma de la línea K, el filtro uniforme y el método de stop loss para controlar el riesgo.
La estrategia se basa en los siguientes componentes clave:
- Indicador RSI rápido: utilizado para identificar oportunidades de sobrecompra y sobreventa
- Forma de la línea K: combinación de la entidad de la línea K y la línea yin y yang, para ayudar a juzgar la tendencia
- Filtración de línea media: utiliza la línea media SMA para filtrar y evitar señales falsas
- Mecanismo de detención de pérdidas: Combinación de las zonas de límite RSI para lograr la detención de pérdidas
Principio de estrategia
La estrategia de Noro para cambiar rápidamente el RSI se basa en las siguientes señales de compra y venta:
RSI Rápido sobrecompra sobreventa: genera una señal de transacción cuando RSI Rápido sobrepasa su límite superior o cuando RSI Rápido sobrepasa su límite inferior
Señales de forma de línea K: combina el tamaño de la entidad de la línea K, la dirección de la línea del sol, etc., para determinar la tendencia y ayudar a generar señales de RSI rápidas.
Filtración de la línea media: combina la dirección de la línea media SMA para evitar falsas rupturas.
Señales de stop loss: cuando el RSI rápido vuelve a cruzar su límite superior o inferior, se detiene la posición en línea.
Concretamente, la estrategia se basa en el RSI rápido para determinar la oportunidad de negociar. Cuando el RSI rápido cruza su límite inferior, se considera una señal de venta por encima de la oferta; cuando el RSI rápido cruza su límite superior, se considera una señal de venta por encima de la oferta.
Para evitar el ruido, la estrategia incluye los siguientes juicios auxiliares:
- Tamaño de la entidad de la línea K: cuanto más grande es la entidad de la línea K, más evidente es la tendencia
- La línea del sol y el sol: determinar la dirección de la línea K
- La línea media SMA: filtración de señales falsas de ruptura
- Detenerse: detenerse cuando el RSI rápido retrocede a la zona restringida
Por lo tanto, la estrategia combina el RSI rápido, la forma de la línea K, la línea media y el stop para tomar decisiones comerciales.
Ventajas estratégicas
La estrategia tiene las siguientes ventajas:
- El RSI rápido tiene una alta sensibilidad: puede capturar rápidamente las oportunidades de sobrecompra y sobreventa
- Juzgos auxiliares de línea K y de línea media: evitar el ruido de las transacciones
- Autodeterminación: puede detener el daño a tiempo y controlar el riesgo
- Apto para operaciones en línea corta: Apto para períodos de línea corta como 1 hora, 30 minutos, etc.
- Fácil de optimizar: los parámetros se pueden ajustar para adaptarse a diferentes mercados
Riesgo estratégico
La estrategia también tiene ciertos riesgos:
- Puede haber pérdidas continuas: en situaciones de temblor, se producen más señales de pérdidas
- Los parámetros necesitan ser optimizados: para diferentes ciclos y variedades, los parámetros necesitan ser ajustados
- No es posible evitar las pérdidas por completo: el cierre oportuno también puede conllevar pérdidas.
Para reducir el riesgo, se puede optimizar en los siguientes aspectos:
- Optimización de los parámetros RSI rápidos para reducir el ruido de las operaciones
- Optimización de las posiciones de pérdidas y control de pérdidas individuales
- Aumentar el módulo de gestión de fondos y diversificar el riesgo
Dirección de optimización de la estrategia
La estrategia puede ser optimizada en los siguientes aspectos:
- Estrategia de stop-loss incremental: stop-loss que bloquea una parte de las ganancias una vez que las ganancias alcanzan un determinado nivel
- Aumentar la gestión de fondos: añadir medidas de gestión como el control de posiciones y la dispersión de riesgos
- Optimización de los parámetros de diferentes períodos: ajuste los parámetros del indicador para probar el efecto de los diferentes períodos
- Aumentar el aprendizaje automático: utilizar algoritmos para optimizar automáticamente los parámetros y adaptarse a los cambios en el mercado
- Pruebas en diferentes variedades: estrategias para probar la robustez en más variedades
La mejora de la estrategia a través de la prevención, la gestión de riesgos, la optimización de parámetros y el aprendizaje automático puede mejorar significativamente la estabilidad de la estrategia.
Resumir
En general, la estrategia de cambio rápido RSI de Noro combina el indicador RSI rápido con el indicador técnico de la línea K auxiliar para lograr una estrategia de negociación en línea corta para juzgar sobre la sobrecompra y la sobreventa. La estrategia responde de manera ágil y fácil de optimizar, al tiempo que incorpora un módulo de stop loss para controlar el riesgo.
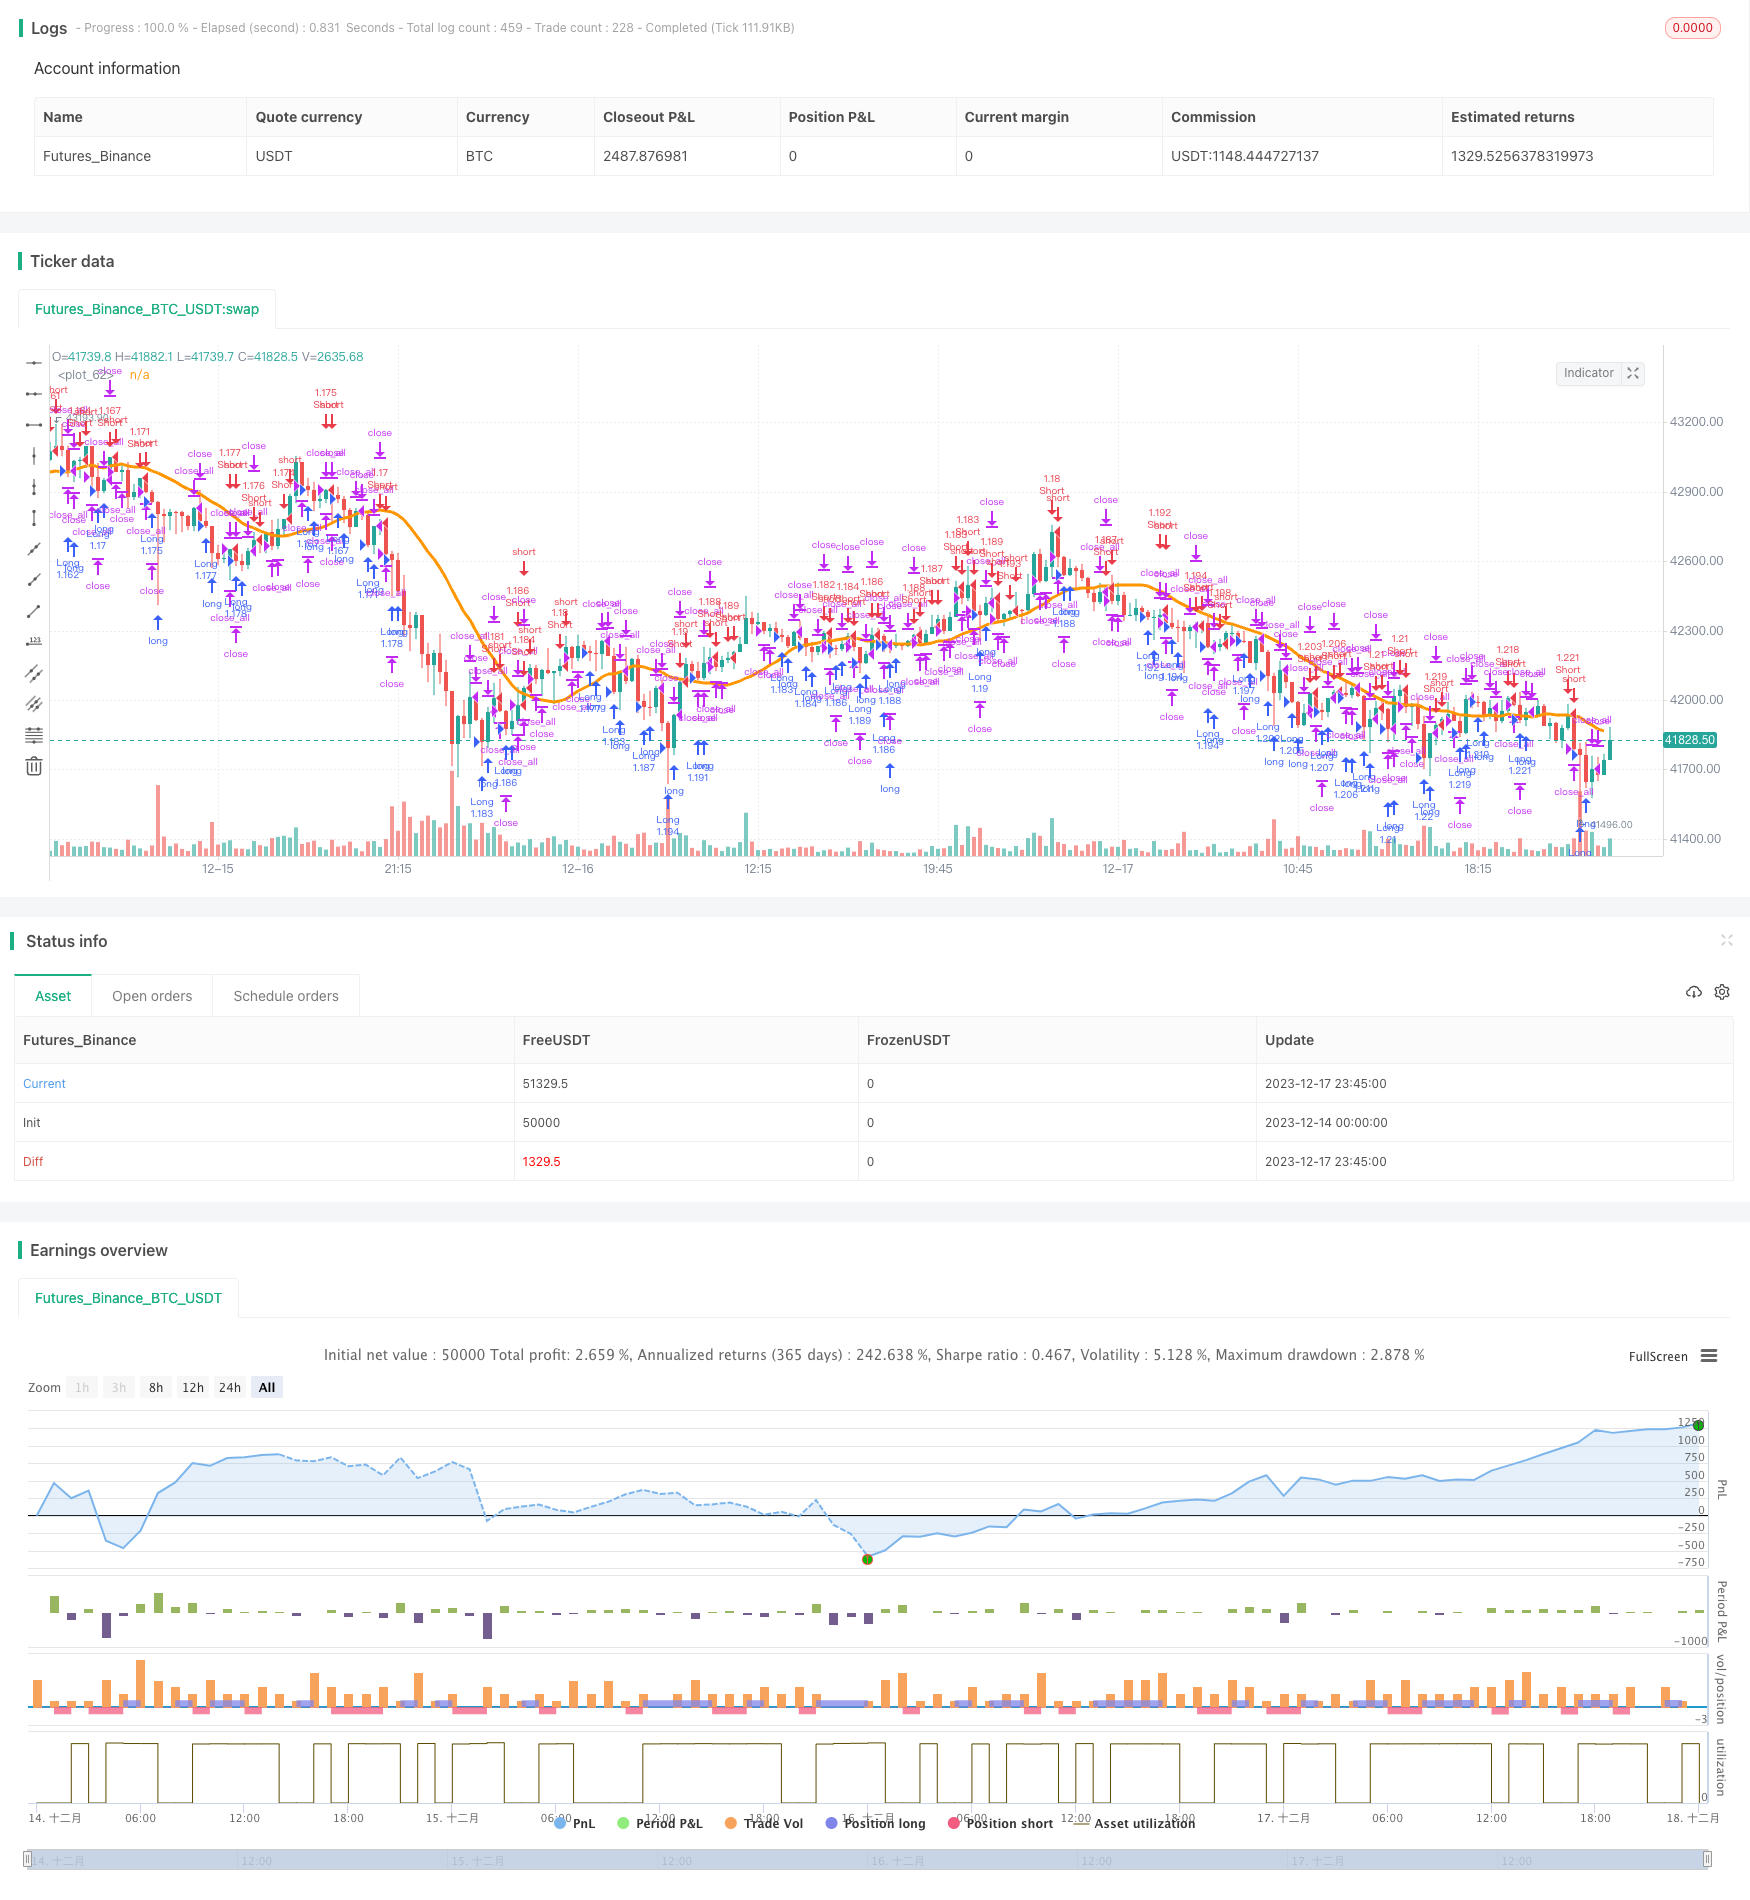
/*backtest
start: 2023-12-14 00:00:00
end: 2023-12-18 00:00:00
period: 15m
basePeriod: 5m
exchanges: [{"eid":"Futures_Binance","currency":"BTC_USDT"}]
*/

//Noro
//2018

//@version=2
strategy(title = "Noro's Fast RSI Strategy v1.7", shorttitle = "Fast RSI str 1.7", overlay = true)

//Settings
needlong = input(true, defval = true, title = "Long")
needshort = input(true, defval = true, title = "Short")
usemar = input(false, defval = false, title = "Use Martingale")
capital = input(100, defval = 100, minval = 1, maxval = 10000, title = "Capital, %")
usersi = input(true, defval = true, title = "Use Fast RSI Strategy")
usemm = input(true, defval = true, title = "Use Min/Max Strategy")
usebc = input(true, defval = true, title = "Use BarColor Strategy")
usesma = input(false, defval = false, title = "Use SMA Filter")
smaperiod = input(20, defval = 20, minval = 2, maxval = 1000, title = "SMA Filter Period")
fast = input(7, defval = 7, minval = 2, maxval = 50, title = "Fast RSI Period")
limit = input(30, defval = 30, minval = 1, maxval = 100, title = "RSI limit")
rsisrc = input(close, defval = close, title = "RSI Price")
rsibars = input(1, defval = 1, minval = 1, maxval = 20, title = "RSI Bars")
mmbars = input(1, defval = 1, minval = 1, maxval = 5, title = "Min/Max Bars")
showsma = input(false, defval = false, title = "Show SMA Filter")
showarr = input(false, defval = false, title = "Show Arrows")
fromyear = input(2018, defval = 2018, minval = 1900, maxval = 2100, title = "From Year")
toyear = input(2100, defval = 2100, minval = 1900, maxval = 2100, title = "To Year")
frommonth = input(01, defval = 01, minval = 01, maxval = 12, title = "From Month")
tomonth = input(12, defval = 12, minval = 01, maxval = 12, title = "To Month")
fromday = input(01, defval = 01, minval = 01, maxval = 31, title = "From day")
today = input(31, defval = 31, minval = 01, maxval = 31, title = "To day")

//Fast RSI
fastup = rma(max(change(rsisrc), 0), fast)
fastdown = rma(-min(change(rsisrc), 0), fast)
fastrsi = fastdown == 0 ? 100 : fastup == 0 ? 0 : 100 - (100 / (1 + fastup / fastdown))

//Limits
bar = close > open ? 1 : close < open ? -1 : 0
uplimit = 100 - limit
dnlimit = limit

//RSI Bars
upsignal = fastrsi > uplimit ? 1 : 0
dnsignal = fastrsi < dnlimit ? 1 : 0
uprsi = sma(upsignal, rsibars) == 1
dnrsi = sma(dnsignal, rsibars) == 1

//Body
body = abs(close - open)
abody = sma(body, 10)

//MinMax Bars
min = min(close, open)
max = max(close, open)
minsignal = min < min[1] and bar == -1 and bar[1] == -1 ? 1 : 0
maxsignal = max > max[1] and bar == 1 and bar[1] == 1 ? 1 : 0
mins = sma(minsignal, mmbars) == 1
maxs = sma(maxsignal, mmbars) == 1

//SMA Filter
sma = sma(close, smaperiod)
colorsma = showsma ? blue : na
plot(sma, color = colorsma, linewidth = 3)

//Signals
up1 = bar == -1 and (strategy.position_size == 0 or close < strategy.position_avg_price) and dnrsi and body > abody / 5 and usersi
dn1 = bar == 1 and (strategy.position_size == 0 or close > strategy.position_avg_price) and uprsi and body > abody / 5 and usersi
up2 = mins and (close > sma or usesma == false) and fastrsi < 70 and usemm
dn2 = maxs and (close < sma or usesma == false) and fastrsi > 30 and usemm
up3 = sma(bar, 2) == -1 and usebc
dn3 = sma(bar, 2) == 1 and usebc
exit = (((strategy.position_size > 0 and fastrsi > dnlimit and bar == 1) or (strategy.position_size < 0 and fastrsi < uplimit and bar == -1)) and body > abody / 2)

//Arrows
col = exit ? black : up1 or dn1 ? blue : up2 or dn2 ? red : na
needup = up1 or up2
needdn = dn1 or dn2
needexitup = exit and strategy.position_size < 0
needexitdn = exit and strategy.position_size > 0
plotarrow(showarr and needup ? 1 : na, colorup = blue, colordown = blue, transp = 0)
plotarrow(showarr and needdn ? -1 : na, colorup = blue, colordown = blue, transp = 0)
plotarrow(showarr and needexitup ? 1 : na, colorup = black, colordown = black, transp = 0)
plotarrow(showarr and needexitdn ? -1 : na, colorup = black, colordown = black, transp = 0)

//Trading
profit = exit ? ((strategy.position_size > 0 and close > strategy.position_avg_price) or (strategy.position_size < 0 and close < strategy.position_avg_price)) ? 1 : -1 : profit[1]
mult = usemar ? exit ? profit == -1 ? mult[1] * 2 : 1 : mult[1] : 1
lot = strategy.position_size == 0 ? strategy.equity / close * capital / 100 * mult : lot[1]

if up1 or up2 or up3
    if strategy.position_size < 0
        strategy.close_all()

    strategy.entry("Long", strategy.long, needlong == false ? 0 : lot)

if dn1 or dn2 or dn3
    if strategy.position_size > 0
        strategy.close_all()

    strategy.entry("Short", strategy.short, needshort == false ? 0 : lot)

if time > timestamp(toyear, tomonth, today, 23, 59) or exit
    strategy.close_all()