Estrategia de swing trading con soporte y resistencia
Fecha de creación:
2024-01-25 15:53:06
Última modificación:
2024-01-25 15:53:06
Copiar:
2
Número de Visitas:
603
1
Seguir
1750
Seguidores
Descripción general
Esta estrategia permite un control preciso de la lógica de negociación y un stop loss preciso mediante la combinación de estrategias de cruce de RSI y indicadores aleatorios, junto con estrategias de optimización de puntos de deslizamiento de posición plana. Al mismo tiempo, mediante la introducción de la optimización de señales, se puede controlar mejor la tendencia y lograr una gestión racional de los fondos.
Principio de estrategia
- El indicador RSI determina las zonas de sobreventa y sobrecompra, junto con los valores K y D de los indicadores aleatorios, que forman una señal de negociación.
- Introducción de la clasificación de la línea K para ayudar a juzgar las señales de tendencia y evitar transacciones erróneas.
- La línea media SMA ayuda a determinar la dirección de la tendencia. Cuando la línea media a corto plazo supera la línea media a largo plazo de abajo hacia arriba, es una señal de tendencia alcista.
- La estrategia de punto de deslizamiento de posición plana, que establece un precio de parada de pérdida de acuerdo con el rango de fluctuación del precio más alto y más bajo.
Análisis de las ventajas
- Parámetros optimizados del RSI para determinar mejor las zonas de sobreventa y sobrecompra y evitar errores en las operaciones
- Optimización de los parámetros de los indicadores STO, regulación de los parámetros de la suavidad, eliminación de ruido y mejora de la calidad de la señal
- Introducción del análisis técnico Heikin-Ashi para identificar cambios en la dirección de las entidades de la línea K y garantizar la precisión de las señales de transacción
- La línea media SMA ayuda a determinar la dirección de la tendencia general y evita el comercio en contra
- Combinado con una estrategia de punto de deslizamiento de stop-loss, se puede maximizar el bloqueo de ganancias por transacción
Análisis de riesgos
- Los fondos corren un mayor riesgo cuando las grandes bolsas siguen bajando
- La frecuencia de las transacciones puede ser demasiado alta, lo que aumenta los costos de transacción y los costos de deslizamiento
- Los indicadores RSI son propensos a falsas señales y deben filtrarse junto con otros indicadores
Optimización de la estrategia
- Ajuste de los parámetros del RSI para optimizar el juicio de sobreventa
- Ajuste los parámetros del indicador STO, la suavidad y el ciclo para mejorar la calidad de la señal
- Ajustar el ciclo de las medias móviles para optimizar el juicio de tendencias
- Introducir más indicadores técnicos para mejorar la precisión de la señal
- Optimización de las tasas de stop loss y reducción del riesgo de una sola operación
Resumir
La estrategia integra las ventajas de varios indicadores tecnológicos principales y logra un equilibrio entre la calidad de la señal de negociación y el stop loss a través de la optimización de los parámetros y la perfección de las reglas. Tiene cierta universalidad y estabilidad de la rentabilidad.
Código Fuente de la Estrategia
/*backtest
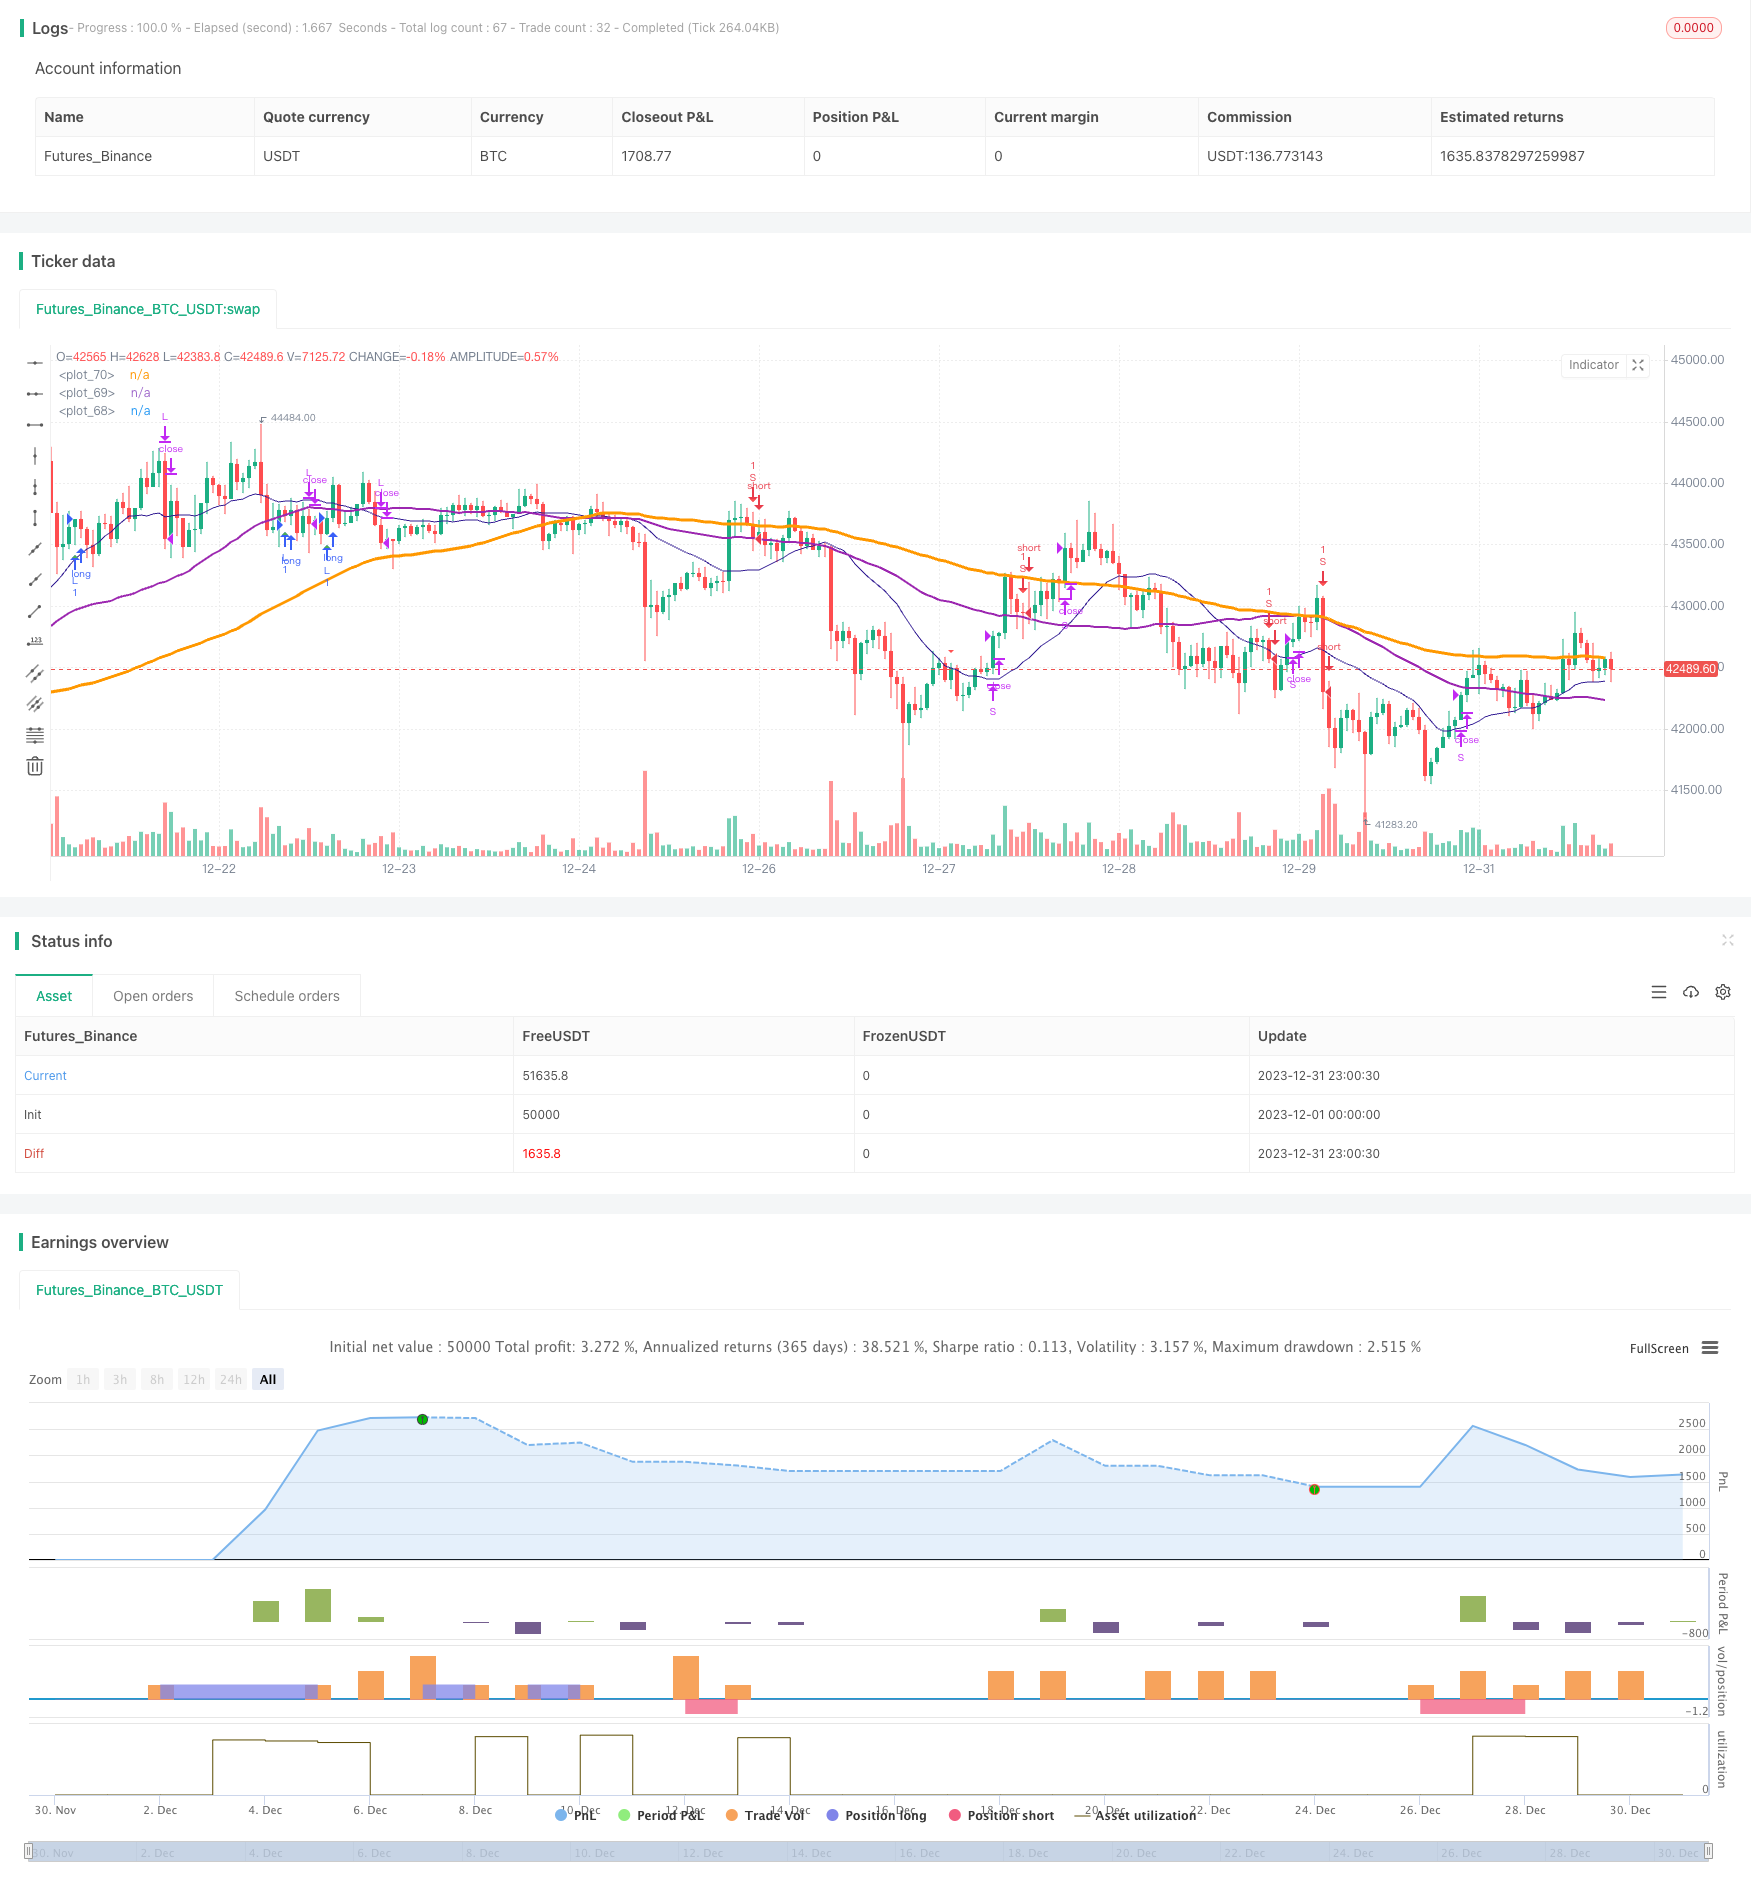
start: 2023-12-01 00:00:00
end: 2023-12-31 23:59:59
period: 1h
basePeriod: 15m
exchanges: [{"eid":"Futures_Binance","currency":"BTC_USDT"}]
*/
//@version=4
//study(title="@sentenzal strategy", shorttitle="@sentenzal strategy", overlay=true)
strategy(title="@sentenzal strategy", shorttitle="@sentenzal strategy", overlay=true )
smoothK = input(3, minval=1)
smoothD = input(3, minval=1)
lengthRSI = input(14, minval=1)
lengthStoch = input(14, minval=1)
overbought = input(80, minval=1)
oversold = input(20, minval=1)
smaLengh = input(100, minval=1)
smaLengh2 = input(50, minval=1)
smaLengh3 = input(20, minval=1)
src = input(close, title="RSI Source")
testStartYear = input(2017, "Backtest Start Year")
testStartMonth = input(1, "Backtest Start Month")
testStartDay = input(1, "Backtest Start Day")
testPeriodStart = timestamp(testStartYear,testStartMonth,testStartDay,0,0)
testPeriod() =>
time >= testPeriodStart ? true : false
rsi1 = rsi(src, lengthRSI)
k = sma(stoch(rsi1, rsi1, rsi1, lengthStoch), smoothK)
d = sma(k, smoothD)
crossBuy = crossover(k, d) and k < oversold
crossSell = crossunder(k, d) and k > overbought
dcLower = lowest(low, 10)
dcUpper = highest(high, 10)
heikinashi_close = security(heikinashi(syminfo.tickerid), timeframe.period, close)
heikinashi_open = security(heikinashi(syminfo.tickerid), timeframe.period, open)
heikinashi_low = security(heikinashi(syminfo.tickerid), timeframe.period, low)
heikinashi_high = security(heikinashi(syminfo.tickerid), timeframe.period, high)
heikinashiPositive = heikinashi_close >= heikinashi_open
heikinashiBuy = heikinashiPositive == true and heikinashiPositive[1] == false and heikinashiPositive[2] == false
heikinashiSell = heikinashiPositive == false and heikinashiPositive[1] == true and heikinashiPositive[2] == true
//plotshape(heikinashiBuy, style=shape.arrowup, color=green, location=location.belowbar, size=size.tiny)
//plotshape(heikinashiSell, style=shape.arrowdown, color=red, location=location.abovebar, size=size.tiny)
buy = (crossBuy == true or crossBuy[1] == true or crossBuy[2] == true) and (heikinashiBuy == true or heikinashiBuy[1] == true or heikinashiBuy[2] == true)
sell = (crossSell == true or crossSell[1] == true or crossSell[2] == true) and (heikinashiSell == true or heikinashiSell[1] == true or heikinashiSell[2] == true)
mult = timeframe.period == '15' ? 4 : 1
mult2 = timeframe.period == '240' ? 0.25 : mult
movingAverage = sma(close, round(smaLengh))
movingAverage2 = sma(close, round(smaLengh2))
movingAverage3 = sma(close, round(smaLengh3))
uptrend = movingAverage < movingAverage2 and movingAverage2 < movingAverage3 and close > movingAverage
downtrend = movingAverage > movingAverage2 and movingAverage2 > movingAverage3 and close < movingAverage
signalBuy = (buy[1] == false and buy[2] == false and buy == true) and uptrend
signalSell = (sell[1] == false and sell[2] == false and sell == true) and downtrend
takeProfitSell = (buy[1] == false and buy[2] == false and buy == true) and uptrend == false
takeProfitBuy = (sell[1] == false and sell[2] == false and sell == true) and uptrend
plotshape(signalBuy, style=shape.triangleup, color=green, location=location.belowbar, size=size.tiny)
plotshape(signalSell, style=shape.triangledown, color=red, location=location.abovebar, size=size.tiny)
plot(movingAverage, linewidth=3, color=orange, transp=0)
plot(movingAverage2, linewidth=2, color=purple, transp=0)
plot(movingAverage3, linewidth=1, color=navy, transp=0)
alertcondition(signalBuy, title='Signal Buy', message='Signal Buy')
alertcondition(signalSell, title='Signal Sell', message='Signal Sell')
strategy.close("L", when=dcLower[1] > low)
strategy.close("S", when=dcUpper[1] < high)
strategy.entry("L", strategy.long, 1, when = signalBuy and testPeriod() and uptrend)
strategy.entry("S", strategy.short, 1, when = signalSell and testPeriod() and uptrend ==false)
//strategy.exit("Exit Long", from_entry = "L", loss = 25000000, profit=25000000)
//strategy.exit("Exit Short", from_entry = "S", loss = 25000000, profit=25000000)