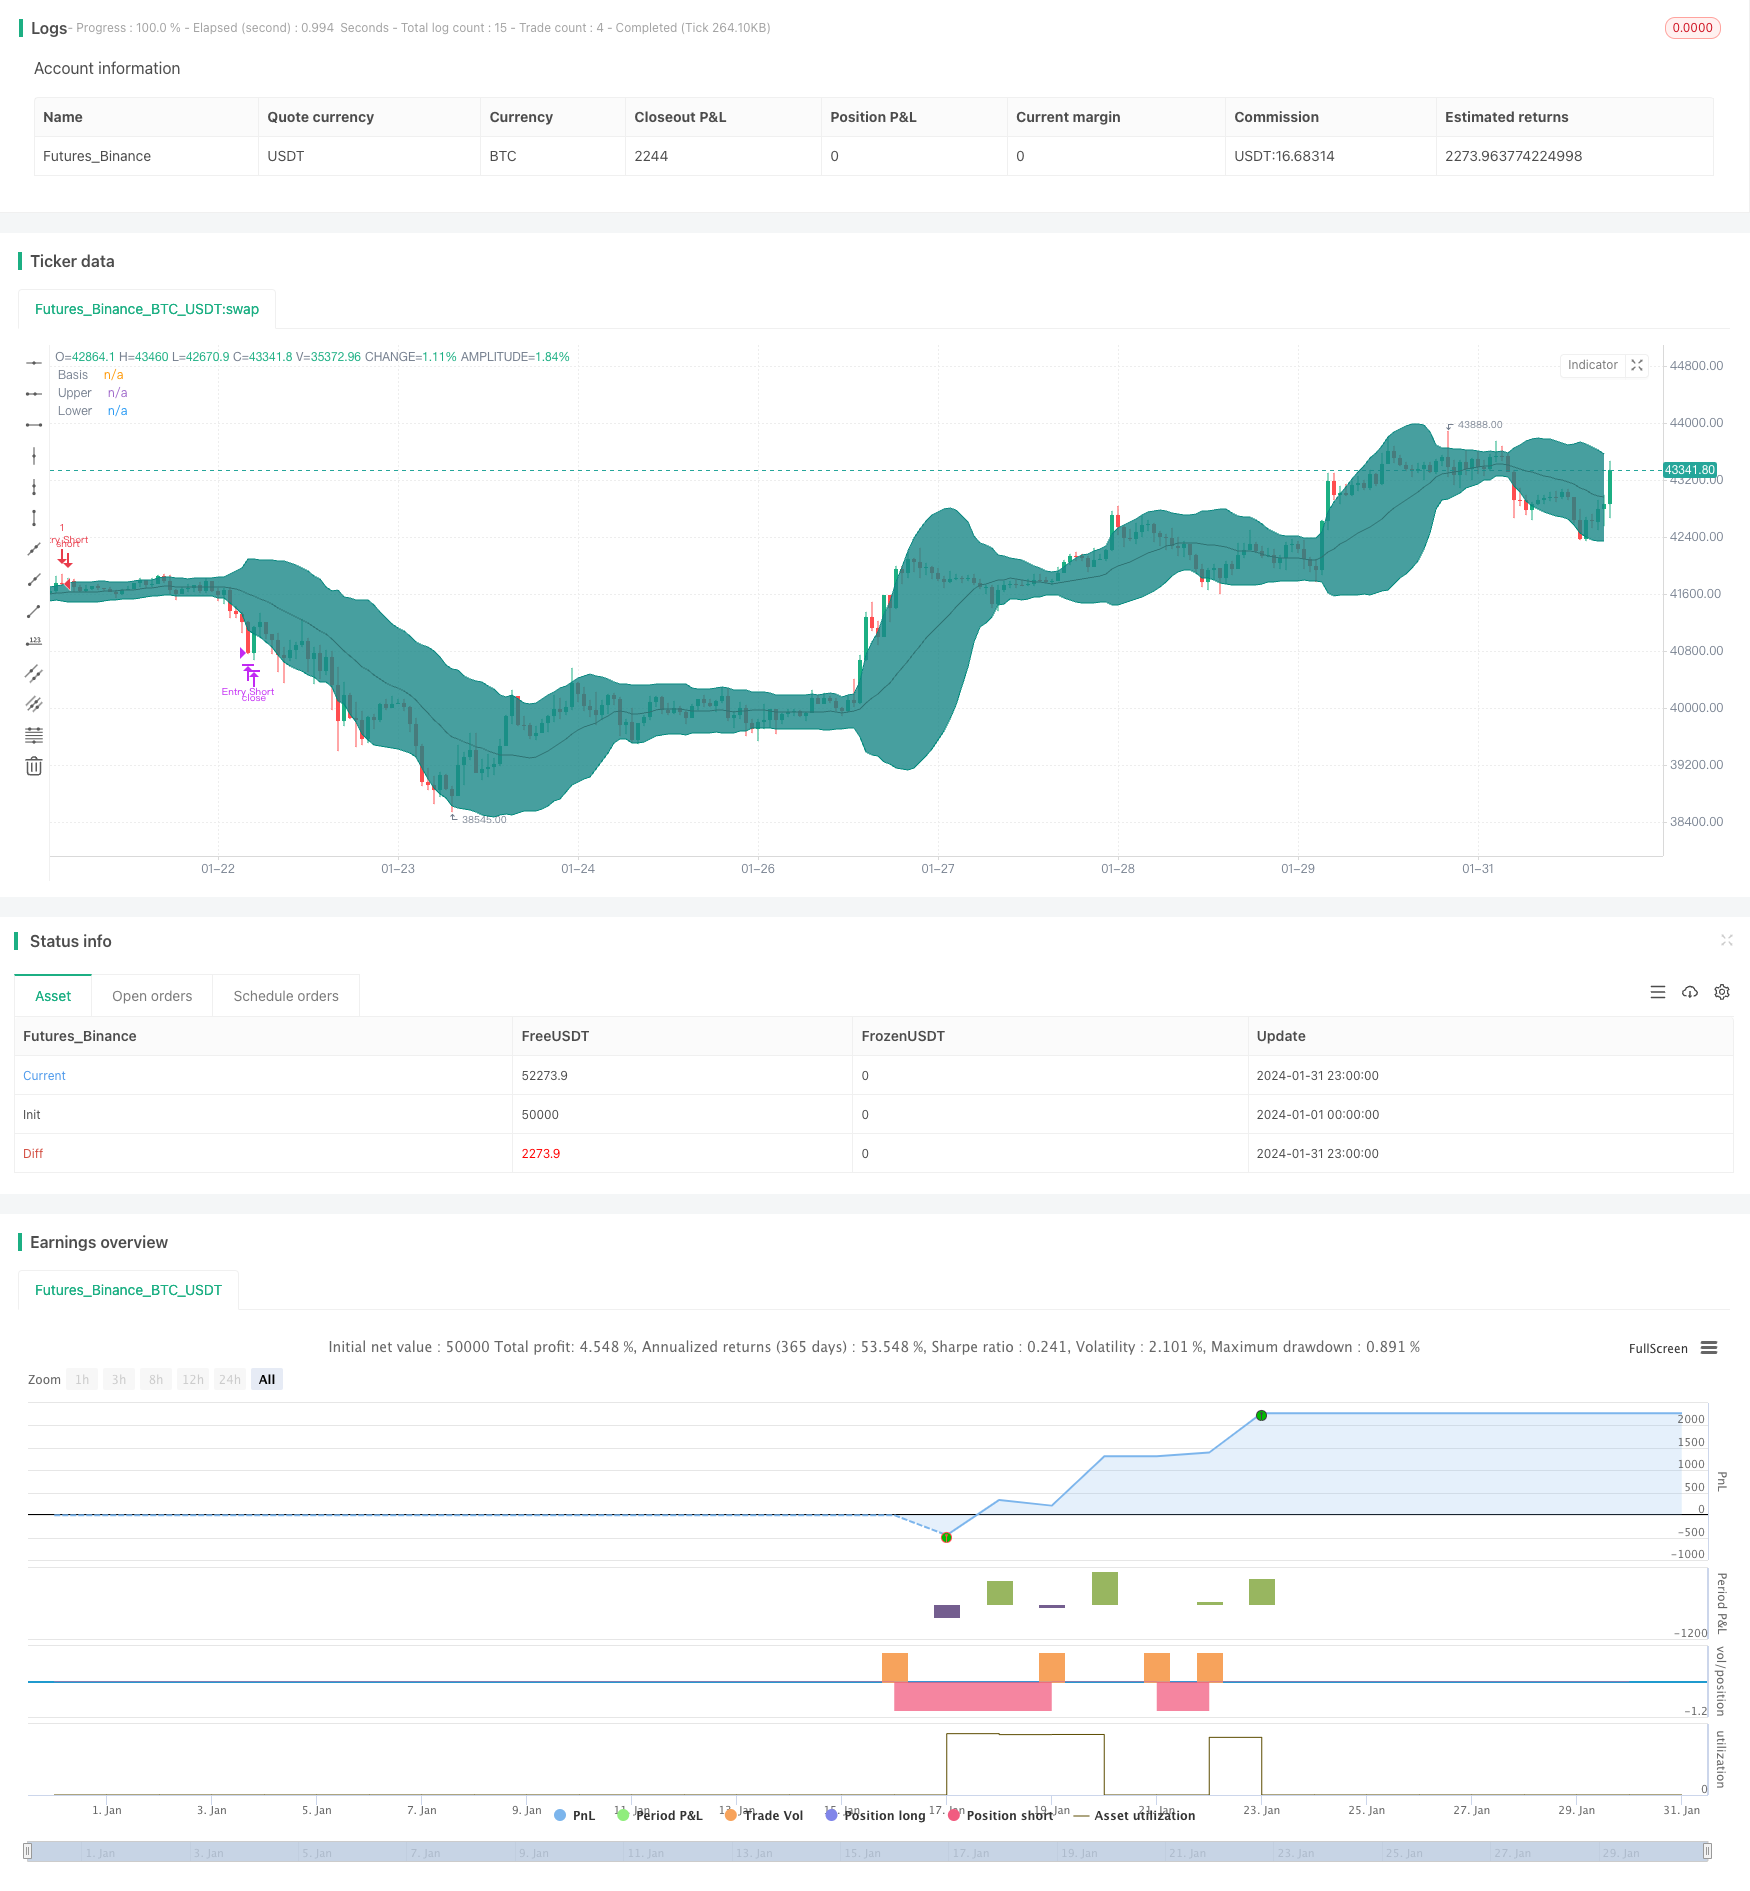
Estrategia de trading de reversión con bandas de Bolban + RSI + ADX + ATR
Descripción general
Esta estrategia combina varios indicadores técnicos, en combinación con los indicadores RSI, ADX y ATR para determinar la estructura del mercado y buscar oportunidades de reversión de alta probabilidad cuando el indicador de la banda de Bolban emite una señal de reversión de precios.
Principio de estrategia
Utilizando bandas de boro de 20 ciclos, espera una señal de compra o venta que forma una línea K inversa cuando el precio llega a la cima o la baja.
El indicador RSI determina si el mercado se encuentra en la zona de oscilación. El RSI es superior a 60 para el rango optimista, y inferior a 40 para el rango negativo.
El ADX bajo 20 indica que el mercado está en crisis, y el ADX por encima de 20 indica que el mercado está en tendencia.
La configuración de ATR para detener y rastrear la pérdida.
Combinado con una señal de filtración uniforme de la EMA.
Análisis de las ventajas estratégicas
La combinación de varios indicadores genera una señal de comercio de alta probabilidad.
Los parámetros se pueden configurar para adaptarse a diferentes entornos de mercado.
Las reglas de suspensión de pérdidas son estrictas y los riesgos son controlados.
Análisis de riesgos estratégicos
La configuración inadecuada de los parámetros puede conducir a operaciones demasiado frecuentes.
La probabilidad de fracaso de la reversión aún existe.
El rastreo de pérdidas puede no funcionar en ciertos mercados.
Dirección de optimización de la estrategia
Prueba más combinaciones de indicadores para encontrar la configuración de parámetros más adecuada.
Identificar oportunamente las oportunidades de reversión después de un fracaso en la brecha.
Prueba diferentes formas de detener el daño para que sea más inteligente.
Resumir
La estrategia utiliza las bandas de Bol como señal de negociación básica, y al mismo tiempo, varios indicadores auxiliares forman un sistema de filtración de alta probabilidad. La regla de stop loss también es más completa.
/*backtest
start: 2024-01-01 00:00:00
end: 2024-01-31 23:59:59
period: 1h
basePeriod: 15m
exchanges: [{"eid":"Futures_Binance","currency":"BTC_USDT"}]
*/

//@version=4
strategy(shorttitle="BB + EMA + RSI + ADX + ATR Reversal", title="Bollinger Bands Reversal", overlay=true)

// Inputs
ema1Input       = input(title = "EMA1 Input",                          defval = 200,   minval = 10,    maxval = 400,   step = 10,                      group = "Indicators")
ema2Input       = input(title = "EMA2 Input",                          defval = 100,   minval = 10,    maxval = 400,   step = 10,                      group = "Indicators")
length          = input(title = "BB Length",                           defval = 20,    minval=1,                                                       group = "Bollinger Band Indicator")
bbsrc           = input(title = "BB Source",                            defval = close,                                                                 group = "Bollinger Band Indicator")
mult            = input(title = "BB Standard Deviation",            type = input.float,     defval = 2.0,   minval=0.001,   maxval=50,                                      group = "Bollinger Band Indicator")
offset          = input(title = "BB Offset",                           defval = 0,     minval = -500,  maxval = 500,                                   group = "Bollinger Band Indicator")
rsilen          = input(title = "RSI Length",                          defval = 14,    minval=1,                                                       group = "RSI Indicator")
rsisrc          = input(title = "RSI Source",                           defval = close,                                                                 group = "RSI Indicator")
rsiMaxEntry     = input(title = "RSI Maximum Value",                   defval = 60,    minval = 50,    maxval = 100,                                   group = "RSI Indicator")
rsiMinEntry     = input(title = "RSI Minimum Value",                   defval = 40,    minval = 0,     maxval = 50,                                    group = "RSI Indicator")
rsiMaxExit      = input(title = "RSI Max Exit Value",                  defval = 70,    minval = 50,    maxval = 100,                                   group = "RSI Indicator")
rsiMinExit      = input(title = "RSI Min Exit Value",                  defval = 30,    minval = 0,     maxval = 50,                                    group = "RSI Indicator")
atrLength       = input(title = "ATR Length",                          defval = 14,    minval = 1,                                                     group = "ATR Indicator")
useStructure    = input(title = "Use Trailing Stop?",               type = input.bool,      defval = true,                                                                  group = "ATR Indicator")
atrlookback     = input(title = "ATR Lookback Period",                 defval = 7,     minval = 1,                                                     group = "ATR Indicator")
atrMultiplier   = input(title = "ATR Multiplier",                   type = input.float,     defval = 1.0,   minval = 0.1,                                                   group = "ATR Indicator")
sigMaxValue     = input(title = "ADX Max Value",                    type = input.float,     defval = 20.0,  minval = 0,     maxval = 100,   step = 0.1,                     group = "ADX Indicator")
adxlen          = input(title = "ADX Smoothing",                       defval = 14,                                                                    group = "ADX Indicator")
dilen           = input(title = "DI Length",                           defval = 14,                                                                    group = "ADX Indicator")

// Date input
fromMonth       = input(defval = 1,    title = "From Month",           minval = 1,     maxval = 12,    group = "Backtest Date Range")
fromDay         = input(defval = 1,    title = "From Day",             minval = 1,     maxval = 31,    group = "Backtest Date Range")
fromYear        = input(defval = 2000, title = "From Year",            minval = 1970,                  group = "Backtest Date Range")
thruMonth       = input(defval = 1,    title = "Thru Month",           minval = 1,     maxval = 12,    group = "Backtest Date Range")
thruDay         = input(defval = 1,    title = "Thru Day",             minval = 1,     maxval = 31,    group = "Backtest Date Range")
thruYear        = input(defval = 2099, title = "Thru Year",            minval = 1970,                  group = "Backtest Date Range")
inDataRange     = true

// Built in Bollinger Band
basis           = sma(bbsrc, length)
dev             = mult * stdev(bbsrc, length)
upper           = basis + dev
lower           = basis - dev
// Built in RSI
up              = rma(max(change(rsisrc), 0), rsilen)
down            = rma(-min(change(rsisrc), 0), rsilen)
rsi             = down == 0 ? 100 : up == 0 ? 0 : 100 - (100 / (1 + up / down))
// Built in ADX
dirmov(len) =>
	up = change(high)
	down = -change(low)
	plusDM = na(up) ? na : (up > down and up > 0 ? up : 0)
	minusDM = na(down) ? na : (down > up and down > 0 ? down : 0)
	truerange = rma(tr, len)
	plus = fixnan(100 * rma(plusDM, len) / truerange)
	minus = fixnan(100 * rma(minusDM, len) / truerange)
	[plus, minus]
adx(dilen, adxlen) =>
	[plus, minus] = dirmov(dilen)
	sum = plus + minus
	adx = 100 * rma(abs(plus - minus) / (sum == 0 ? 1 : sum), adxlen)
sig = adx(dilen, adxlen)

// Custom variables
ema1 = ema(close, ema1Input)
ema2 = ema(close, ema2Input)
atr = atr(atrLength)

// Entry and exit signals
CrossLongEntry  = (close <= lower or close[1] <= lower[1]) and close > open and close[1] < open[1] and close > ema1 and close > ema2 and strategy.position_size == 0 and inDataRange and rsi > rsiMinEntry and rsi < rsiMaxEntry and sig < sigMaxValue
CrossShortEntry = (close >= upper or close[1] >= upper[1]) and close < open and close[1] > open[1] and close < ema1 and close < ema2 and strategy.position_size == 0 and inDataRange and rsi > rsiMinEntry and rsi < rsiMaxEntry and sig < sigMaxValue

CrossLongExit   = (close >= upper or close[1] >= upper[1]) and close < open and close[1] > open[1] and strategy.position_size > 0 and inDataRange or rsi < rsiMinExit or rsi > rsiMaxExit
CrossShortExit  = (close <= lower or close[1] <= lower[1]) and close > open and close[1] < open[1] and strategy.position_size < 0 and inDataRange or rsi < rsiMinExit or rsi > rsiMaxExit

// Determining the stop loss based on ATR
StopLossLong    = (useStructure ? lowest(low, atrlookback) : close) - atr * atrMultiplier
StopLossShort   = (useStructure ? highest(high, atrlookback) : close) + atr * atrMultiplier

// Custom variables used to store the stoploss value
var StopLong    = 0.0
var StopShort   = 0.0
// Telling my script to store the stoploss value in the corresponding variables
if CrossLongEntry
    StopLong := StopLossLong
if CrossShortEntry
    StopShort := StopLossShort

// Strategy
strategy.entry("Entry Long", strategy.long, when = CrossLongEntry, comment = "Entry Long")
strategy.close("Entry Long", when = CrossLongExit or close < StopLong, comment = "Long Exit")

strategy.entry("Entry Short", strategy.short, when = CrossShortEntry, comment = "Entry Short")
strategy.close("Entry Short", when = CrossShortExit or close > StopShort, comment = "Short Exit")

// Plots the Bollinger Band
plot(basis, "Basis", color=#872323, offset = offset)
p1 = plot(upper, "Upper", color=color.teal, offset = offset)
p2 = plot(lower, "Lower", color=color.teal, offset = offset)
fill(p1, p2, title = "Background", color=#198787, transp=95)

// Use this if you want to see the stoploss visualised, be aware though plotting these can be confusing
// plot(StopLong)
// plot(StopShort)