Estrategia de trading de BabyShark basada en los indicadores VWAP y OBV RSI
Descripción general de la estrategia
La estrategia de negociación BabyShark VWAP es una estrategia de negociación cuantitativa basada en el precio promedio ponderado por volumen de transacción (VWAP) y el índice de tendencia de la tendencia de la energía (OBV RSI). La estrategia tiene como objetivo identificar señales de compra y venta potenciales según el grado de desviación de los precios de VWAP y la ruptura de un umbral específico por el OBV RSI.
Principio de estrategia
El principio central de esta estrategia es el uso de dos indicadores, el VWAP y el OBV RSI, para capturar las tendencias y los cambios en la dinámica del mercado. El VWAP es una media dinámica basada en el precio y el volumen de transacciones, que puede reflejar las principales áreas de negociación del mercado.
En concreto, la estrategia utiliza 60 líneas K como ciclo de cálculo de VWAP y toma el precio de cierre como datos de entrada. Luego se construyen zonas de sobreventa y sobreventa en función de la diferencia de precio de 3 puntos positivos negativos de la diferencia estándar de VWAP. Para el OBV RSI, se utiliza 5 líneas K como ciclo de cálculo y se establecen dos valores de 70 y 30 como criterio de sobreventa y sobreventa.
En cuanto a la lógica de la negociación, la estrategia emite una señal de más cuando el precio está en la zona de venta por encima de la línea de baja VWAP y el OBV RSI es menor que 30; y una señal de falta cuando el precio está en la zona de venta por encima de la línea de baja VWAP y el OBV RSI es mayor que 70. Además, la estrategia también establece una proporción de stop loss del 0.6%, e introduce un período de reposo de la línea de 10 K después de pérdidas continuas para controlar el riesgo.
Ventajas estratégicas
- La combinación de varios factores del mercado, como el precio y el volumen de transacciones, capta las tendencias y el dinamismo del mercado en su totalidad.
- Utiliza indicadores dinámicos de VWAP y OBV RSI para adaptarse a los cambios de los diferentes ciclos del mercado.
- Establezca un rango razonable de stop loss y un período de inactividad para controlar el riesgo de manera efectiva mientras aprovecha las oportunidades.
- La lógica es clara, fácil de entender y llevar a cabo, y tiene cierta interpretabilidad.
- Los parámetros son ajustables y se pueden optimizar y mejorar para los comerciantes de diferentes estilos.
Riesgo estratégico
- En el caso de mercados convulsivos o de tendencias recurrentes, las frecuentes señales de negociación pueden conducir a un exceso de negociación y a un aumento de los costos de los puntos de deslizamiento.
- En una situación de tendencia, depender únicamente de VWAP para hacer un stop puede causar una salida prematura de la estrategia y perder la ganancia de la tendencia posterior.
- La configuración de parámetros fijos puede no adaptarse a los cambios en el entorno del mercado y requiere optimización para diferentes variedades y ciclos.
- El indicador OBV es muy dependiente del volumen de transacciones y puede ser engañoso cuando los datos de la transacción no son reales o están manipulados.
- La falta de consideración de factores externos como la macroeconomía, la prensa y otros factores puede hacer que la estrategia no funcione frente a situaciones extremas.
Dirección de optimización
- Introducción de más filtros para mercados convulsivos, como indicadores de confirmación de tendencias, indicadores de volatilidad, etc., para reducir la frecuencia de las operaciones.
- Optimización de las condiciones de salida, como el uso de paradas móviles o en combinación con otros indicadores de seguimiento de tendencias, para una mejor comprensión de la situación de la tendencia.
- Optimización adaptativa de los parámetros de VWAP y OBV RSI, ajuste dinámico del ciclo de cálculo y la configuración del umbral.
- Introducción de un mecanismo de verificación de la autenticidad de la transacción para mejorar la fiabilidad de los indicadores OBV RSI.
- Considerar la inclusión de análisis de datos macroeconómicos, indicadores de sentimiento, etc., para mejorar la adaptabilidad y la solidez de las estrategias.
Resumir
La estrategia de negociación de BabyShark VWAP es una estrategia de negociación cuantitativa que combina un índice de precios promedio ponderados por volumen de transacción y un índice de tendencia de energía relativamente fuerte para generar señales de negociación mediante la captura de la situación de sobreventa y el cambio de la dinámica de la tendencia en el mercado. La lógica de la estrategia es clara, combina varios elementos del mercado, como el precio y el volumen de transacción, para poder comprender el pulso del mercado en su totalidad. Al mismo tiempo, la configuración razonable de stop loss y el mecanismo de control de riesgo permiten que la estrategia considere la gestión de riesgos al mismo tiempo que busca ganancias.
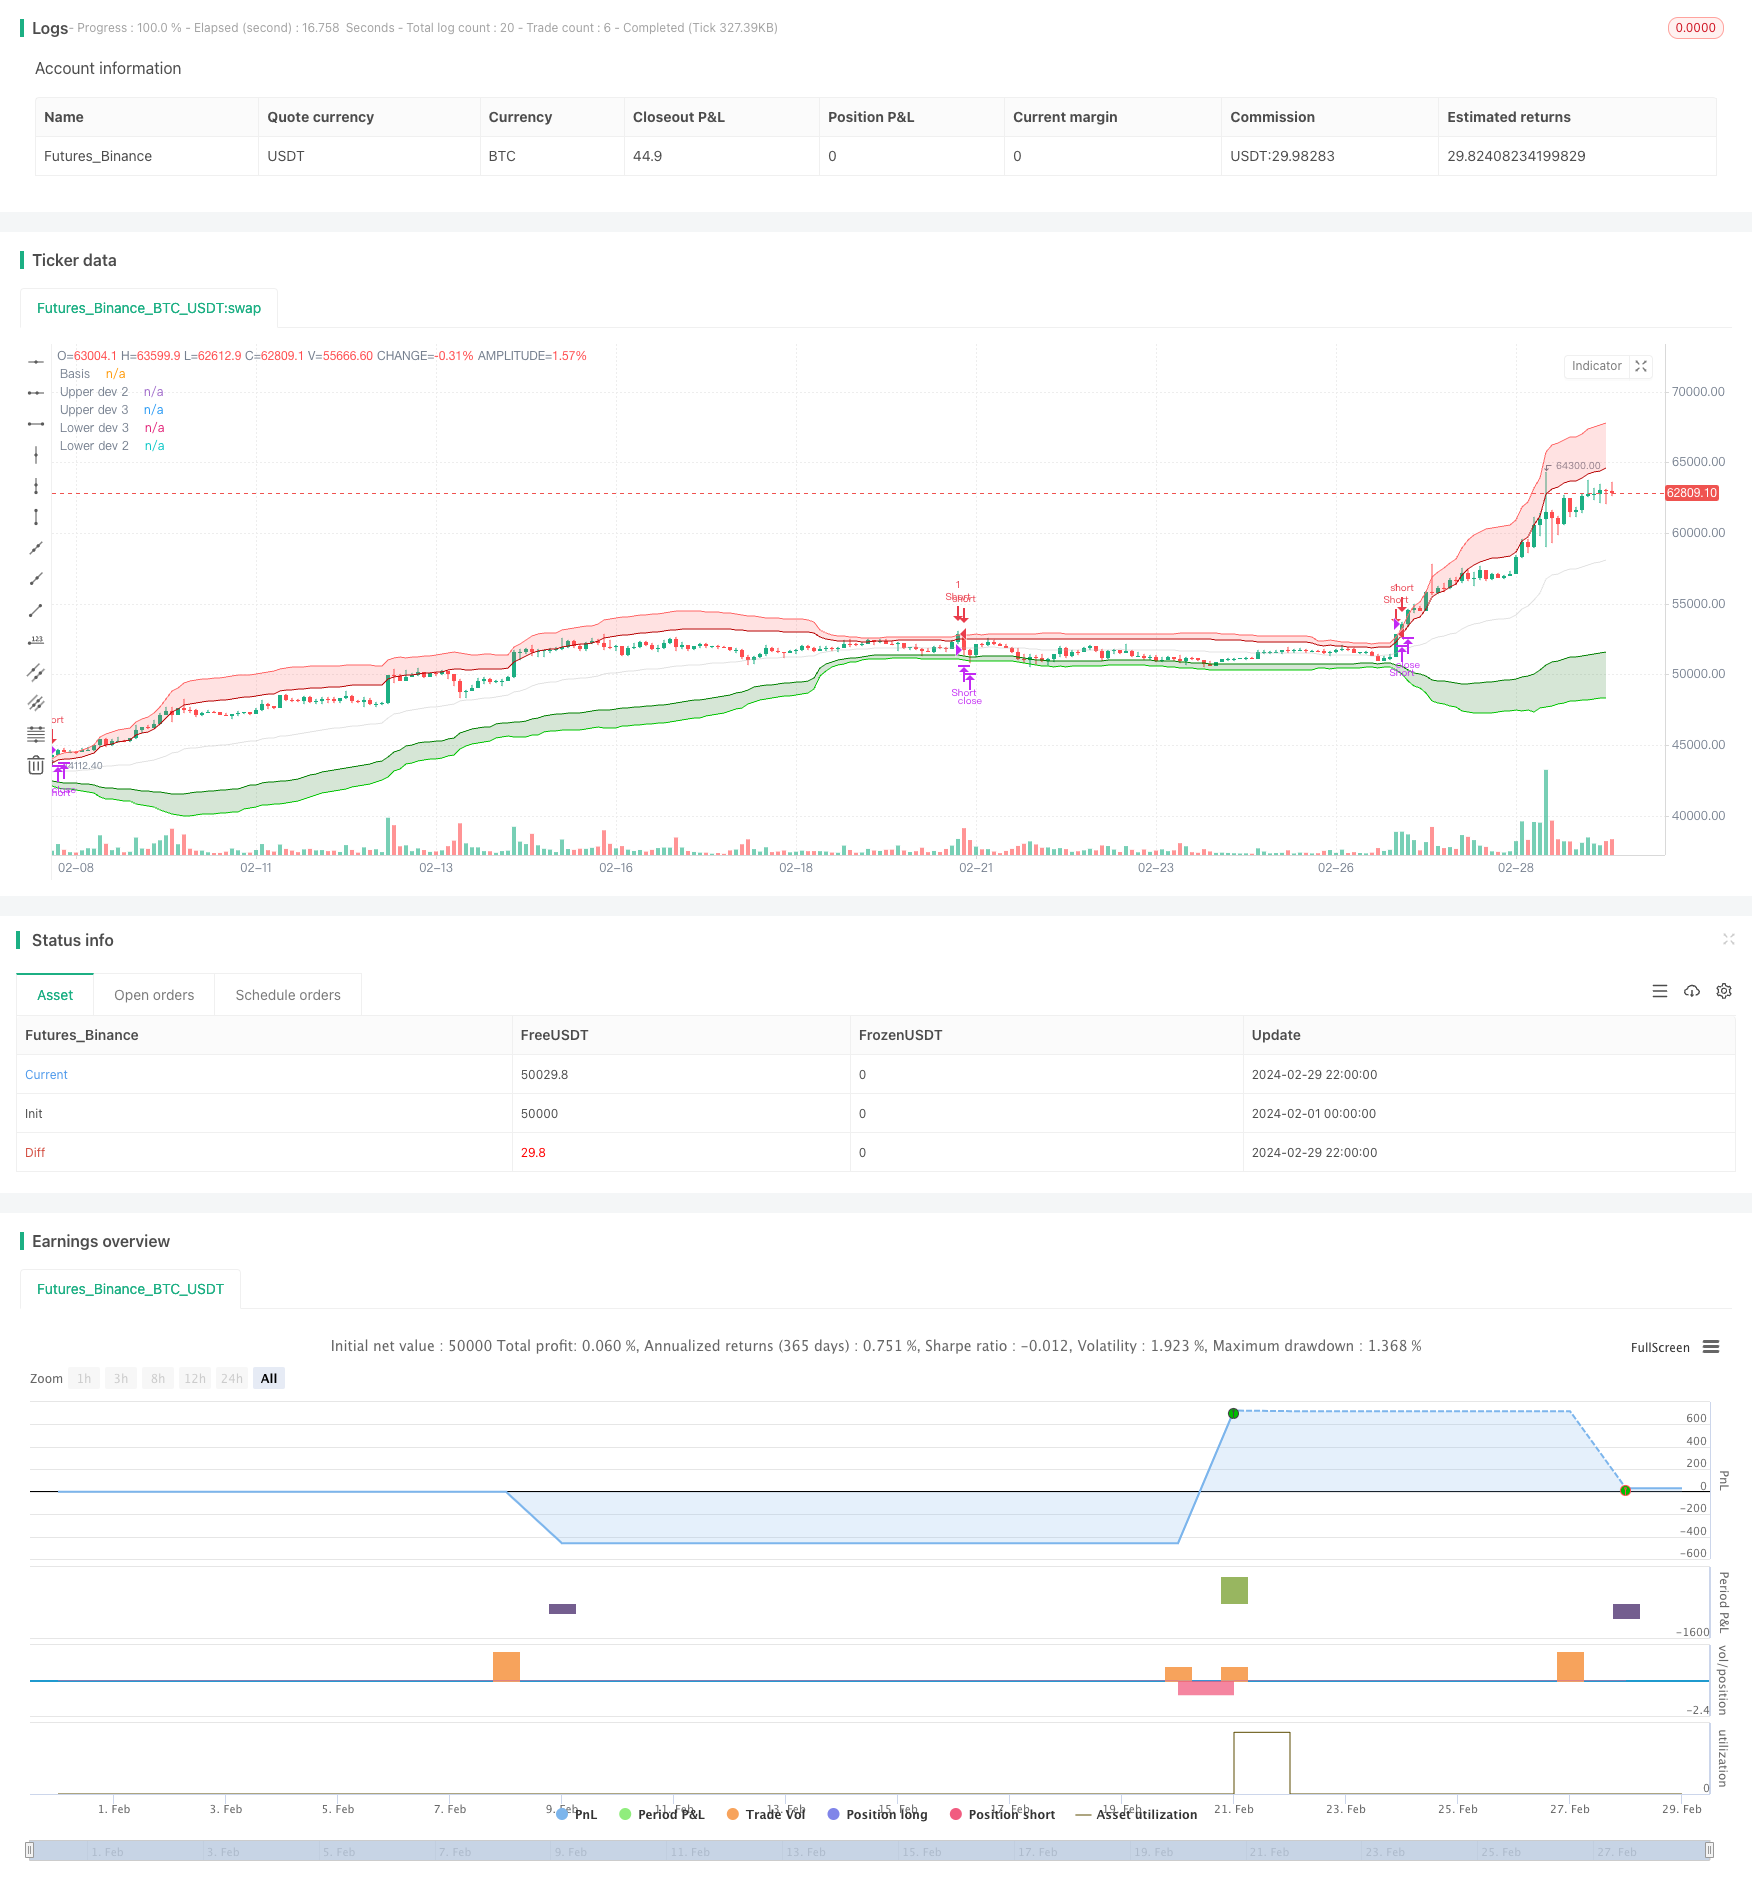
/*backtest
start: 2024-02-01 00:00:00
end: 2024-02-29 23:59:59
period: 2h
basePeriod: 15m
exchanges: [{"eid":"Futures_Binance","currency":"BTC_USDT"}]
*/

// This Pine Script™ code is subject to the terms of the Mozilla Public License 2.0 at https://mozilla.org/MPL/2.0/
// © GreatestUsername

//@version=5
strategy("BabyShark VWAP Strategy", overlay=true, margin_long=100, margin_short=100, calc_on_every_tick = true)


// VWAP
ls = input(false, title='Log-space', group = "Optional")
type = 'Average Deviation'
length = input(60, group="Strategy Modification")
source = input(close, group="Strategy Modification")
_low = ls == true ? math.log(low) : low
_high = ls == true ? math.log(high) : high
src = ls == true ? math.log(source) : source

//weighted mean
pine_vwmean(x, y) =>
    cw = 0.0
    cd = 0.0
    w_sum = 0.0
    d_sum = 0.0
    for i = 0 to y - 1 by 1
        cd := x[i]
        cw := volume[i]
        d_sum += cw * cd
        w_sum += cw
        w_sum
    d_sum / w_sum

//weighted standard deviation
pine_vwstdev(x, y, b) =>
    d_sum = 0.0
    w_sum = 0.0
    cd = 0.0
    for i = 0 to y - 1 by 1
        cd := x[i]
        cw = volume[i]
        d_sum += cw * math.pow(cd - b, 2)
        w_sum += cw
        w_sum
    math.sqrt(d_sum / w_sum)

//weighted average deviation
pine_vwavdev(x, y, b) =>
    d_sum = 0.0
    w_sum = 0.0
    cd = 0.0
    for i = 0 to y - 1 by 1
        cd := x[i]
        cw = volume[i]
        d_sum += cw * math.abs(cd - b)
        w_sum += cw
        w_sum
    d_sum / w_sum

vwmean = pine_vwmean(src, length)

//consider using Average Deviation instead of Standard Deviatio if there are values outside of 3rd upper & lower bands within a rolling window
dev = if type == 'Standard Deviation'
    dev = pine_vwstdev(src, length, vwmean)
    dev
else if type == 'Average Deviation'
    dev = pine_vwavdev(src, length, vwmean)
    dev

basis = ls == true ? math.exp(vwmean) : vwmean
plot(basis, color=color.new(#b7b7b7, 60), title='Basis')

upper_dev_2 = vwmean + dev * 2
upper_dev_3 = vwmean + dev * 3

lower_dev_2 = vwmean - dev * 2
lower_dev_3 = vwmean - dev * 3

fill(
     plot1=plot(ls == true ? math.exp(upper_dev_2) : upper_dev_2, color=color.new(#B20000, 0), title='Upper dev 2'),
     plot2=plot(ls == true ? math.exp(upper_dev_3) : upper_dev_3, color=color.new(#FF6666, 0), title='Upper dev 3', display=display.none),
     color=color.new(#FF4D4D, 80), title='Upper band'
     )
fill(
     plot1=plot(ls == true ? math.exp(lower_dev_3) : lower_dev_3, color=color.new(#00CC00, 0), title='Lower dev 3', display=display.none),
     plot2=plot(ls == true ? math.exp(lower_dev_2) : lower_dev_2, color=color.new(#008000, 0), title='Lower dev 2'),
     color=color.new(#006600, 80), title='Lower band'
     )


// Input to enable or disable the table visibility
table_visible = input(false, title="Show Table", group="Deviation Cross Monitor")
// Input for the number of candles to look back
table_length = input(300, title="Table Lookback Length", group="Deviation Cross Monitor")

// Custom count function
count_occurrences(cond, length) =>
    count = 0
    for i = 0 to length - 1
        if cond[i]
            count := count + 1
    count

// Count occurrences of prices above Upper dev 2 and below Lower dev 2

above_upper_dev_2 = count_occurrences(close > upper_dev_2, table_length)
below_lower_dev_2 = count_occurrences(close < lower_dev_2, table_length)

// Create table in the bottom right corner
var table tbl = table.new(position=position.bottom_right, rows=2, columns=2)

if table_visible
    if barstate.islast
        // Update the table headers
        table.cell(tbl, 0, 0, "Above Upper Dev 2", bgcolor=color.gray, text_color=color.white)
        table.cell(tbl, 0, 1, "Below Lower Dev 2", bgcolor=color.gray, text_color=color.white)

        // Update the table values
        table.cell(tbl, 1, 0, str.tostring(above_upper_dev_2), bgcolor=color.new(color.green, 90), text_color=color.green)
        table.cell(tbl, 1, 1, str.tostring(below_lower_dev_2), bgcolor=color.new(color.red, 90), text_color=color.red)
else
    table.delete(tbl)

// RSI
obvsrc = close
change_1 = ta.change(obvsrc)
obv = ta.cum(ta.change(obvsrc) > 0 ? volume : change_1 < 0 ? -volume : 0 * volume)

src2 = obv
len = input.int(5, minval=1, title="RSI Length", group="Strategy Modification")
up = ta.rma(math.max(ta.change(src2), 0), len)
down = ta.rma(-math.min(ta.change(src2), 0), len)
rsi = down == 0 ? 100 : up == 0 ? 0 : 100 - 100 / (1 + up / down)
higherlvl = input(70, title="Higher Level", group="Strategy Modification")
lowerlvl = input(30, title="Lower Level", group="Strategy Modification")


plot_color = rsi >= higherlvl ? color.red : rsi <= lowerlvl ? color.green : color.new(#b7b7b7, 60)
// plot(rsi, color=plot_color)

//plot(rsi, color=color.white)


// Count occurrences of RSI crossing higher level and lower level
cross_above_higher = ta.crossover(rsi, higherlvl)
cross_below_lower = ta.crossunder(rsi, lowerlvl)
above_higher_count = count_occurrences(cross_above_higher, table_length)
below_lower_count = count_occurrences(cross_below_lower, table_length)

// Create table in the bottom right corner
if (table_visible)
    var table tbl2 = table.new(position=position.bottom_right, rows=2, columns=2)
    if (barstate.islast)
        // Update the table headers
        table.cell(tbl2, 0, 0, "Higher Level Cross", bgcolor=color.gray, text_color=color.white)
        table.cell(tbl2, 0, 1, "Lower Level Cross", bgcolor=color.gray, text_color=color.white)

        // Update the table values
        table.cell(tbl2, 1, 0, str.tostring(above_higher_count), bgcolor=color.new(color.red, 90), text_color=color.red)
        table.cell(tbl2, 1, 1, str.tostring(below_lower_count), bgcolor=color.new(color.green, 90), text_color=color.green)


// Entries

// Long Entry:
// Price is in the shaded GREEN area of [Hoss] VWAP Deviation
// and the [Hoss] OBV RSI is GREEN.
longCondition1 = close <= lower_dev_3
longConditions = plot_color == color.green and longCondition1 and strategy.position_size == 0

// Short Entry:
// Price is in the shaded RED area of [Hoss] VWAP Deviation
// and the [Hoss] OBV RSI is RED.
shortCondition1 = close >= upper_dev_3
shortConditions = plot_color == color.red and shortCondition1 and strategy.position_size == 0

var int lastEntryBar = 0


shortEMA = ta.ema(close, 12)
longEMA = ta.ema(close, 21)
uptrend = shortEMA > longEMA

if longConditions and lastEntryBar < bar_index - 10 //and uptrend
    strategy.entry("Long", strategy.long, stop=close * 0.994)
    lastEntryBar := bar_index

if shortConditions and lastEntryBar < bar_index - 10 //and not uptrend
    strategy.entry("Short", strategy.short, stop=close * 1.006)
    lastEntryBar := bar_index


if strategy.position_size > 0 and (ta.crossover(close, basis) or strategy.opentrades.entry_price(strategy.opentrades - 1) * 0.994 > close)
    strategy.close("Long", immediately = true)
if strategy.position_size < 0 and (ta.crossunder(close, basis) or strategy.opentrades.entry_price(strategy.opentrades - 1) * 1.006 < close)
    strategy.close("Short", immediately = true)

// Stop Loss:
// 0.6%
// After 1 Loss => NO more Trades for 10 Candles (10 minutes) (usually a breakout will happen, and it takes average 10min till it ranges again. So basically wait for range to form again)

// Take Profit:
// Grey line on [Hoss] VWAP Deviation or 0.6%