MacD Indicateur personnalisé - Cadre de temps multiples + Toutes les options disponibles!
Auteur:ChaoZhang est là., Date: le 06 mai 2022 à 20h46Les étiquettes:Le MACD
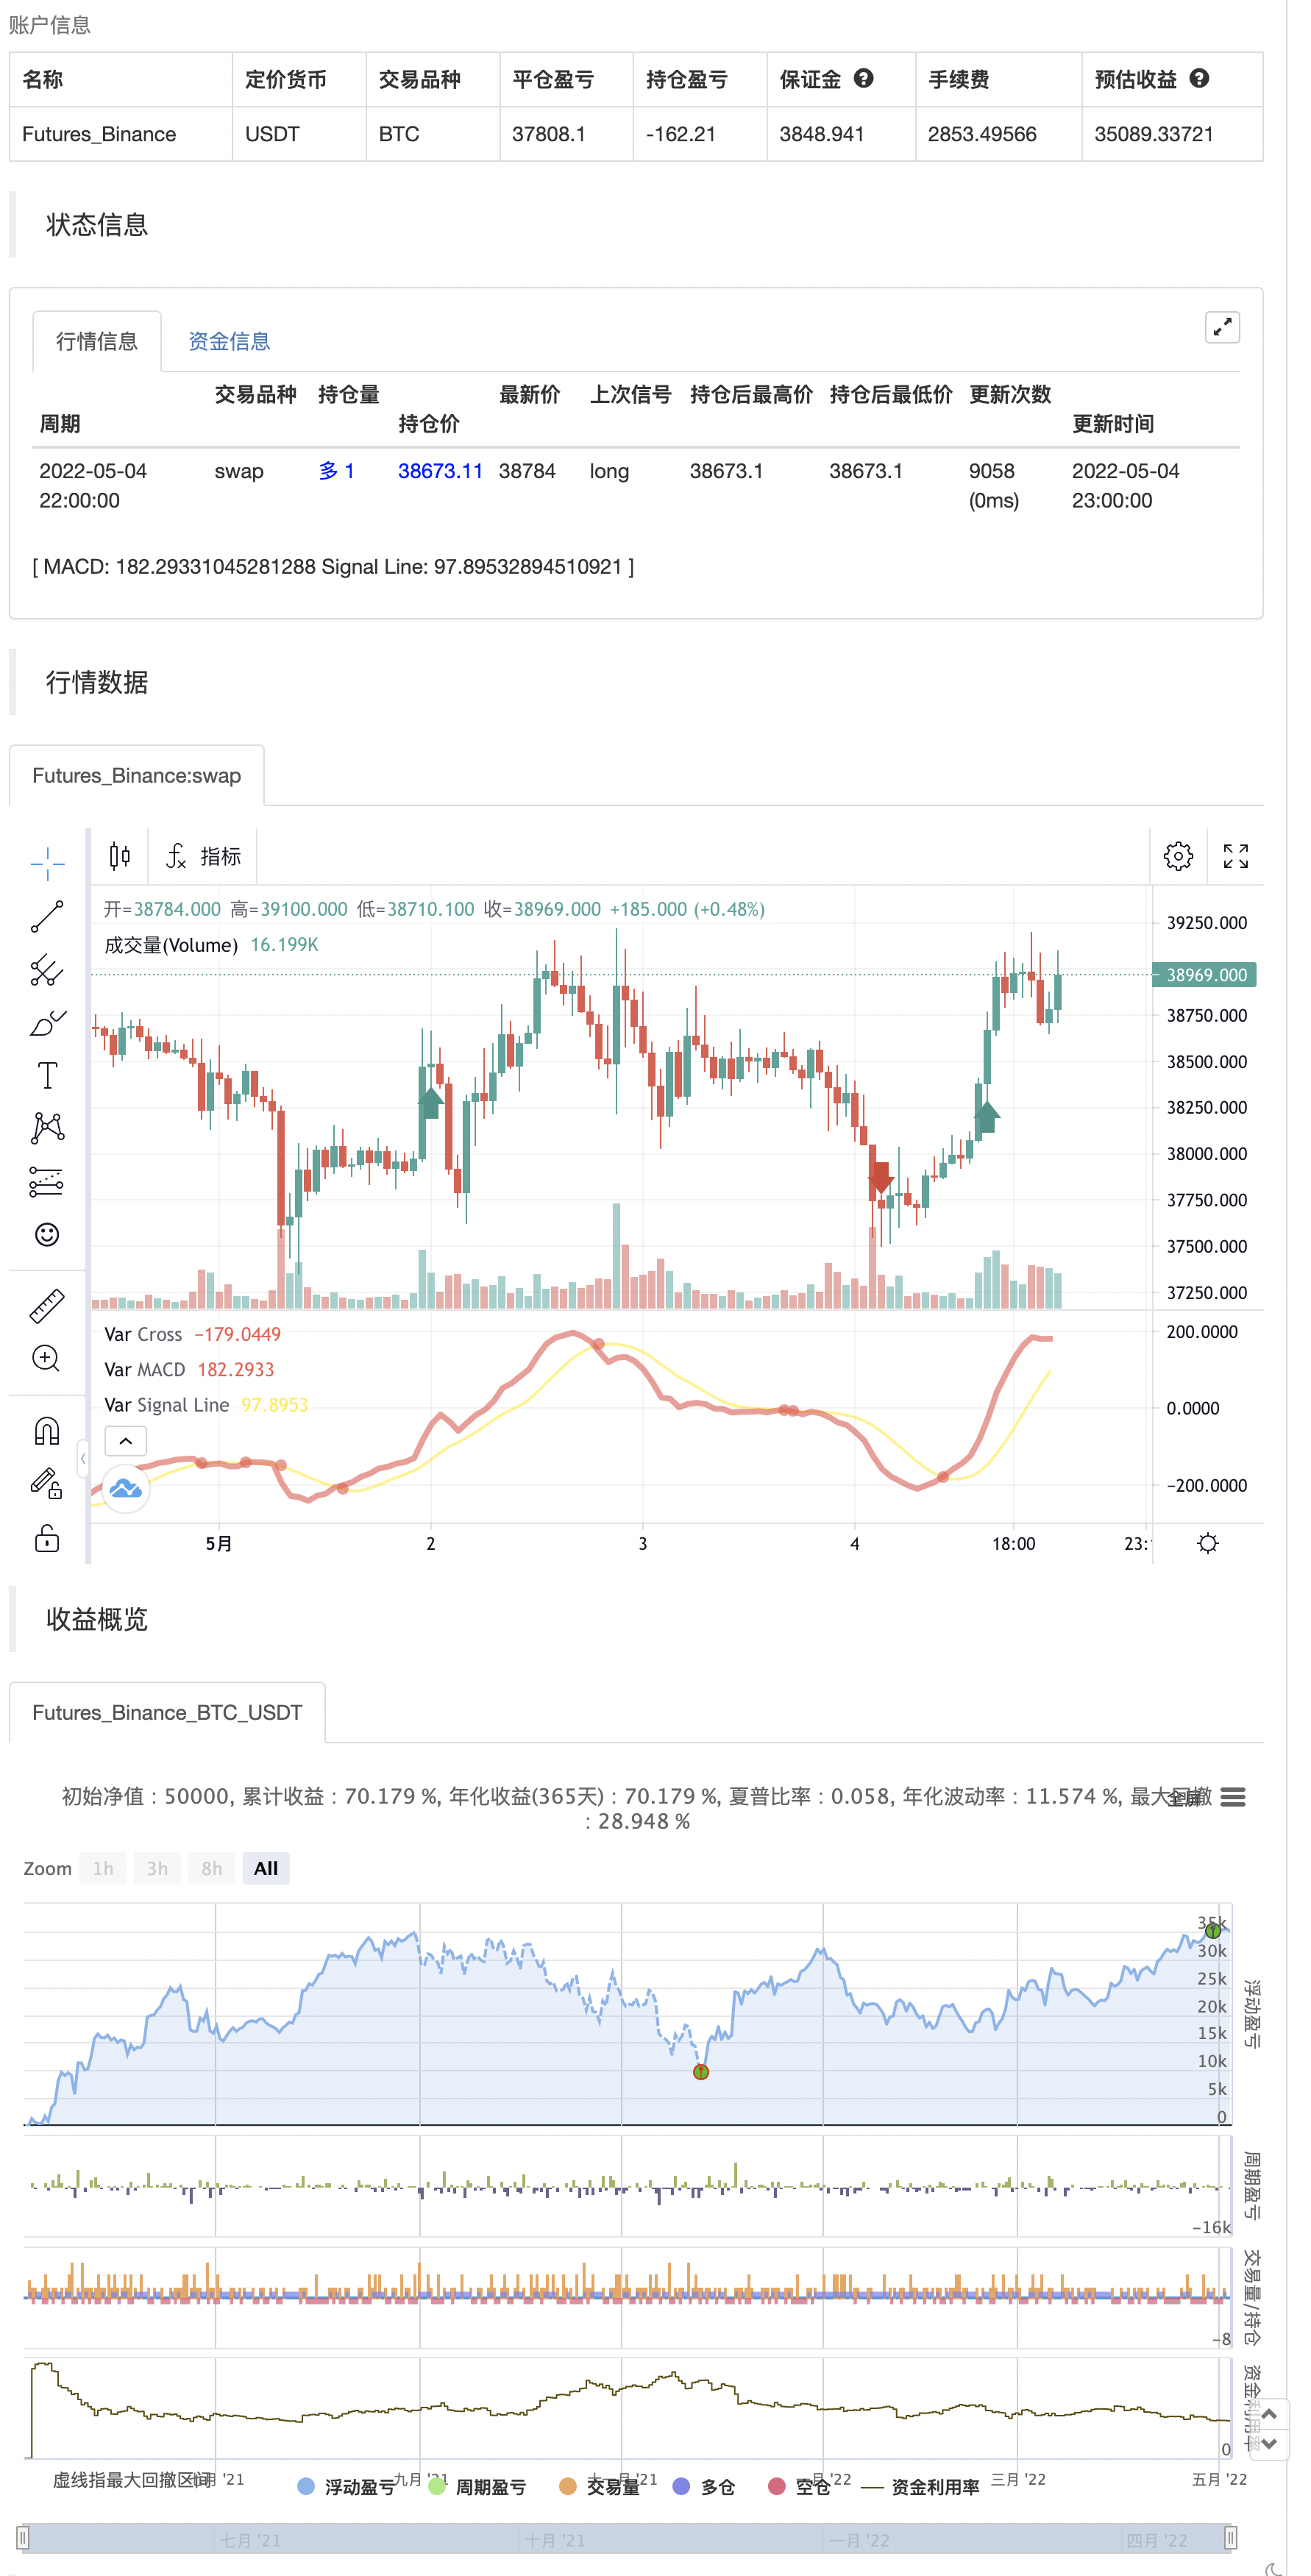
Indicateur MACD régulier avec histogramme qui trace 4 couleurs basées sur la direction au-dessus et au-dessous de la ligne zéro La mise à jour permet de cocher les options de la case à cocher, d'afficher MacD et la ligne de signal, d'afficher le changement de couleur de la ligne MacD en fonction de la ligne de signal. Afficher des points au croisement de MacD et de la ligne de signal, l'histogramme peut afficher 4 couleurs ou 1, allumer et éteindre l'histogramme. Merci à cette incroyable personne du support technique, je ne dirai pas votre nom pour ne pas vous bombarder d'emails. Notez la fonctionnalité Technique Support m'a montré sur la façon de définir le calendrier par défaut de l'indicateur au graphique Timeframe, mais aussi vous permettre de choisir un calendrier différent. Au fait, je vous avoue que j'ai volé les points de la croix de TheLark.
Réécriture
/*backtest
start: 2021-05-05 00:00:00
end: 2022-05-04 23:59:00
period: 1h
basePeriod: 15m
exchanges: [{"eid":"Futures_Binance","currency":"BTC_USDT"}]
*/

//Created by user ChrisMoody updated 4-10-2014
//Regular MACD Indicator with Histogram that plots 4 Colors Based on Direction Above and Below the Zero Line
//Update allows Check Box Options, Show MacD & Signal Line, Show Change In color of MacD Line based on cross of Signal Line.
//Show Dots at Cross of MacD and Signal Line, Histogram can show 4 colors or 1, Turn on and off Histogram.
//Special Thanks to that incredible person in Tech Support whoem I won't say you r name so you don't get bombarded with emails
//Note the feature Tech Support showed me on how to set the default timeframe of the indicator to the chart Timeframe, but also allow you to choose a different timeframe.
//By the way I fully disclose that I completely STOLE the Dots at the MAcd Cross from "TheLark"

study(title="CM_MacD_Ult_MTF", shorttitle="CM_Ult_MacD_MTF")
source = close
useCurrentRes = input(true, title="Use Current Chart Resolution?")
resCustom = input(title="Use Different Timeframe? Uncheck Box Above", defval="60")
smd = input(true, title="Show MacD & Signal Line? Also Turn Off Dots Below")
sd = input(true, title="Show Dots When MacD Crosses Signal Line?")
sh = input(true, title="Show Histogram?")
macd_colorChange = input(true,title="Change MacD Line Color-Signal Line Cross?")
hist_colorChange = input(true,title="MacD Histogram 4 Colors?")

res = useCurrentRes ? timeframe.period : resCustom

fastLength = input(12, minval=1), slowLength=input(26,minval=1)
signalLength=input(9,minval=1)

fastMA = ta.ema(source, fastLength)
slowMA = ta.ema(source, slowLength)

outMacD = fastMA - slowMA
outSignal = ta.sma(outMacD, signalLength)
outHist = outMacD - outSignal

//outMacD = request.security(timeframe.period, res, mymacd)
//outSignal = request.security(timeframe.period, res, signal)
//outHist = request.security(timeframe.period, res, hist)

histA_IsUp = outHist > outHist[1] and outHist > 0
histA_IsDown = outHist < outHist[1] and outHist > 0
histB_IsDown = outHist < outHist[1] and outHist <= 0
histB_IsUp = outHist > outHist[1] and outHist <= 0

//MacD Color Definitions
macd_IsAbove = outMacD >= outSignal
macd_IsBelow = outMacD < outSignal

plot_color = hist_colorChange ? histA_IsUp ? color.aqua : histA_IsDown ? color.blue : histB_IsDown ? color.red : histB_IsUp ? color.maroon :color.yellow :color.gray
macd_color = macd_colorChange ? macd_IsAbove ? color.lime : color.red : color.red
signal_color = macd_colorChange ? macd_IsAbove ? color.yellow : color.yellow : color.lime

circleYPosition = outSignal

plot(smd and outMacD ? outMacD : na, title="MACD", color=macd_color, linewidth=4)
plot(smd and outSignal ? outSignal : na, title="Signal Line", color=signal_color, style=plot.style_line ,linewidth=2)
//plot(sh and outHist ? outHist : na, title="Histogram", color=plot_color, style=histogram, linewidth=4)
plot(sd and ta.cross(outMacD, outSignal) ? circleYPosition : na, title="Cross", style=plot.style_circles, linewidth=4, color=macd_color)
//hline(0, '0 Line', linestyle=hline.style_solid, linewidth=2, color=color.white)

if outMacD > outSignal and math.abs(outMacD - outSignal) >90
    strategy.entry("entry long", strategy.long)
else if outMacD < outSignal and math.abs(outMacD - outSignal) >90
    strategy.entry("entry short", strategy.short)
- Stratégie MACD avancée avec Martingale limité
- Le décalage de tendance de H1 + le signal MACD de M15 + la stratégie de l'écart de volatilité rapide de M5
- Stratégie de croisement des moyennes mobiles doubles du MACD
- Le MACD RSI Ichimoku est une tendance de dynamique à la suite d'une longue stratégie.
- Stratégie de négociation basée sur les croisements consécutifs MACD or et mort
- La stratégie de croisement renforcée de l'EMA avec le RSI/MACD/ATR
- Stratégie de négociation à long terme combinée MACD et RSI
- Stratégie de combinaison de plusieurs indicateurs (CCI, DMI, MACD, ADX)
- Tendance multi-indicateurs à la suite de la stratégie
- La stratégie à court terme hybride CCI, DMI et MACD
- Théorie des ondes d'Elliott 4-9 Détection automatique des ondes d'impulsion Stratégie de trading
- SuperTrend
- Points de retournement de Demark
- Modèles d'altitude et de baisse et de bougies
- TMA surchargée
- La stratégie MACD + SMA 200
- Système de tir à la fronde CM
- Bollinger + RSI, stratégie double v1.1
- Stratégie des bandes de Bollinger
- Traqueur de tendance optimisé
- Retours mensuels dans les stratégies PineScript
- ADX et DI pour v4
- Indicateur: oscillateur de tendance d'onde
- Indicateur de momentum de compression
- AlphaTrend
- négociation sur plusieurs délais
- Oscillateur de sentiment
- Le Bitcoin et le Bitcoin sont des paires de devises en liquide utilisées pour la liquidation du marché.
- Stratégie des tortues
- Prends ta tendance
- AlphaTrend utilisation de la méthode