Meilleure stratégie de tradingView
Auteur:ChaoZhang est là., Date: 2022-05-09 21h08 et 17hLes étiquettes:Indice de résistance- Je vous en prie.
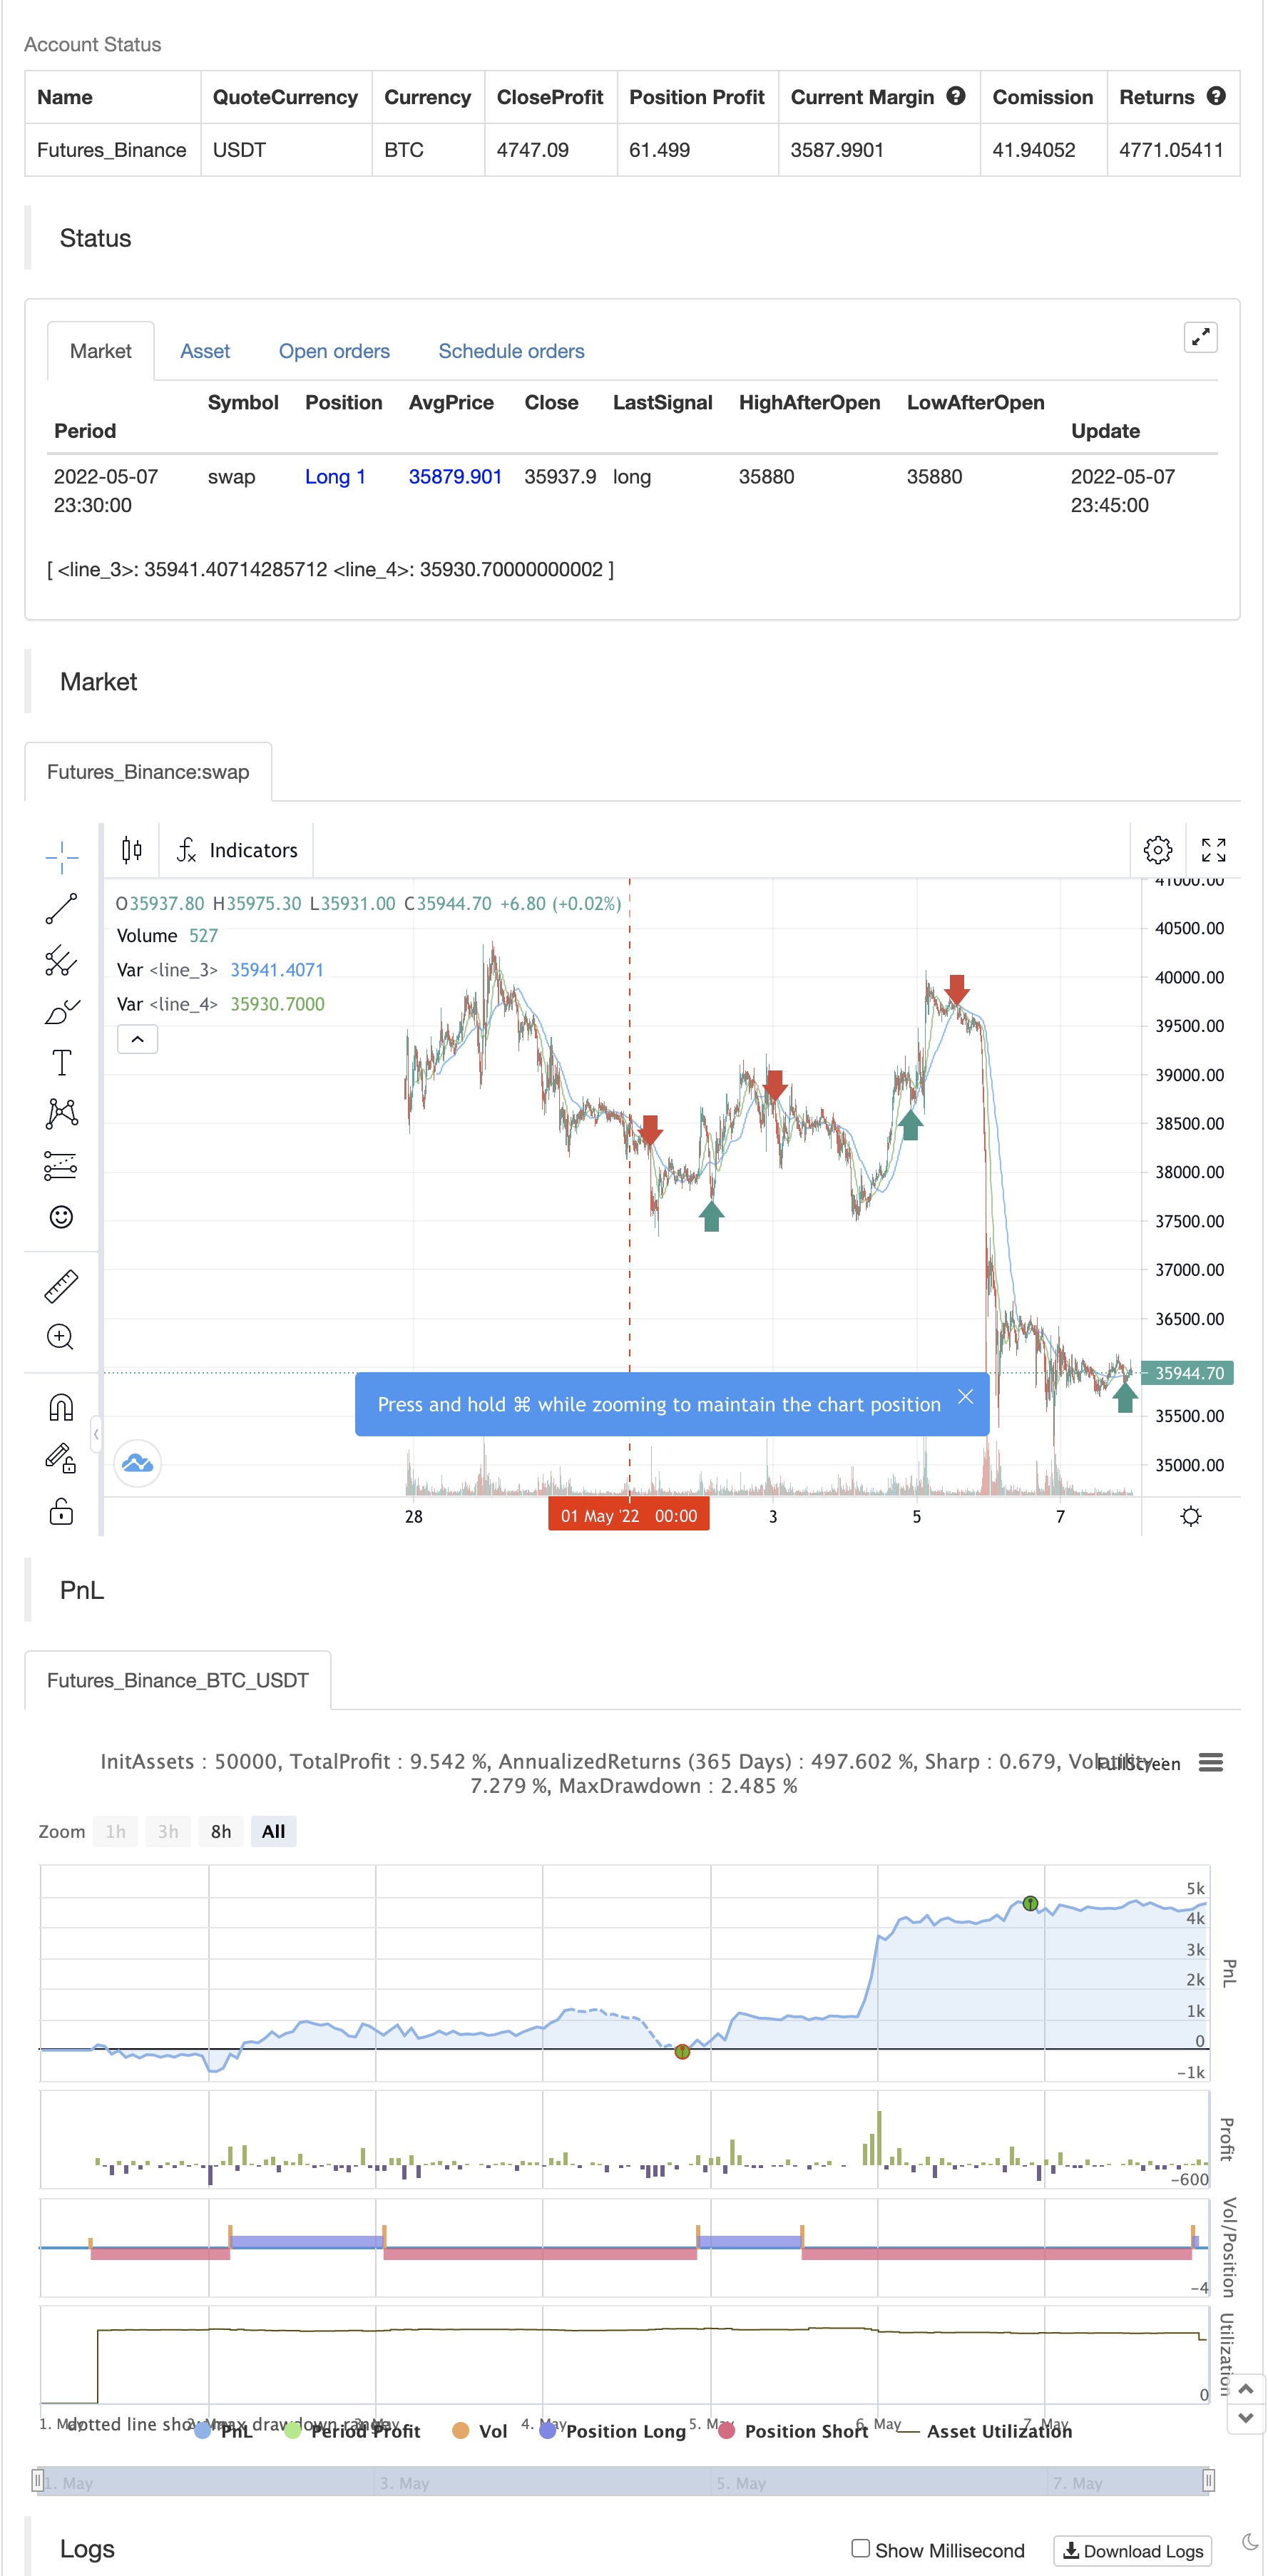
Le scénario est entièrement basé sur l'élan, le volume et le prix. 1: la bande de Bollinger presse pour savoir quand une évasion pourrait se produire. 2: Utilisation des moyennes mobiles (SMA et EMA) pour connaître la direction. 3: Le taux de réussite de cette stratégie est supérieur à 75% et si une petite action de prix est ajoutée, elle peut facilement dépasser la barre de réussite de 90%. 4: Ne vous inquiétez pas pour les retraits, nous avons mis en place SL de trailing, de sorte que vous pourriez voir un peu de retraits supplémentaires mais en réalité il est assez moins. 5: J'ai moi-même testé cette stratégie pendant 41 jours avec un compte de 250$ et maintenant j'ai 2700$.
test de retour
/*backtest
start: 2022-05-01 00:00:00
end: 2022-05-07 23:59:00
period: 15m
basePeriod: 5m
exchanges: [{"eid":"Bitfinex","currency":"BTC_USD"}]
*/

// This source code is subject to the terms of the Mozilla Public License 2.0 at https://mozilla.org/MPL/2.0/
// © The_Bigger_Bull
//@version=5
strategy("Best TradingView Strategy", overlay=true, margin_long=0, margin_short=0)
//Bollinger Bands
source1 = close
length1 = input.int(15, minval=1)
mult1 = input.float(2.0, minval=0.001, maxval=50)
basis1 = ta.sma(source1, length1)
dev1 = mult1 * ta.stdev(source1, length1)
upper1 = basis1 + dev1
lower1 = basis1 - dev1
//buyEntry = ta.crossover(source1, lower1)
//sellEntry = ta.crossunder(source1, upper1)

//RSI
ma(source, length, type) =>
    switch type
        "SMA" => ta.sma(source, length)
        "Bollinger Bands" => ta.sma(source, length)
        "EMA" => ta.ema(source, length)
        "SMMA (RMA)" => ta.rma(source, length)
        "WMA" => ta.wma(source, length)
        "VWMA" => ta.vwma(source, length)

rsiLengthInput = input.int(14, minval=1, title="RSI Length", group="RSI Settings")
rsiSourceInput = input.source(close, "Source", group="RSI Settings")
maTypeInput = input.string("SMA", title="MA Type", options=["SMA", "Bollinger Bands", "EMA", "SMMA (RMA)", "WMA", "VWMA"], group="MA Settings")
maLengthInput = input.int(14, title="MA Length", group="MA Settings")
bbMultInput = input.float(2.0, minval=0.001, maxval=50, title="BB StdDev", group="MA Settings")

up = ta.rma(math.max(ta.change(rsiSourceInput), 0), rsiLengthInput)
down = ta.rma(-math.min(ta.change(rsiSourceInput), 0), rsiLengthInput)
rsi = down == 0 ? 100 : up == 0 ? 0 : 100 - (100 / (1 + up / down))
rsiMA = ma(rsi, maLengthInput, maTypeInput)
isBB = maTypeInput == "Bollinger Bands"

//plot(rsi, "RSI", color=#7E57C2)
//plot(rsiMA, "RSI-based MA", color=color.yellow)
rsiUpperBand = hline(70, "RSI Upper Band", color=#787B86)
hline(50, "RSI Middle Band", color=color.new(#787B86, 50))
rsiLowerBand = hline(30, "RSI Lower Band", color=#787B86)
//fill(rsiUpperBand, rsiLowerBand, color=color.rgb(126, 87, 194, 90), title="RSI Background Fill")
bbUpperBand = plot(isBB ? rsiMA + ta.stdev(rsi, maLengthInput) * bbMultInput : na, title = "Upper Bollinger Band", color=color.green)
bbLowerBand = plot(isBB ? rsiMA - ta.stdev(rsi, maLengthInput) * bbMultInput : na, title = "Lower Bollinger Band", color=color.green)
//fill(bbUpperBand, bbLowerBand, color= isBB ? color.new(color.green, 90) : na, title="Bollinger Bands Background Fill")

//ADX

adxlen = input(14, title="ADX Smoothing")
dilen = input(14, title="DI Length")
dirmov(len) =>
	up1 = ta.change(high)
	down1 = -ta.change(low)
	plusDM = na(up1) ? na : (up1 > down1 and up1 > 0 ? up1 : 0)
	minusDM = na(down1) ? na : (down1 > up1 and down1 > 0 ? down1 : 0)
	truerange = ta.rma(ta.tr, len)
	plus = fixnan(100 * ta.rma(plusDM, len) / truerange)
	minus = fixnan(100 * ta.rma(minusDM, len) / truerange)
	[plus, minus]
adx(dilen, adxlen) =>
	[plus, minus] = dirmov(dilen)
	sum = plus + minus
	adx = 100 * ta.rma(math.abs(plus - minus) / (sum == 0 ? 1 : sum), adxlen)
sig = adx(dilen, adxlen)


out = ta.sma(close, 14)

sma1=ta.sma(close,42)

ema200=ta.ema(close,200)


longCondition = (out>sma1) and ta.crossover(source1, lower1)

if (longCondition )
    strategy.entry("long", strategy.long)

shortCondition = (out<sma1) and ta.crossunder(source1, lower1)

if (shortCondition )
    strategy.entry("short", strategy.short)


stopl=strategy.position_avg_price-50
tptgt=strategy.position_avg_price+100
stopshort=strategy.position_avg_price+50
tptgtshort=strategy.position_avg_price-100

strategy.exit("longclose","long",trail_offset=50,trail_points=100,when=ta.crossover(sma1,out))
strategy.exit("shortclose","short",trail_offset=50,trail_points=100,when=ta.crossover(out,sma1))


//if strategy.position_avg_price<0


plot(sma1 , color=color.blue)
plot(out, color=color.green)
//plot(ema200,color=color.red)
Relationnée
- Stratégie de redressement du mardi (filtre du week-end)
- Stratégie de négociation à haute fréquence de crypto-monnaie stable à faible risque basée sur le RSI et le MACD
- Stratégie de négociation complète des moyennes mobiles et du RSI
- Stratégie de négociation AlphaTradingBot
- Tendance multi-indicateurs à la suite de la stratégie
- Combinaison de la double MA et du RSI
- Théorie des ondes d'Elliott 4-9 Détection automatique des ondes d'impulsion Stratégie de trading
- Bollinger + RSI, stratégie double v1.1
- RSI - Signaux d'achat et de vente
- Stratégie d'optimisation statistique du RSI
Plus de
- Nik Stoch est là.
- le stock est supérieur à 200 ma
- RSI MTF et stratégie STOCH
- EMA + AROON + ASH
- Le momentum 2.0
- Stratégie de la gamme EHMA
- Moyenne mobile d'achat-vente
- Midas Mk. II - Le dernier Crypto Swing
- Le TMA-Legacy
- La stratégie de TV haut et bas
- Résultats de l'évaluation de la volatilité
- Chande Kroll Arrêtez
- CCI + EMA avec stratégie croisée RSI
- Stratégie de capture de tendance des bandes EMA + leledc + bandes Bollinger
- RSI MTF Ob+Os
- Stratégie MACD Willy
- RSI - Signaux d'achat et de vente
- La tendance de Heikin-Ashi
- HA Préjugés de marché
- L'oscillateur lisse du nuage Ichimoku