FTL - Filtre de portée X2 + EMA + UO
Auteur:ChaoZhang est là., Date: 2022-05-13 16h09:07Les étiquettes:Le taux d'intérêt
Ce script combine deux filtres de gamme, un EMA et l'oscillateur Ultimate. Il s'agit d'un type de script d'indicateur avec alertes idéal pour le scalping d'une minute et a été développé initialement pour NAS100, mais a été utilisé avec succès avec d'autres symboles. Les deux filtres de fourchette sont utilisés pour détecter lorsque les tendances à court et à moyen terme sont dans la même direction. L'EMA indique la tendance à plus long terme et l'UO est utilisé pour déterminer si un actif est suracheté ou survendu. Cet indicateur s'associe bien aux indicateurs de divergence pour ajouter une confluence à un changement de direction.
Caractéristiques supplémentaires de cet indicateur:
- Configurer si les étiquettes d'achat et de vente doivent être affichées uniquement lorsque l'actif n'est ni suracheté ni survendu
- Sélectionnez si vous souhaitez afficher les achats uniquement lorsque le prix est supérieur à la moyenne moyenne de négociation ou les ventes uniquement inférieures à la moyenne de négociation.
- Indiquer une barre où une tendance traverse l'EMA et sélectionner si le croisement ou le croisement sous doit être affiché uniquement dans une tendance inverse.
- On peut identifier des retraits au sein d'une tendance, ce qui peut indiquer une continuation de la tendance.
- Des alertes peuvent être créées pour les retraits, les passages de la EMA et les signaux d'achat ou de vente
test de retour
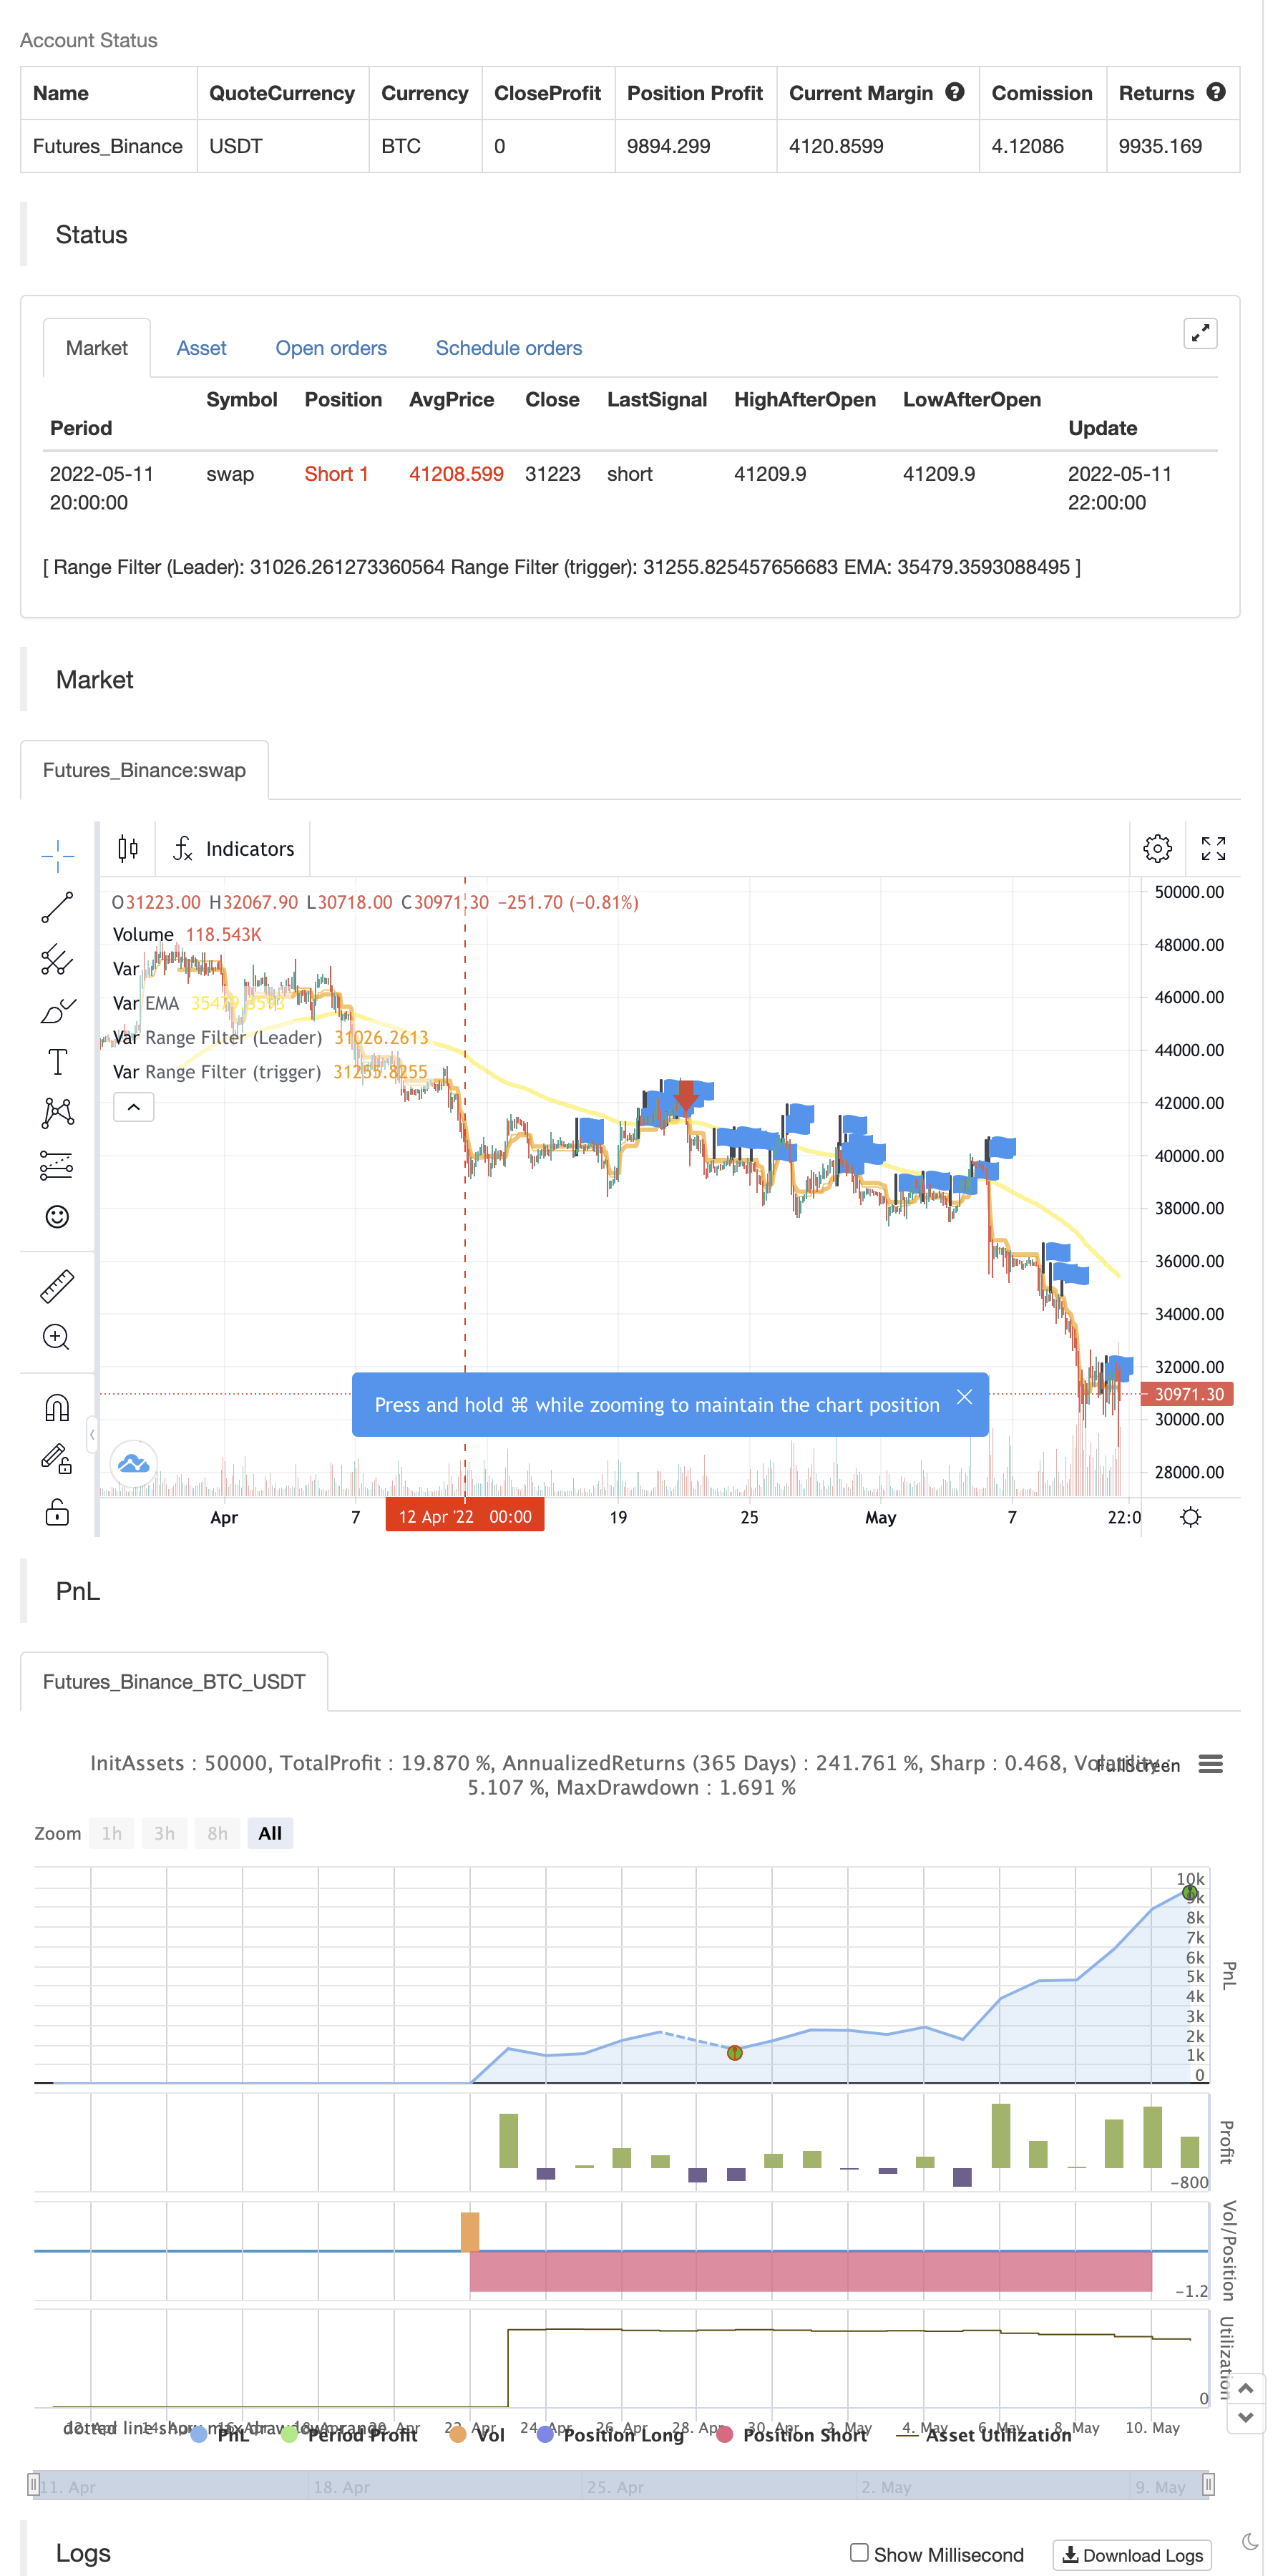
/*backtest
start: 2022-04-12 00:00:00
end: 2022-05-11 23:59:00
period: 2h
basePeriod: 15m
exchanges: [{"eid":"Futures_Binance","currency":"BTC_USDT"}]
*/

//@version=5


// Original Script > @DonovanWall

// Previous Version > @guikroth
// Ultimate Oscillator > @PineCoders

// Updated by > @jwelmac


//////////////////////////////////////////////////////////////////////////
// Range Filter x 2, EMA and UO
//////////////////////////////////////////////////////////////////////////


indicator(title='FTL - Range Filter X2 + EMA + UO', overlay=true)

// Groups

string groupLeadingRange = "Leading Range Filter"
string groupTriggerRange = "Trigger Range Filter"
string groupEMA = "EMA"
string groupUO = "Ultimate Oscillator (UO)"
string GROUP_BUY_OPTIONS = "Buy Options"
string GROUP_SELL_OPTIONS = "Sell Options"


//-------  *********  --------  *********  ---------
// Range Filter (Leader) {

// Source
src = input(defval=hl2, title='Source', group=groupLeadingRange)

// Sampling Period
per = input.int(defval=30, minval=1, title='Sampling Period', group=groupLeadingRange)

// Range Multiplier
mult = input.float(defval=2.6, minval=0.1, title='Range Multiplier', group=groupLeadingRange)

// Smooth Average Range {
smoothrng(x, t, m) =>
    wper = t * 2 - 1
    avrng = ta.ema(math.abs(x - x[1]), t)
    _smoothrng = ta.ema(avrng, wper) * m
    _smoothrng
// }
smrng = smoothrng(src, per, mult)

// Range Filter{
rngfilter(x, r) =>
    rngfilt = x
    rngfilt := x > nz(rngfilt[1]) ? x - r < nz(rngfilt[1]) ? nz(rngfilt[1]) : x - r : x + r > nz(rngfilt[1]) ? nz(rngfilt[1]) : x + r
    rngfilt
//}
filt = rngfilter(src, smrng)

// Filter Direction

upward = 0.0
upward := filt > filt[1] ? nz(upward[1]) + 1 : filt < filt[1] ? 0 : nz(upward[1])

downward = 0.0
downward := filt < filt[1] ? nz(downward[1]) + 1 : filt > filt[1] ? 0 : nz(downward[1])


// Colors

filtcolor = upward > 0 ? color.lime : downward > 0 ? color.red : color.orange

filtplot = plot(filt, color=filtcolor, linewidth=1, title='Range Filter (Leader)')

// }
//-------  *********  --------  *********  ---------

//-------  *********  --------  *********  ---------
// Range Filter (Trigger){
// Source
src2 = input(defval=ohlc4, title='Source', group=groupTriggerRange)

// Sampling Period
// Settings for 1min chart, US 100.

per2 = input.int(defval=48, minval=1, title='Sampling Period', group=groupTriggerRange)

// Range Multiplier

mult2 = input.float(defval=3.4, minval=0.1, title='Range Multiplier', group=groupTriggerRange)

// Smooth Average Range

smrng2 = smoothrng(src2, per2, mult2)

// Range Filter

rngfilt2(x, r) =>
    rngfilt = x
    rngfilt := x > nz(rngfilt[1]) ? x - r < nz(rngfilt[1]) ? nz(rngfilt[1]) : x - r : x + r > nz(rngfilt[1]) ? nz(rngfilt[1]) : x + r
    rngfilt
filt2 = rngfilt2(src2, smrng2)

// Filter Direction

upward2 = 0.0
upward2 := filt2 > filt2[1] ? nz(upward2[1]) + 1 : filt2 < filt2[1] ? 0 : nz(upward2[1])
downward2 = 0.0
downward2 := filt2 < filt2[1] ? nz(downward2[1]) + 1 : filt2 > filt2[1] ? 0 : nz(downward2[1])

// Colors

filtcolor2 = upward2 > 0 ? color.lime : downward2 > 0 ? color.red : color.orange

filtplot2 = plot(filt2, color=filtcolor2, linewidth=3, title='Range Filter (trigger)')

barcolor = src2 > filt2 and upward2 > 0
   ? color.green
   : src2 < filt2 and downward > 0
     ? color.red
     : color.rgb(120, 123, 134)
// Bar Color
//barcolor(barcolor)

// }
//-------  *********  --------  *********  ---------


//-------  *********  --------  *********  ---------
// Default EMA 144 {
len4 = input.int(144, minval=1, title='Length', group=groupEMA)
src4 = input(close, title='Source')
ema = ta.ema(src4, len4)
plot(ema, linewidth=3, color=color.new(color.yellow, 0), title='EMA')
closeAboveEma = close > ema
closeBelowEma = close < ema

uptrendCrossoverOnly = input.bool(false, title="Show crossover only in uptrend", group=groupEMA)
downtrendCrossunderOnly = input.bool(false, title="Show crossunder only in downtrend", group=groupEMA)
// END EMA
// }
//-------  *********  --------  *********  ---------


// ------ UO {
average(bp, tr_, length) => math.sum(bp, length) / math.sum(tr_, length)
uo() =>
    length1 = input.int(7, minval=1, title = "Fast Length", group=groupUO),
    length2 = input.int(14, minval=1, title = "Middle Length", group=groupUO),
    length3 = input.int(28, minval=1, title = "Slow Length", group=groupUO)
    high_ = math.max(high, close[1])
    low_ = math.min(low, close[1])
    bp = close - low_
    tr_ = high_ - low_
    avg7 = average(bp, tr_, length1)
    avg14 = average(bp, tr_, length2)
    avg28 = average(bp, tr_, length3)
    100 * (4*avg7 + 2*avg14 + avg28)/7
uoLevel = uo()
// }


// Break Outs
// Conditions {

longCond = bool(na)
shortCond = bool(na)
longCond := src > filt2 and src > src[1] and upward2 > 0 or src > filt2 and src < src[1] and upward2 > 0
shortCond := src < filt2 and src < src[1] and downward2 > 0 or src < filt2 and src > src[1] and downward2 > 0

CondIni = 0
CondIni := longCond ? 1 : shortCond ? -1 : CondIni[1]


// Long (Buy){
overBoughtLevel = input.float(defval=60, minval=50, title='UO Overbought value', group=GROUP_BUY_OPTIONS)
longWhenNotOverbought = input.bool(true, title = 'Show BUY only when not overbought (UO)', tooltip = 'Show BUY Signal only when not overbought according to UO', group=GROUP_BUY_OPTIONS)
longOnlyAboveEma = input.bool(true, title = 'Show BUY only above the EMA', tooltip = 'Show BUY Signal only when price closes above the EMA', group=GROUP_BUY_OPTIONS)

longCondition = longCond and CondIni[1] == -1
overBought = uoLevel > overBoughtLevel

if (longCondition and longWhenNotOverbought)
    longCondition := not overBought

if (longCondition and longOnlyAboveEma)
    longCondition := closeAboveEma
//}

// Short (Sell){
overSoldLevel = input.float(defval=40, maxval=50, title='UO Oversold value', group=GROUP_SELL_OPTIONS)
shortWhenNotOversold = input.bool(true, title = 'Show SELL only when not oversold (UO)', tooltip = 'Show SELL Signal only when not oversold according to UO', group=GROUP_SELL_OPTIONS)
shortOnlyBelowEma = input.bool(true, title = 'Show SELL only below the EMA', tooltip = 'Show SELL Signal only when price closes below the EMA', group=GROUP_SELL_OPTIONS)

shortCondition = shortCond and CondIni[1] == 1
overSold = uoLevel < overSoldLevel

if (shortCondition and shortWhenNotOversold)
    shortCondition := not overSold

if (shortCondition and shortOnlyBelowEma)
    shortCondition := closeBelowEma
//}

// }

// Trend directions {
trendUp = upward and upward2
trendDown = downward and downward2
// }

// MA Crossover{
arrowSize = size.small

emaCrossover = 'EMA Crossover'
didEmaCrossover = (not uptrendCrossoverOnly or trendUp) and ta.crossover(close, ema)
plotshape(
  didEmaCrossover,
  title = emaCrossover,
  style = shape.triangleup,
  size = arrowSize,
  location = location.belowbar,
  color = color.new(color.green, 0)
  )

emaCrossunder = 'EMA Crossunder'
didEmaCrossunder = (not downtrendCrossunderOnly or trendDown) and ta.crossunder(close, ema)
plotshape(
  didEmaCrossunder,
  title = emaCrossunder,
  style = shape.triangledown,
  size = arrowSize,
  location = location.abovebar,
  color = color.new(color.red, 0)
  )
// }

// Pullbacks (a possible indicator of trend continuation) {
// Conditions:
// - Both filters going in same direction
sameDirection = trendUp or trendDown

// Did the previous candle close in the opposite direction
prevOpp = (trendUp and close[1] < open[1]) or (trendDown and open[1] < close[1])

// Is the current candle in the trend direction
inTrendDirection = (trendDown and close < open) or (trendUp and close > open)

// - previous candle: crossover one or both in downtrend, crossunder one or both in uptrend
prevLimit = trendDown ? high[1] : low[1]
var previousCross = false

if (trendDown)
    previousCross := ta.crossover(prevLimit, filt[1]) or ta.crossover(prevLimit, filt2[1])
else
    previousCross := ta.crossunder(prevLimit, filt[1]) or ta.crossunder(prevLimit, filt2[1])

// - current candle: crossunder one or both in downtrend, crossover one or both in uptrend
currentReturn = trendDown
  ? close < filt
  : close > filt

pullback = prevOpp and inTrendDirection and sameDirection and previousCross and currentReturn

uptrendPullback = 'Uptrend Pullback'
isUptrendPullback = pullback and trendUp
plotshape(
  isUptrendPullback,
  title = uptrendPullback,
  style = shape.diamond,
  size = arrowSize,
  location = location.belowbar,
  color = color.new(color.green, 0)
  )

downtrendPullback = 'Downtrend Pullback'
isDowntrendPullback = pullback and trendDown
plotshape(
  isDowntrendPullback,
  title = 'Downtrend Pullback',
  style = shape.diamond,
  size = arrowSize,
  location = location.abovebar,
  color = color.new(color.red, 0)
  )

// }

// Buy/Sell Signal {
plotshape(longCondition, title='Buy Signal', text='BUY', textcolor=color.new(color.white, 0), style=shape.labelup, size=size.normal, location=location.belowbar, color=color.new(color.green, 0))
plotshape(shortCondition, title='Sell Signal', text='SELL', textcolor=color.new(color.white, 0), style=shape.labeldown, size=size.normal, location=location.abovebar, color=color.new(color.red, 0))
//}

//Alerts{

alertcondition(longCondition, title='Buy Alert', message='BUY')
alertcondition(shortCondition, title='Sell Alert', message='SELL')

alertcondition(didEmaCrossover, title = emaCrossover, message = emaCrossover)
alertcondition(didEmaCrossunder, title = emaCrossunder, message = emaCrossover)

alertcondition(isUptrendPullback, title=uptrendPullback, message = uptrendPullback)
alertcondition(isDowntrendPullback, title=downtrendPullback, message = downtrendPullback)
// }


// For use like Strategy, {

//1. Change the word  "indicator" for "strategy" at the top
//2.  Remove the "//" below

//strategy.entry( id = "Long", long = true, when = longCondition )
//strategy.close( id = "Long", when = shortCondition )
// }

if longCondition
    strategy.entry("Enter Long", strategy.long)
else if shortCondition
    strategy.entry("Enter Short", strategy.short)
Relationnée
- Stratégie de négociation basée sur les croisements consécutifs MACD or et mort
- Stratégie de négociation des bandes de Bollinger améliorées RSI
- Stratégie d'échange croisé à trois EMA
- Stratégie d'effet de levier croisé sur la moyenne mobile exponentielle
- Stratégie de moyenne mobile double GM-8 et ADX
- La stratégie de croisement renforcée de l'EMA avec le RSI/MACD/ATR
- La tendance du score Z suivant la stratégie
- L'entrée longue sur l'EMA croise avec la stratégie de gestion des risques
- Stratégie de négociation du VWAP
- La stratégie de WaveTrend Cross LazyBear
- Stratégie de négociation AlphaTradingBot
Plus de
- Points de pivotement haut bas multi-temps
- Une base de données de stratégies de suivi de la tendance fantôme
- Les phantômes suivent les stratégies de l'entreprise
- Les stratégies de suivi de la tendance fantôme
- Oscillateur arc-en-ciel
- Exemple de dimensionnement des positions de négociation de la courbe des actions
- Une démonstration de KLineChart
- Stratégie de super-tendance à pivot dynamique
- La super tendance de Crodl
- RSI par zdmre
- Le BRAHMASTRA
- Bandes de Mobo
- SAR + 3SMMA avec SL et TP
- Résultats
- Modèle d'alerte de lancement lunaire [indicateur]
- HALFTREND + HEMA + SMA (stratégie du faux signal)
- RSI Divergence avec le pivot, BB, SMA, EMA, SMMA, WMA, VWMA
- RSI et BB et survendus simultanément
- Des bougies Heikin Ashi en roulement
- Combo 2/20 EMA et filtre à bande passante