Stratégie de tendance Super Ichimoku

Aperçu
La stratégie de couverture est une stratégie de négociation de tendances basée sur des indicateurs de couverture pour prendre des décisions de négociation. La stratégie utilise la ligne de conversion, la ligne de référence et la relation de la bande de nuage de l'indicateur de couverture pour juger de la direction de la tendance actuelle et combiner la rétroaction du prix pour entrer.
La stratégie de super 1 est principalement utilisée pour les transactions de tendances sur les lignes moyennes et longues, et peut être rentable dans les grandes tendances. La stratégie possède également une forte capacité de reconnaissance des tendances.
Principe de stratégie
Les facteurs qui déterminent la direction de la transaction sont principalement les suivants:
-
**La relation entre la ligne de conversion et la ligne de référence:**La ligne de conversion est positive en hausse et négative en baisse.
-
**La couleur des nuages:**Quand les nuages sont verts, vous pouvez voir des aiguilles, quand ils sont rouges, vous pouvez voir des baisses.
-
**Les prix ont été revus:**L'entrée nécessite une reprise des prix au-delà de la ligne de conversion et de la ligne de référence
Les signaux de négociation de la stratégie sont les suivants:
Il y a un autre problème.
- La ligne de conversion est supérieure à la ligne de référence
- Les prix sont supérieurs à la ligne de conversion et à la ligne de référence
- Ligne de conversion et ligne de référence au-dessus de la bande nuageuse
- Retour des prix en dessous de la ligne de conversion et de la ligne de référence
Je ne suis pas d'accord avec toi.
- Ligne de conversion inférieure à la ligne de référence
- Prix inférieurs à la ligne de conversion et à la ligne de référence
- Ligne de conversion et ligne de référence en dessous de la bande nuageuse
- Les prix se retournent au-dessus des lignes de conversion et de référence
Lorsqu'un signal de plus ou de moins est satisfait en même temps, l'opération d'ouverture est effectuée en fonction de la situation de la position.
Analyse des avantages
Les avantages de cette stratégie sont les suivants:
-
Une meilleure précision pour déterminer la direction des tendances en utilisant une combinaison de plus d'un indicateur
-
Les lignes de conversion et les lignes de référence permettent de déterminer clairement les tendances à court et moyen terme, les bandes nuageuses permettent de déterminer les tendances à long terme
-
Les conditions exigent que le prix revienne sur la ligne de rotation pour éviter les pertes causées par les fausses percées.
-
Le contrôle des risques utilise le plus bas prix le plus élevé de la période la plus récente pour régler le stop loss et contrôler efficacement les pertes individuelles
-
Des profits plus que raisonnables, des gains plus stables
-
Appliqué à différents cycles, adapté au trading de tendances à courte ou moyenne durée
-
L'idée stratégique est claire et facile à comprendre, les paramètres sont optimisés.
-
Il peut fonctionner dans plusieurs environnements de marché.
Analyse des risques
La stratégie de l'excès d'unité présente également les risques suivants:
-
En cas de choc, les arrêts de perte peuvent être déclenchés fréquemment, ce qui affecte les résultats.
-
L'incapacité à inverser une position en temps opportun peut entraîner des pertes lorsque les tendances changent rapidement
-
Le rapport de profit/perte n'est pas adapté à toutes les variétés et nécessite des paramètres d'ajustement pour différents échantillons
-
Les bénéfices peuvent être limités lorsque l'espace d'ascension est limité après la rupture de la bande nuageuse.
-
Les paramètres de l'indicateur nécessitent des tests répétés et une optimisation, ce qui ne convient pas aux variétés dont les paramètres sont souvent ajustés
Le risque peut être réduit par:
-
Optimisation des paramètres pour les rendre plus adaptés aux différents cycles et variétés
-
En combinaison avec d'autres indicateurs, filtrer les signaux d'entrée de jeu pour éviter les fausses percées dans les marchés en crise
-
Ajustez dynamiquement la position de votre arrêt pour réduire la probabilité qu'il soit déclenché
-
Tester différents réglages de la rentabilité
-
Déterminer la force des signaux de tendance en utilisant des méthodes telles que la forme du graphique
Direction d'optimisation
Les stratégies d'optimisation de l'excès peuvent être optimisées dans les domaines suivants:
-
Optimisation des paramètres de la ligne de conversion et de la ligne de référence pour les rendre plus conformes aux caractéristiques des variétés négociées
-
Optimisation des paramètres de la ceinture de nuages pour une meilleure compréhension des tendances à long terme
-
Optimisation des algorithmes de stop loss, tels que le stop loss réglé selon l'ATR ou le stop loss dynamique
-
Filtrage du signal en combinaison avec d'autres indicateurs, configuration d'autres conditions de filtrage, réduction de la probabilité de fausse entrée
-
Optimiser les paramètres de la balance des gains et des pertes, adapter la stratégie aux différentes variétés et caractéristiques du cycle
-
Gestion de positions selon le modèle Martinegger, adaptée à la fréquence des fluctuations de marché
-
Optimisation des paramètres par apprentissage automatique pour une plus grande stabilité
-
Configuration de différentes périodes de négociation, adaptée aux caractéristiques du marché pour les heures de nuit et les heures intermédiaires
Résumer
L'ensemble de la stratégie Super 1 est une stratégie très appropriée pour la négociation de tendances à moyen et long terme. Les avantages de l'utilisation de l'indicateur Super 1 pour déterminer la direction de la tendance sont évidents, tandis que l'entrée combinée à la rétroaction des prix permet d'éviter efficacement les entrées erronées.
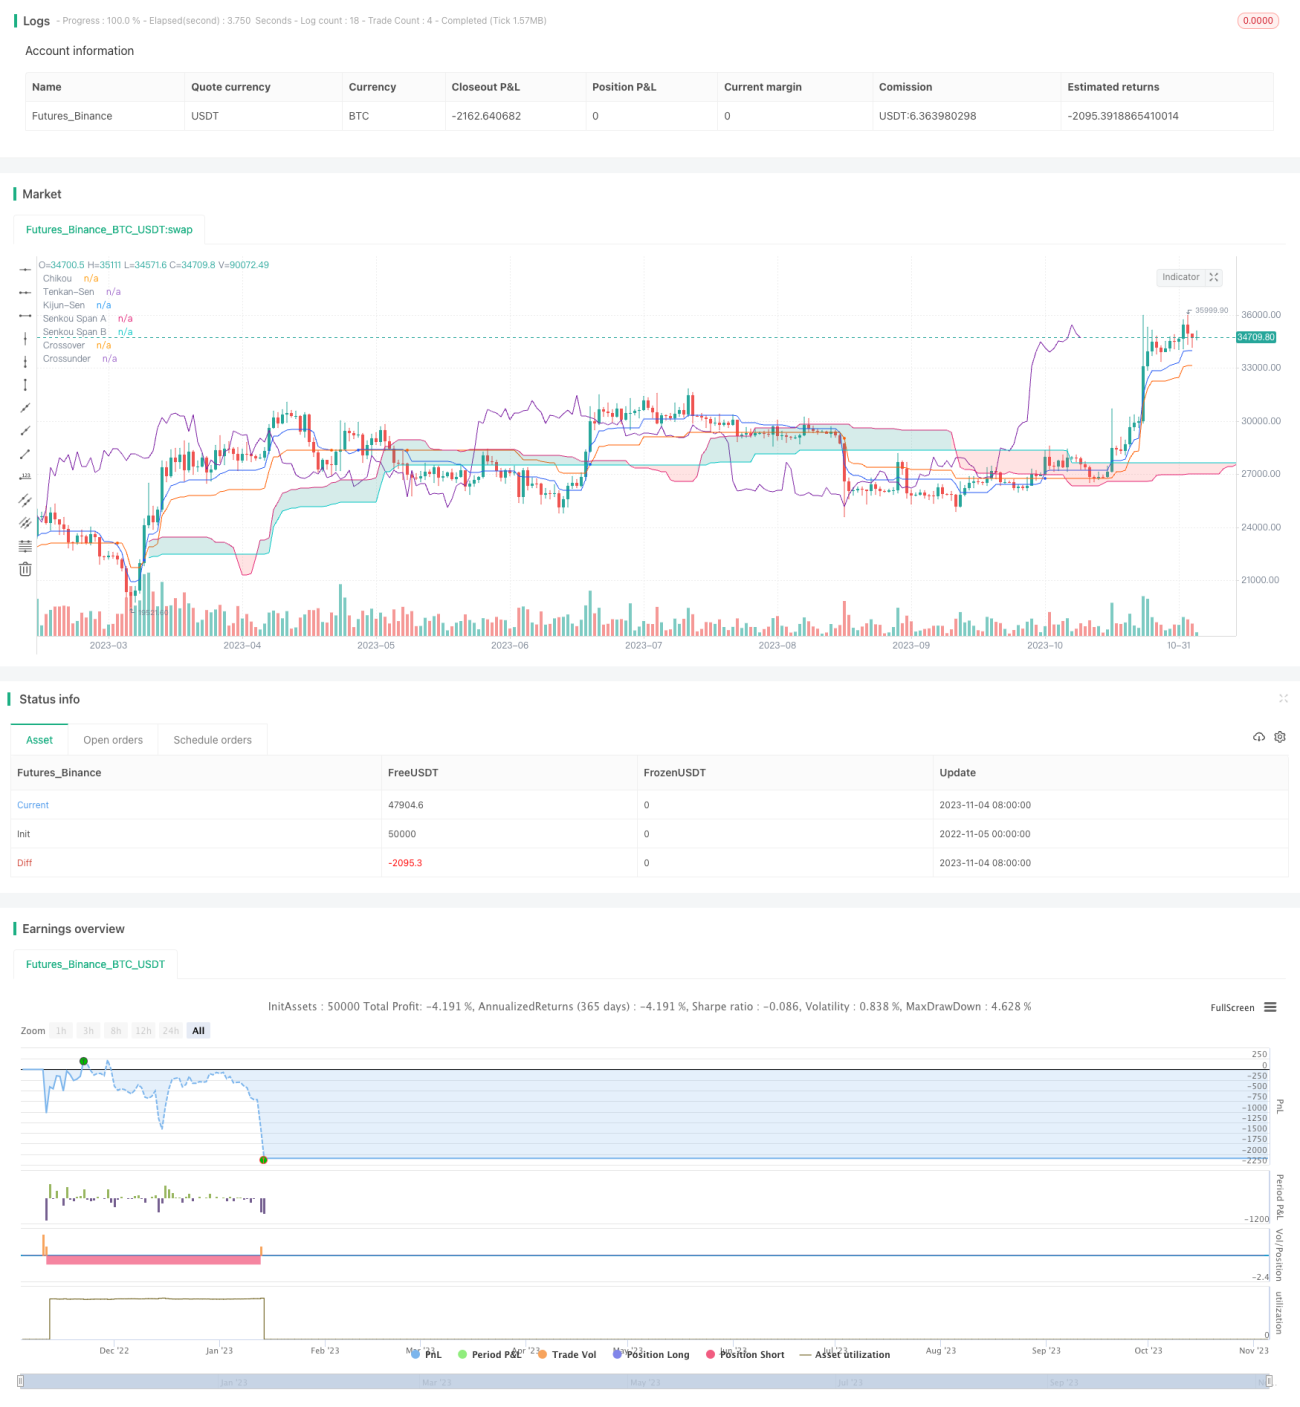
/*backtest
start: 2022-11-05 00:00:00
end: 2023-11-05 00:00:00
period: 1d
basePeriod: 1h
exchanges: [{"eid":"Futures_Binance","currency":"BTC_USDT"}]
*/

// Strategy based on the the SuperIchi indicator.
//
// Strategy was designed for the purpose of back testing.
// See strategy documentation for info on trade entry logic.- 1