Stratégie de croisement de moyenne mobile suivant une tendance à double sens

1
Follow
1779
Followers
Aperçu
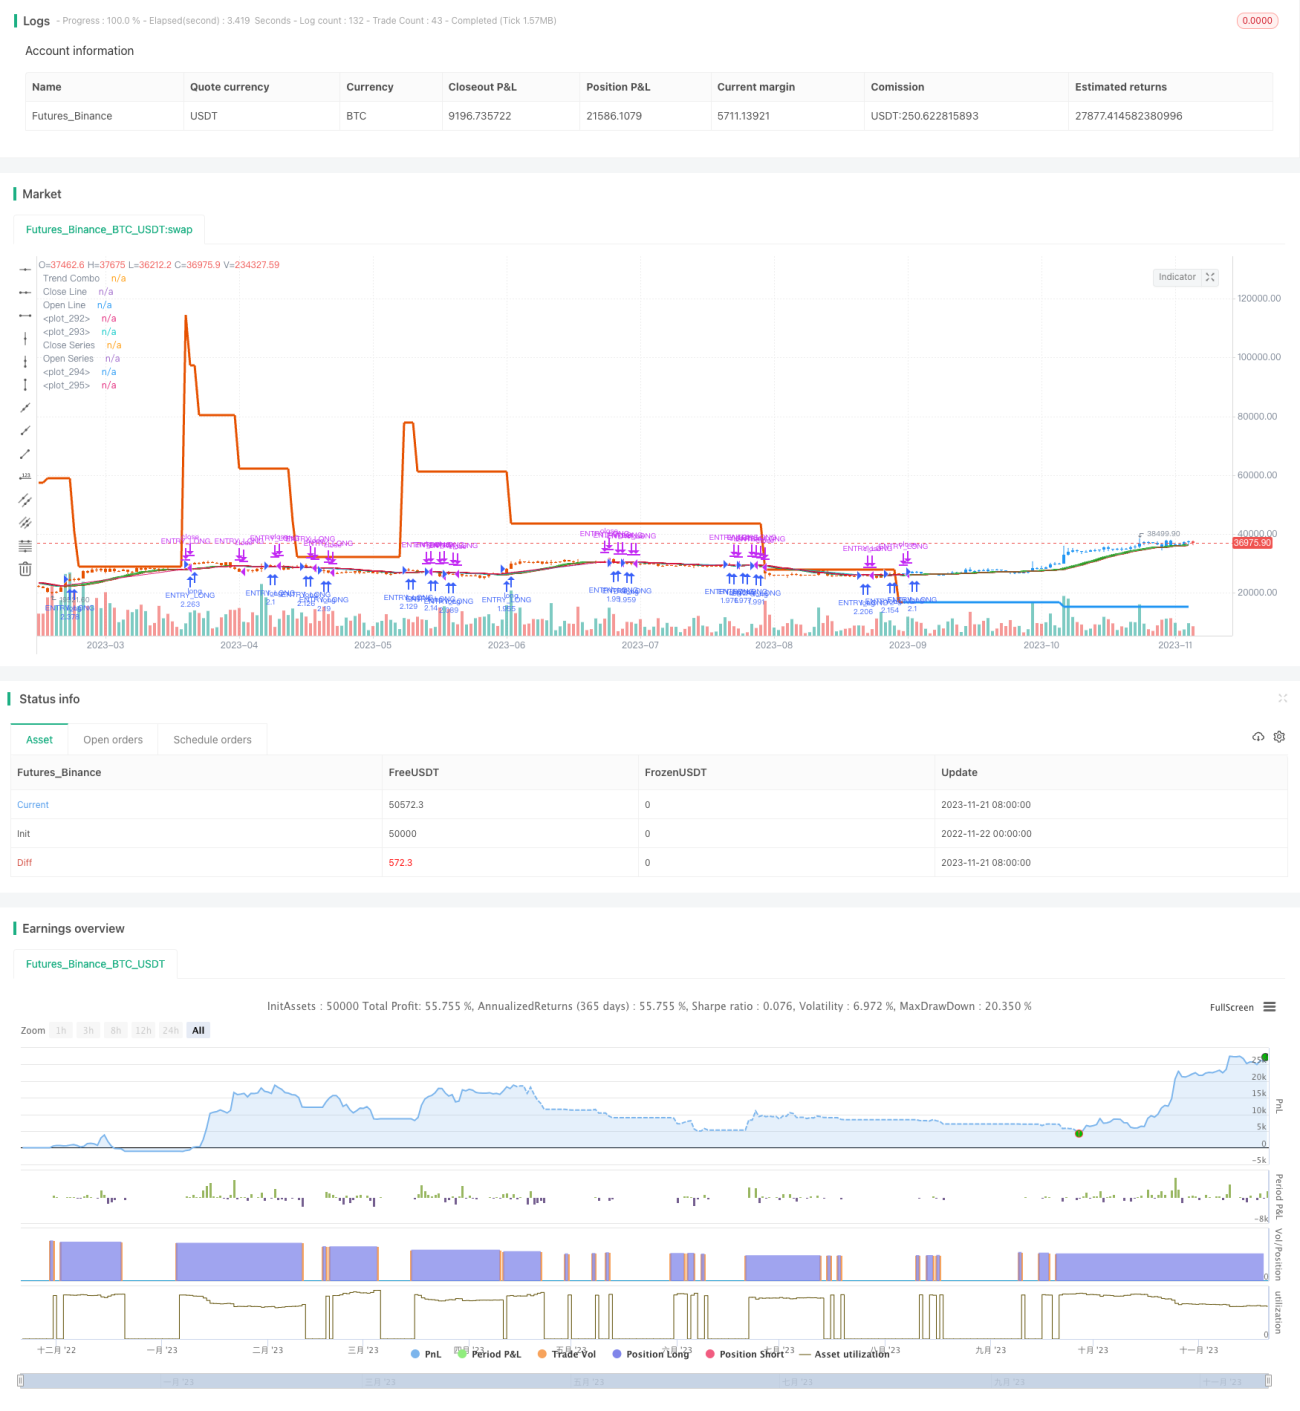
Cette stratégie permet de réaliser une stratégie de négociation croisée qui permet de suivre automatiquement les tendances des prix en calculant des moyennes mobiles à deux voies, en combinaison avec des indicateurs de tendance. Cette stratégie vise à suivre les tendances à long terme et à tirer un plus grand profit des tendances fortes.
Principe de stratégie
- Calculer une moyenne mobile bidirectionnelle, comprenant la moyenne des prix d'ouverture et la moyenne des prix de clôture
- L'indicateur de tendance des prix est calculé à l'aide des coefficients pertinents et de l'indicateur ATR.
- L'indicateur de tendance des prix est combiné avec une moyenne mobile bidirectionnelle pour obtenir un jugement de tendance global.
- Faire plus lorsque la moyenne des cours d'ouverture et de clôture se forgent; faire moins lorsque la moyenne des cours de clôture et de clôture se forgent.
- En combinaison avec l'indicateur de tendance, on ne peut ouvrir une position que si l'indicateur de tendance est en hausse et en baisse.
Avantages stratégiques
- Les moyennes mobiles bidirectionnelles suivent les tendances des prix de manière plus fluide et stable.
- Les indicateurs de tendance, combinés, permettent de mieux juger de la direction de la tendance et d'éviter les erreurs de trading.
- Les fourches dorées et les fourches mortes sont utilisées pour déterminer le moment précis de la transaction, de manière plus précise.
- Le niveau de liberté de choix peut être ajusté par paramètres pour s'adapter à un environnement plus large.
- Plusieurs indicateurs se vérifient mutuellement pour réduire les faux signaux.
Risque stratégique
- Le risque de manquer une inversion à un tournant de tendance peut être réduit en ajustant la période de la moyenne mobile.
- Les moyennes mobiles bidirectionnelles sont elles-mêmes très retardées et doivent être vérifiées par les indicateurs de tendance.
- Une mauvaise périodicité des moyennes mobiles peut entraîner une fréquence de négociation trop élevée ou un mauvais timing des transactions.
- Les paramètres d'optimisation doivent être testés à plusieurs reprises pour s'adapter à différents cycles et environnements de marché.
Orientation de l'optimisation de la stratégie
- Test d'autres types de moyennes mobiles
- Essayez d'autres types d'indicateurs.
- Optimiser les paramètres des moyennes mobiles et des indicateurs de tendance
- Essayez de les combiner avec d'autres indicateurs, comme le taux de volatilité.
- Une stratégie de stop-loss supplémentaire
Résumer
Cette stratégie permet de prédire les tendances des prix à partir de plusieurs dimensions et de suivre de manière stable les tendances longues après optimisation des paramètres. Cependant, il faut veiller à éviter une optimisation excessive et une mesure de fitting. Globalement, la stratégie permet de suivre les tendances longues avec un risque moindre et mérite d'être étudiée et appliquée davantage.
Source
Pine
Strategy parameters
Related strategies
Comment
All comments (0)
No data
- 1