Stratégie de suivi des tendances à court terme basée sur les bandes de Bollinger

Aperçu
La stratégie de rupture de la ceinture de Brin est une stratégie de suivi de la tendance à court terme basée sur l'indicateur de la ceinture de Brin. Elle peut exécuter des opérations dans les deux sens, à plusieurs têtes et à vide. Elle s'applique aux contrats à terme et à durée indéterminée, en particulier dans les conditions de tendance.
La stratégie est hautement configurable, permettant à l'utilisateur de définir les paramètres de la courbe de Bryn Mawr, les périodes et les déviations, les filtres de tendance, les filtres de volatilité, les filtres de direction de la transaction, les filtres de taux de variation et les filtres de date. En outre, il définit des arrêts de perte, des arrêts et des arrêts de suivi pour les positions à plusieurs têtes et à vide, assurant une approche complète de la gestion des risques. L'ajout de la plus grande perte par jour offre une autre couche de protection, ce qui en fait un système de trading adapté et professionnel digne de confiance.
Principe de stratégie
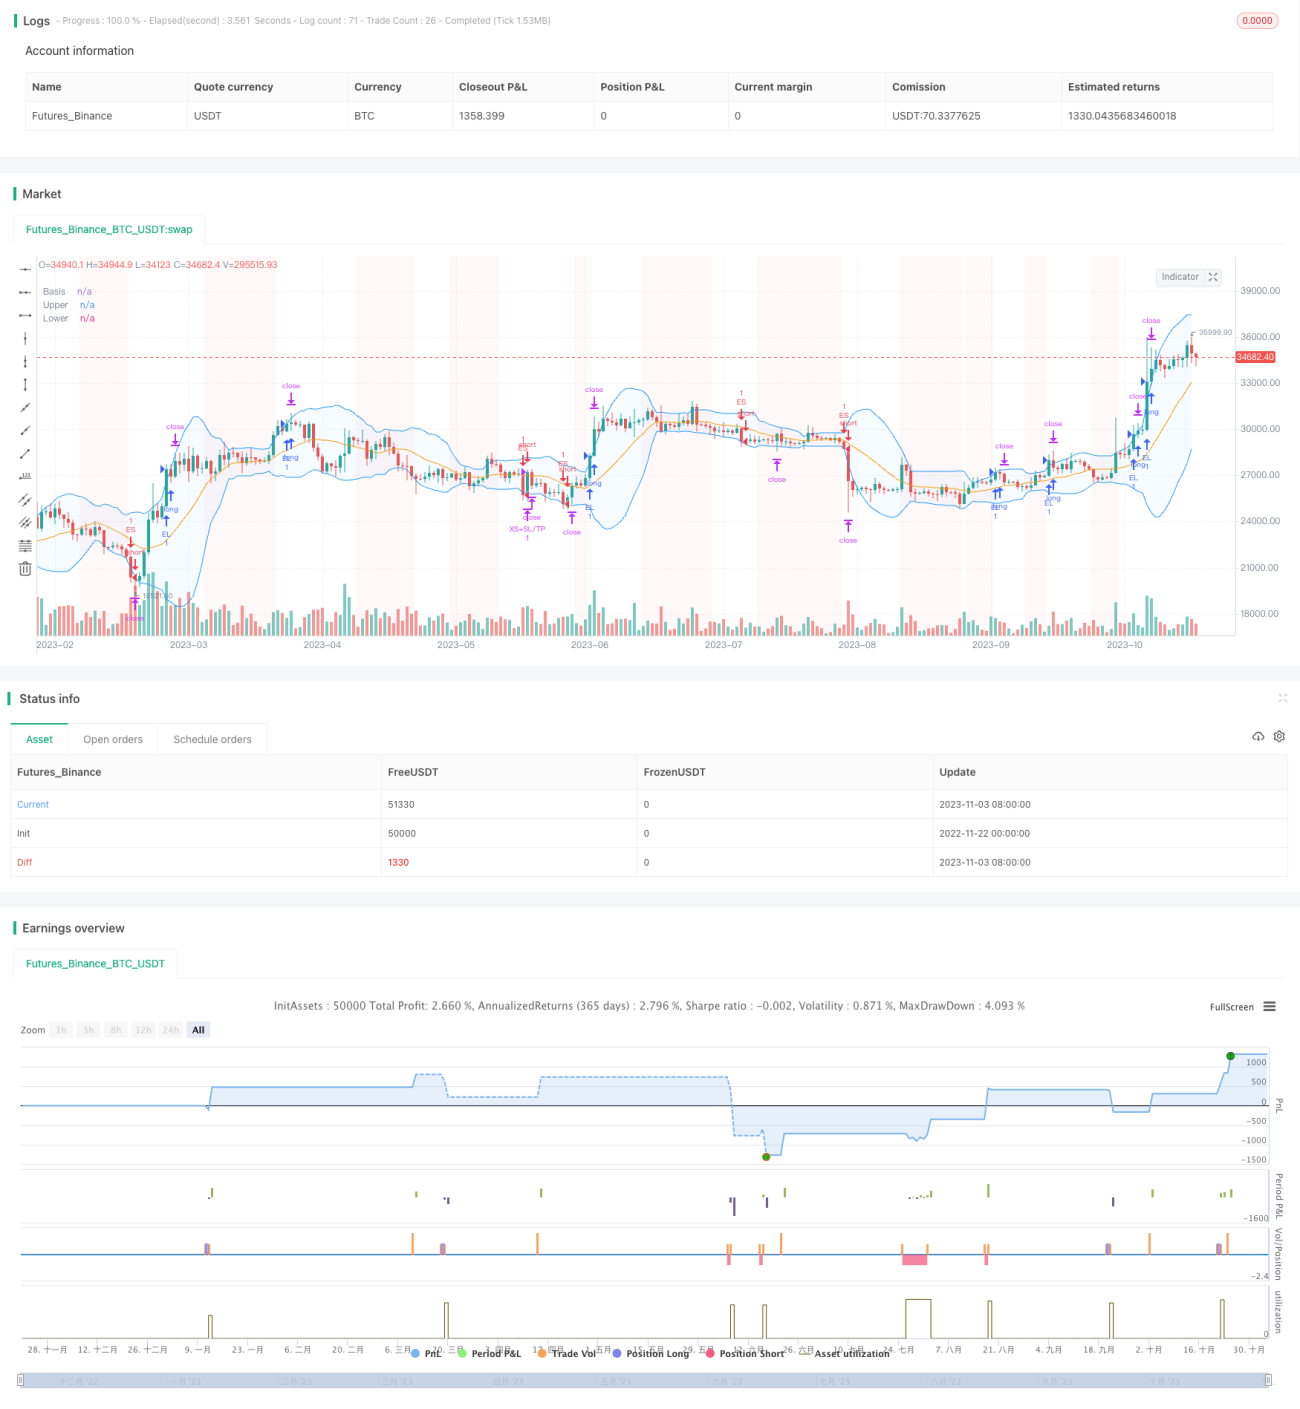
L'indicateur central de la stratégie est la bande de Brin. La bande de Brin est composée de trois lignes, la moyenne, la haute et la basse, qui représentent la moyenne des prix, les limites supérieures et inférieures des fluctuations. Lorsque le prix atteint la hauteur, faites plus; lorsque le prix atteint la basse, faites moins.
En outre, la stratégie a mis en place plusieurs filtres auxiliaires pour éviter les transactions de bruit. Ces filtres comprennent:
-
Filtre de tendance: prix en hausse au-dessus de la moyenne mobile, prix en baisse au-dessous de la moyenne mobile;
-
Filtre de volatilité: négociez uniquement lorsque la volatilité augmente.
-
Filtre d'orientation des transactions: selon les attributs de l'indicateur, choisissez de négocier en plus, en moins ou dans les deux sens;
-
Filtre de taux de variation: le prix est entré lorsque le taux de variation atteint un certain niveau par rapport au prix de clôture du jour de négociation précédent;
-
Filtre de date: paramètre de l'intervalle de temps utilisé pour le retour.
Les signaux de transaction sont générés lorsque toutes les conditions de filtrage sont remplies. La gestion des risques est assurée par le blocage, l'arrêt et le suivi des pertes. De plus, le paramètre de perte maximale en une journée évite les retraits massifs en une journée.
Analyse des avantages
Cette stratégie présente les avantages suivants:
-
L'utilisation de la BRI comme signal de trading central est très fiable.
-
La conception des filtres multiples est configurable pour éviter les erreurs de transaction.
-
La prévention, la réparation et le suivi des dommages sont complets et flexibles.
-
Le réglage de la perte journalière maximale permet de contrôler efficacement le retrait en une journée.
-
Le marché est en tendance et le potentiel de revenus est élevé.
Analyse des risques
Cette stratégie comporte aussi des risques:
-
La rupture de la ceinture de Brin est sujette à la formation de fausses ruptures de la tête et de la base, ce qui peut entraîner des dommages.
-
Les filtres peuvent être trop stricts et manquer des opportunités de négociation lors de la correction des marchés.
-
Des sauts de grande ampleur peuvent entraîner des pertes directes au-delà de la ligne de freinage;
-
Dans des cas extrêmes, il est impossible d'éviter des pertes massives.
Pour répondre à ces risques, il est possible d'assouplir les conditions de filtrage ou d'intervenir manuellement pour fermer certaines positions, réduire la distance d'arrêt des pertes, etc.
Direction d'optimisation
Cette stratégie peut être optimisée dans les domaines suivants:
-
L'objectif est de créer un espace entre les paramètres de la base de données et d'essayer différentes combinaisons.
-
L'ajout de modèles d'apprentissage automatique permettant l'optimisation dynamique des paramètres;
-
La recherche de méthodes plus efficaces pour arrêter les pertes, telles que l'arrêt du temps et de l'amplitude;
-
L'intervention active dans les situations extrêmes, combinée à des indicateurs émotionnels;
-
Le arbitrage statistique est effectué en combinaison avec les produits concernés.
Résumer
La stratégie de rupture de la ceinture de Brin est une stratégie de suivi de courte ligne de tendance bien établie et fiable. Elle utilise l'indicateur de la ceinture de Brin comme signal et dispose de plusieurs filtres pour assurer la fiabilité du signal.
- 1