Stratégie d'accumulation de rebonds à moyenne mobile
Aperçu
La stratégie de récupération de rebond de la ligne de parité est une stratégie qui combine à la fois les indicateurs techniques et la forme du prix, et effectue plusieurs manœuvres de prise de position sur les points de résistance de soutien. Cette stratégie utilise l’indicateur de la ligne de parité pour identifier la direction de la tendance du marché, l’indicateur de forme basé sur les extrêmes de prix aide à déterminer les points de retournement, combiné avec les hauts et les bas de la période précédente pour déterminer les positions clés de soutien et de résistance.
Principe de stratégie
La stratégie consiste principalement à déterminer le moment de l’opération en suivant les étapes suivantes:
L’utilisation de l’indicateur Alligator triangulaire pour déterminer la direction de la tendance. Lorsque la ligne de prix franchit les lignes labiales de l’indicateur, un signal de rupture plus fort est considéré.
L’indicateur utilise le modèle de pointe pour identifier le moment où le prix est inversé dans la zone de survente. La rupture de la pointe de pointe dans une direction donnée est considérée comme un signal de revers possible.
Le point d’entrée spécifique de l’opération de retournement est déterminé en combinant les niveaux de support et de résistance. Une position est ouverte avec un plus grand short lorsque le prix est proche du support ou de la résistance précédent.
L’utilisation de l’indicateur de la ligne moyenne de l’EMA aide à déterminer la direction de la tendance à long terme. Par exemple, dans les situations de choc, l’opération à court terme est dominée par un renversement de saut en l’air, tandis que dans les situations de tendance, elle est dominée par une manœuvre de tendance.
La méthode de stop-loss mobile est utilisée pour contrôler les pertes individuelles.
Avantages stratégiques
Cette stratégie présente les avantages suivants:
La combinaison de plusieurs signaux d’indicateurs améliore la précision des jugements.
L’utilisation d’une résistance de support clé pour effectuer un renversement est une opération à forte probabilité.
La méthode de stop-loss mobile peut limiter les pertes individuelles.
Risque stratégique
La stratégie présente également les risques suivants:
La fréquence des opérations peut être plus élevée, et il est nécessaire de surveiller le contrôle des coûts de transaction.
La défaite des points clés est le risque le plus élevé, et les pertes peuvent être plus importantes si le prix ne se retourne pas à proximité du support ou de la résistance attendus.
En cas de forte volatilité, le stop mobile peut être dépassé, ce qui entraîne une augmentation des pertes.
Orientation de l’optimisation de la stratégie
Cette stratégie peut être optimisée dans les domaines suivants:
Optimiser les pondérations de plusieurs indicateurs pour trouver la meilleure combinaison de paramètres.
L’augmentation des algorithmes d’apprentissage automatique pour aider à déterminer le taux de réussite des bits clés.
L’ajout d’indicateurs de volume de transactions permet d’éviter la prise en compte de la volatilité des prix mais du volume insuffisant.
Optimiser les modèles de stop-loss mobiles pour réduire au maximum la probabilité de stop-loss inutile tout en garantissant l’efficacité du stop-loss.
Résumer
En résumé, la stratégie de récupération de rebond de la ligne de parité est une stratégie technique typique qui utilise simultanément plusieurs indicateurs tels que la ligne de parité, la forme des prix et la résistance des supports. Elle présente les avantages d’une grande précision de jugement et d’une grande probabilité d’opération, mais nécessite également d’être attentif au risque de rupture de la rupture des points clés et de la rupture des arrêts mobiles. L’efficacité de la stratégie peut être améliorée dans une certaine mesure par l’optimisation continue des poids de plusieurs indicateurs, l’application de l’apprentissage automatique et des indicateurs de transaction.
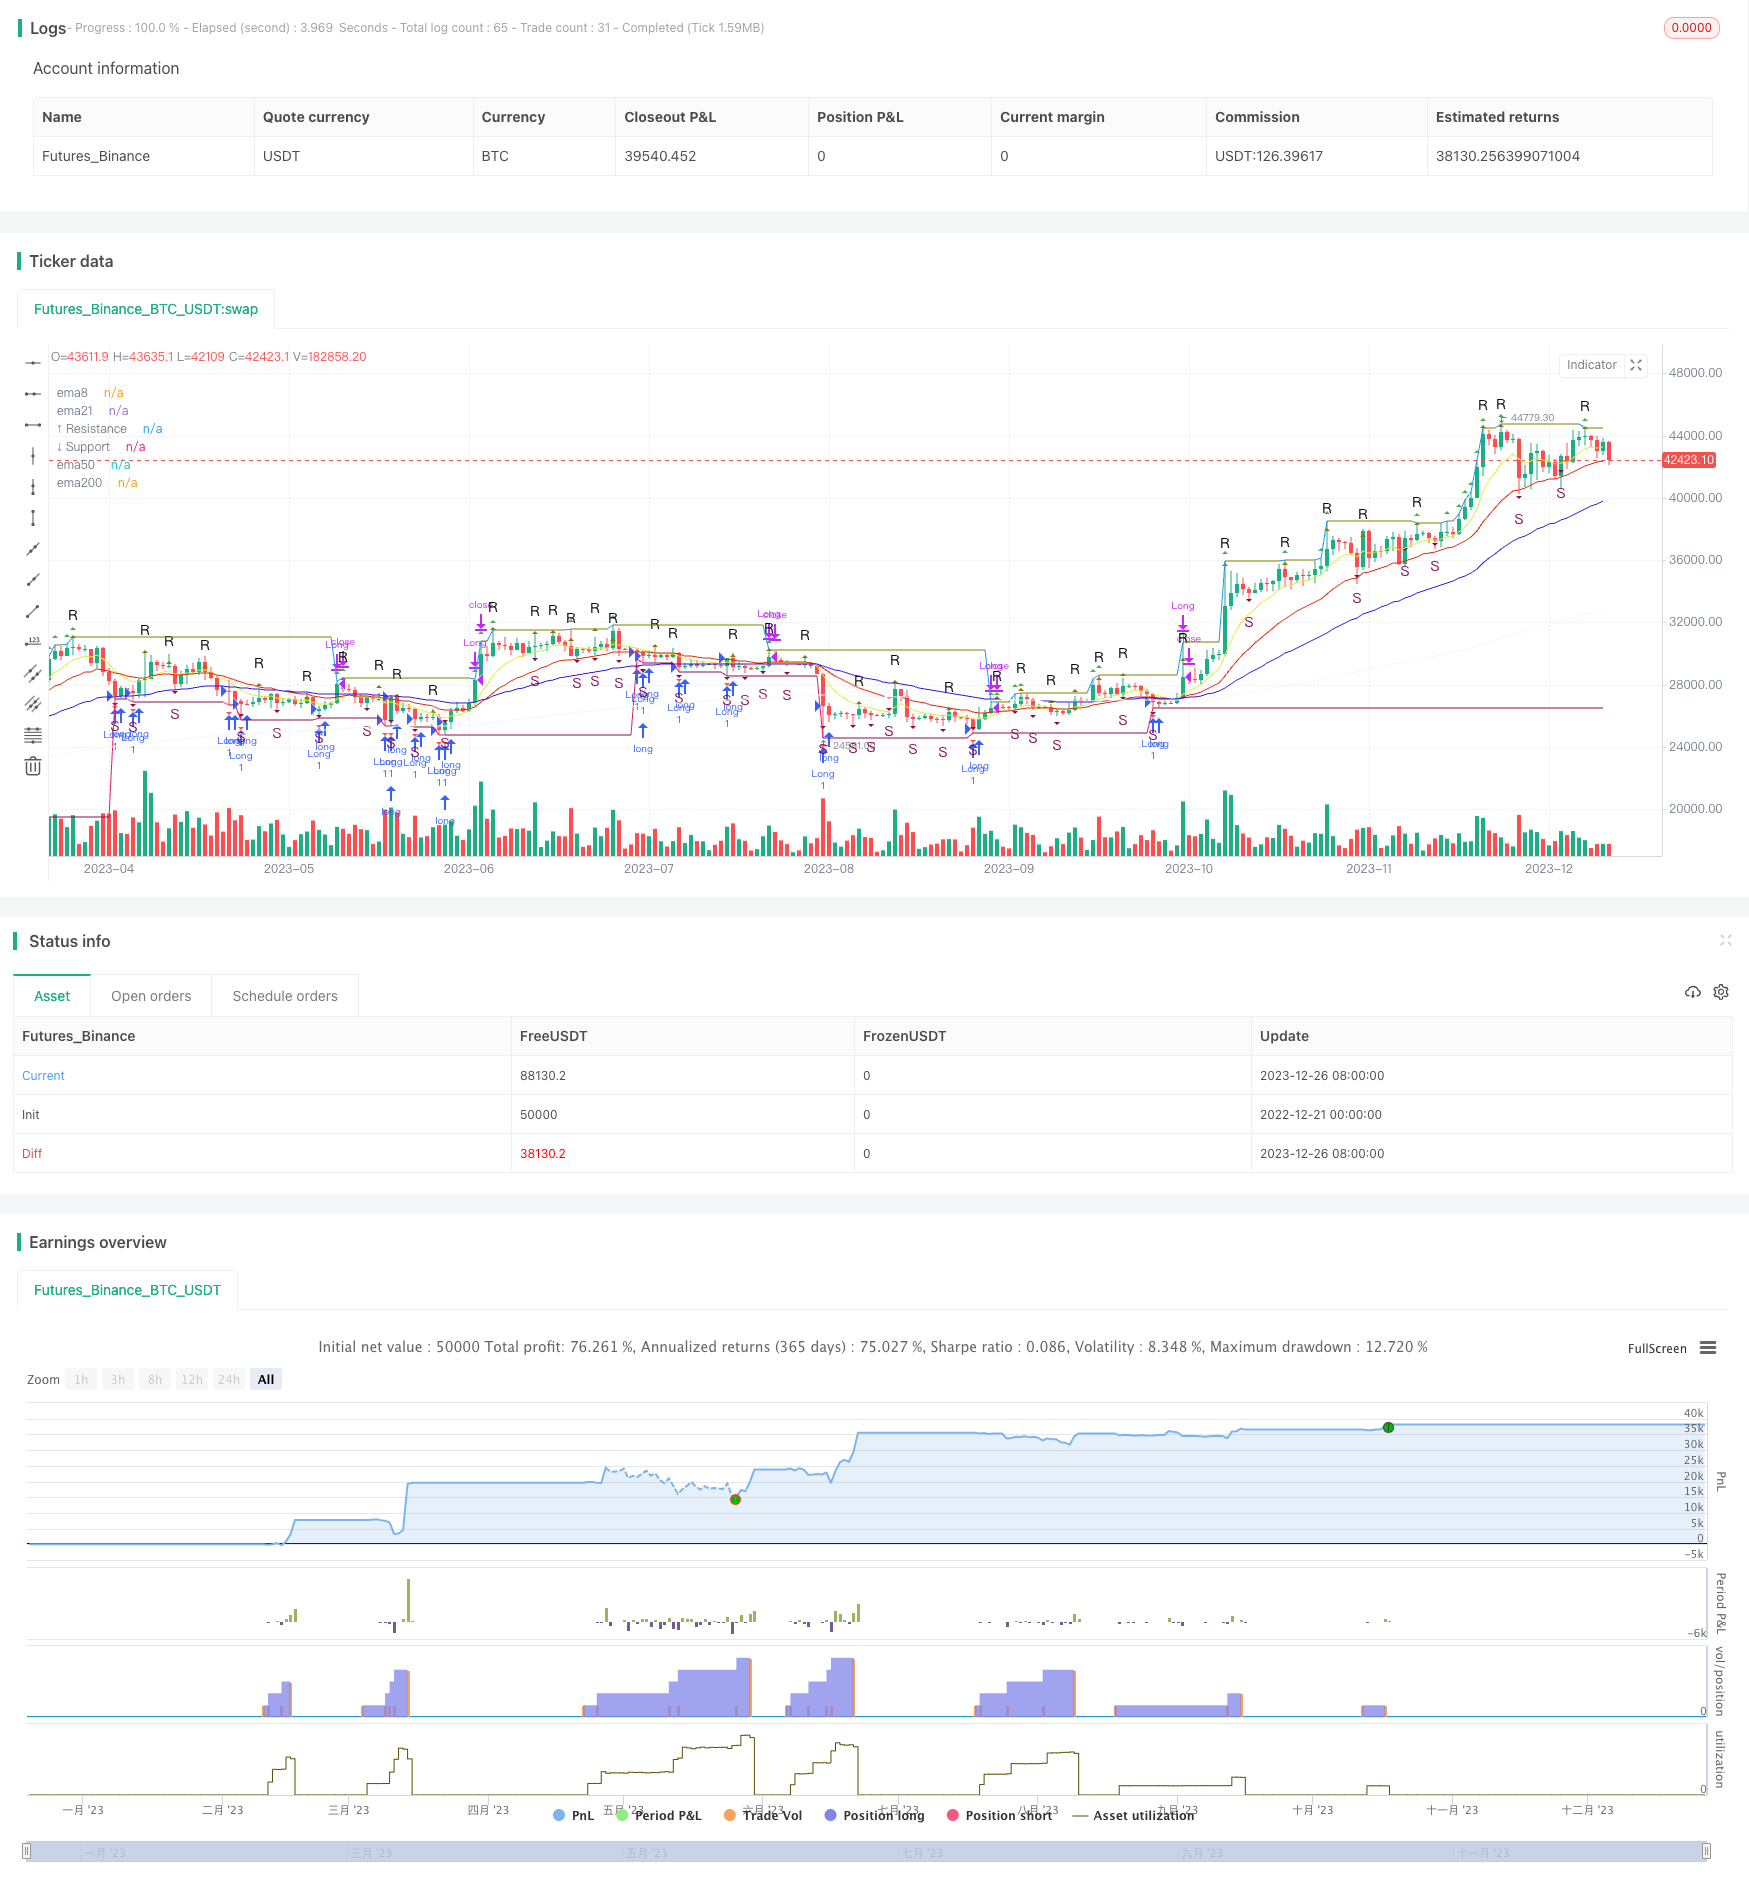
/*backtest
start: 2022-12-21 00:00:00
end: 2023-12-27 00:00:00
period: 1d
basePeriod: 1h
exchanges: [{"eid":"Futures_Binance","currency":"BTC_USDT"}]
*/

// This source code is subject to the terms of the Mozilla Public License 2.0 at https://mozilla.org/MPL/2.0/
// © vhurtadocos


//@version=5
strategy('Estrategia EMA Resistencia Soporte', shorttitle='Estrategia EMA RESISTENCIA Y SOPORTE', overlay=true, margin_long=100, margin_short=100, pyramiding = 10 )

//INICIO DE CONDICIONES BASICAS
/// Alligator
smma(src, length) =>
    smma = 0.0
    sma_1 = ta.sma(src, length)
    smma := na(smma[1]) ? sma_1 : (smma[1] * (length - 1) + src) / length
    smma
lipsLength = input(title='🐲 Lips Length', defval=5)
teethLength = input(title='🐲 Teeth Length', defval=8)
jawLength = input(title='🐲 Jaw Length', defval=13)
lipsOffset = input(title='🐲 Lips Offset', defval=3)
teethOffset = input(title='🐲 Teeth Offset', defval=5)
jawOffset = input(title='🐲 Jaw Offset', defval=8)
lips = smma(hl2, lipsLength)
teeth = smma(hl2, teethLength)
jaw = smma(hl2, jawLength)


// Fractals
n = input.int(title='📌 Period', defval=2, minval=2)
upFractal = high[n + 2] < high[n] and high[n + 1] < high[n] and high[n - 1] < high[n] and high[n - 2] < high[n] or high[n + 3] < high[n] and high[n + 2] < high[n] and high[n + 1] == high[n] and high[n - 1] < high[n] and high[n - 2] < high[n] or high[n + 4] < high[n] and high[n + 3] < high[n] and high[n + 2] == high[n] and high[n + 1] <= high[n] and high[n - 1] < high[n] and high[n - 2] < high[n] or high[n + 5] < high[n] and high[n + 4] < high[n] and high[n + 3] == high[n] and high[n + 2] == high[n] and high[n + 1] <= high[n] and high[n - 1] < high[n] and high[n - 2] < high[n] or high[n + 6] < high[n] and high[n + 5] < high[n] and high[n + 4] == high[n] and high[n + 3] <= high[n] and high[n + 2] == high[n] and high[n + 1] <= high[n] and high[n - 1] < high[n] and high[n - 2] < high[n]
dnFractal = low[n + 2] > low[n] and low[n + 1] > low[n] and low[n - 1] > low[n] and low[n - 2] > low[n] or low[n + 3] > low[n] and low[n + 2] > low[n] and low[n + 1] == low[n] and low[n - 1] > low[n] and low[n - 2] > low[n] or low[n + 4] > low[n] and low[n + 3] > low[n] and low[n + 2] == low[n] and low[n + 1] >= low[n] and low[n - 1] > low[n] and low[n - 2] > low[n] or low[n + 5] > low[n] and low[n + 4] > low[n] and low[n + 3] == low[n] and low[n + 2] == low[n] and low[n + 1] >= low[n] and low[n - 1] > low[n] and low[n - 2] > low[n] or low[n + 6] > low[n] and low[n + 5] > low[n] and low[n + 4] == low[n] and low[n + 3] >= low[n] and low[n + 2] == low[n] and low[n + 1] >= low[n] and low[n - 1] > low[n] and low[n - 2] > low[n]
plotshape(title='📌 Up-Fractal', series=upFractal, style=shape.triangleup, location=location.abovebar, offset=-2, color=color.new(color.olive, 0), text="R")
plotshape(title='📌 Down-Fractal', series=dnFractal, style=shape.triangledown, location=location.belowbar, offset=-2, color=color.new(color.maroon, 0), text="S", textcolor = color.new(color.maroon,0))

// Resistance, Support
showRS = input(title='⤒⤓ Show Res-Sup', defval=true)
lengthRS = input(title='⤒⤓ Res-Sup Length', defval=13)
highRS = ta.valuewhen(high >= ta.highest(high, lengthRS), high, 0)
lowRS = ta.valuewhen(low <= ta.lowest(low, lengthRS), low, 0)
plot(title='⤒ Resistance', series=showRS and highRS ? highRS : na, color=highRS != highRS[1] ? na : color.olive, linewidth=1, offset=0)
plot(title='⤓ Support', series=showRS and lowRS ? lowRS : na, color=lowRS != lowRS[1] ? na : color.maroon, linewidth=1, offset=0)


// EMA de 8 períodos
ema8 = ta.ema(close, 8)
plot(title='ema8', series=ema8, color=color.new(#dbef41, 0), offset=0)

// EMA de 21 períodos
ema21 = ta.ema(close, 21)
plot(title='ema21', series=ema21, color=color.new(#e12c0c, 0), offset=0)

// EMA de 50 períodos
ema50 = ta.ema(close, 50)
plot(title='ema50', series=ema50, color=color.new(#3419de, 0), offset=0)

// EMA de 200 períodos
ema200 = ta.ema(close, 200)
plot(title='ema200', series=ema200, color=color.new(#f6f6f4, 0), offset=0)


// Definiciones originales...
// ... (incluyendo tus definiciones de Alligator, Fractals, etc.)

// Guardamos el último soporte y resistencia
var float lastSupport = na
var float lastResistance = na

// Detectando un nuevo soporte y resistencia
newSupportDetected = low == lowRS


if newSupportDetected
    lastSupport := low

// Lógica de entrada y salida

// Condiciones de entrada basadas en soportes recién formados
longCondition = low == lowRS
if longCondition
    strategy.entry("Long", strategy.long)

// Salida (take profit) cuando detectamos una nueva resistencia después de entrar en una posición long
newResistanceDetected = high == highRS
if newResistanceDetected and strategy.position_size > 0
    strategy.close("Long")

// Agregar una condición para el stop loss
longStopLossPrice = close * 0.95
if strategy.position_size > 0 and close <= longStopLossPrice
    strategy.close("Long")

// Pintamos los soportes y resistencias
plotshape(longCondition, style=shape.triangledown, location=location.belowbar, color=color.red)
plotshape(newResistanceDetected, style=shape.triangleup, location=location.abovebar, color=color.green)

// Resto del código para plotear las EMAs y fractales
// ...