Stratégie pyramidale bidirectionnelle pour le trading d'actions basée sur l'indicateur RSI
Aperçu
Cet article présente principalement une stratégie de négociation d’actions à double pyramide basée sur un indicateur relativement faible ((RSI)). Cette stratégie utilise l’indicateur RSI pour déterminer les zones de survente et de survente des actions, en collaboration avec le principe de mise en position de la pyramide pour réaliser des bénéfices.
Principe de stratégie
- L’indicateur RSI est utilisé pour déterminer si une action est entrée dans une zone de survente. Un RSI inférieur à 25 est une survente et supérieur à 80 est une survente.
- Lorsque le RSI entre dans une zone de survente, commencez à faire une entrée plus élevée. Lorsque le RSI entre dans une zone de survente, commencez à faire une entrée plus courte.
- La méthode de mise en place de la pyramide est utilisée pour un maximum de 7 mises en place. Après chaque mise en place, un point d’arrêt est défini.
Analyse des avantages
- L’indicateur RSI est utilisé pour détecter les surachats et les surventeurs et pour saisir les occasions de revirements plus importants.
- La pyramide permet d’obtenir des rendements plus élevés si les conditions sont favorables.
- Pour contrôler le risque, placez un stop-loss après chaque mise en place.
Analyse des risques
- L’indicateur RSI est instable et peut donner des signaux erronés.
- Il est nécessaire de régler raisonnablement le nombre de fois que l’on met en jeu, car le risque de trop de mises en jeu augmente.
- Le paramètre de stop loss doit tenir compte de la volatilité et ne doit pas être trop petit.
Direction d’optimisation
- On peut envisager de filtrer les signaux RSI en les combinant avec d’autres indicateurs afin d’améliorer la précision de la détection des surachats. Par exemple, la combinaison d’indicateurs tels que KDJ, BOLL et autres.
- Il est possible de définir un stop-loss flottant pour suivre les prix. Il s’adapte dynamiquement en fonction de la volatilité et des exigences de contrôle du risque.
- On peut envisager d’utiliser des paramètres d’adaptation en fonction de la situation du marché (bull market, bear market, etc.).
Résumer
Cette stratégie combine l’indicateur RSI avec la stratégie de mise en position de la pyramide, permettant d’obtenir plus de bénéfices par la mise en position tout en jugeant les surachats et les survente. Bien que l’exactitude du jugement RSI soit à améliorer, une stratégie de négociation stable en termes d’effet peut être formée par une optimisation de paramètres raisonnables, combinée à d’autres indicateurs.
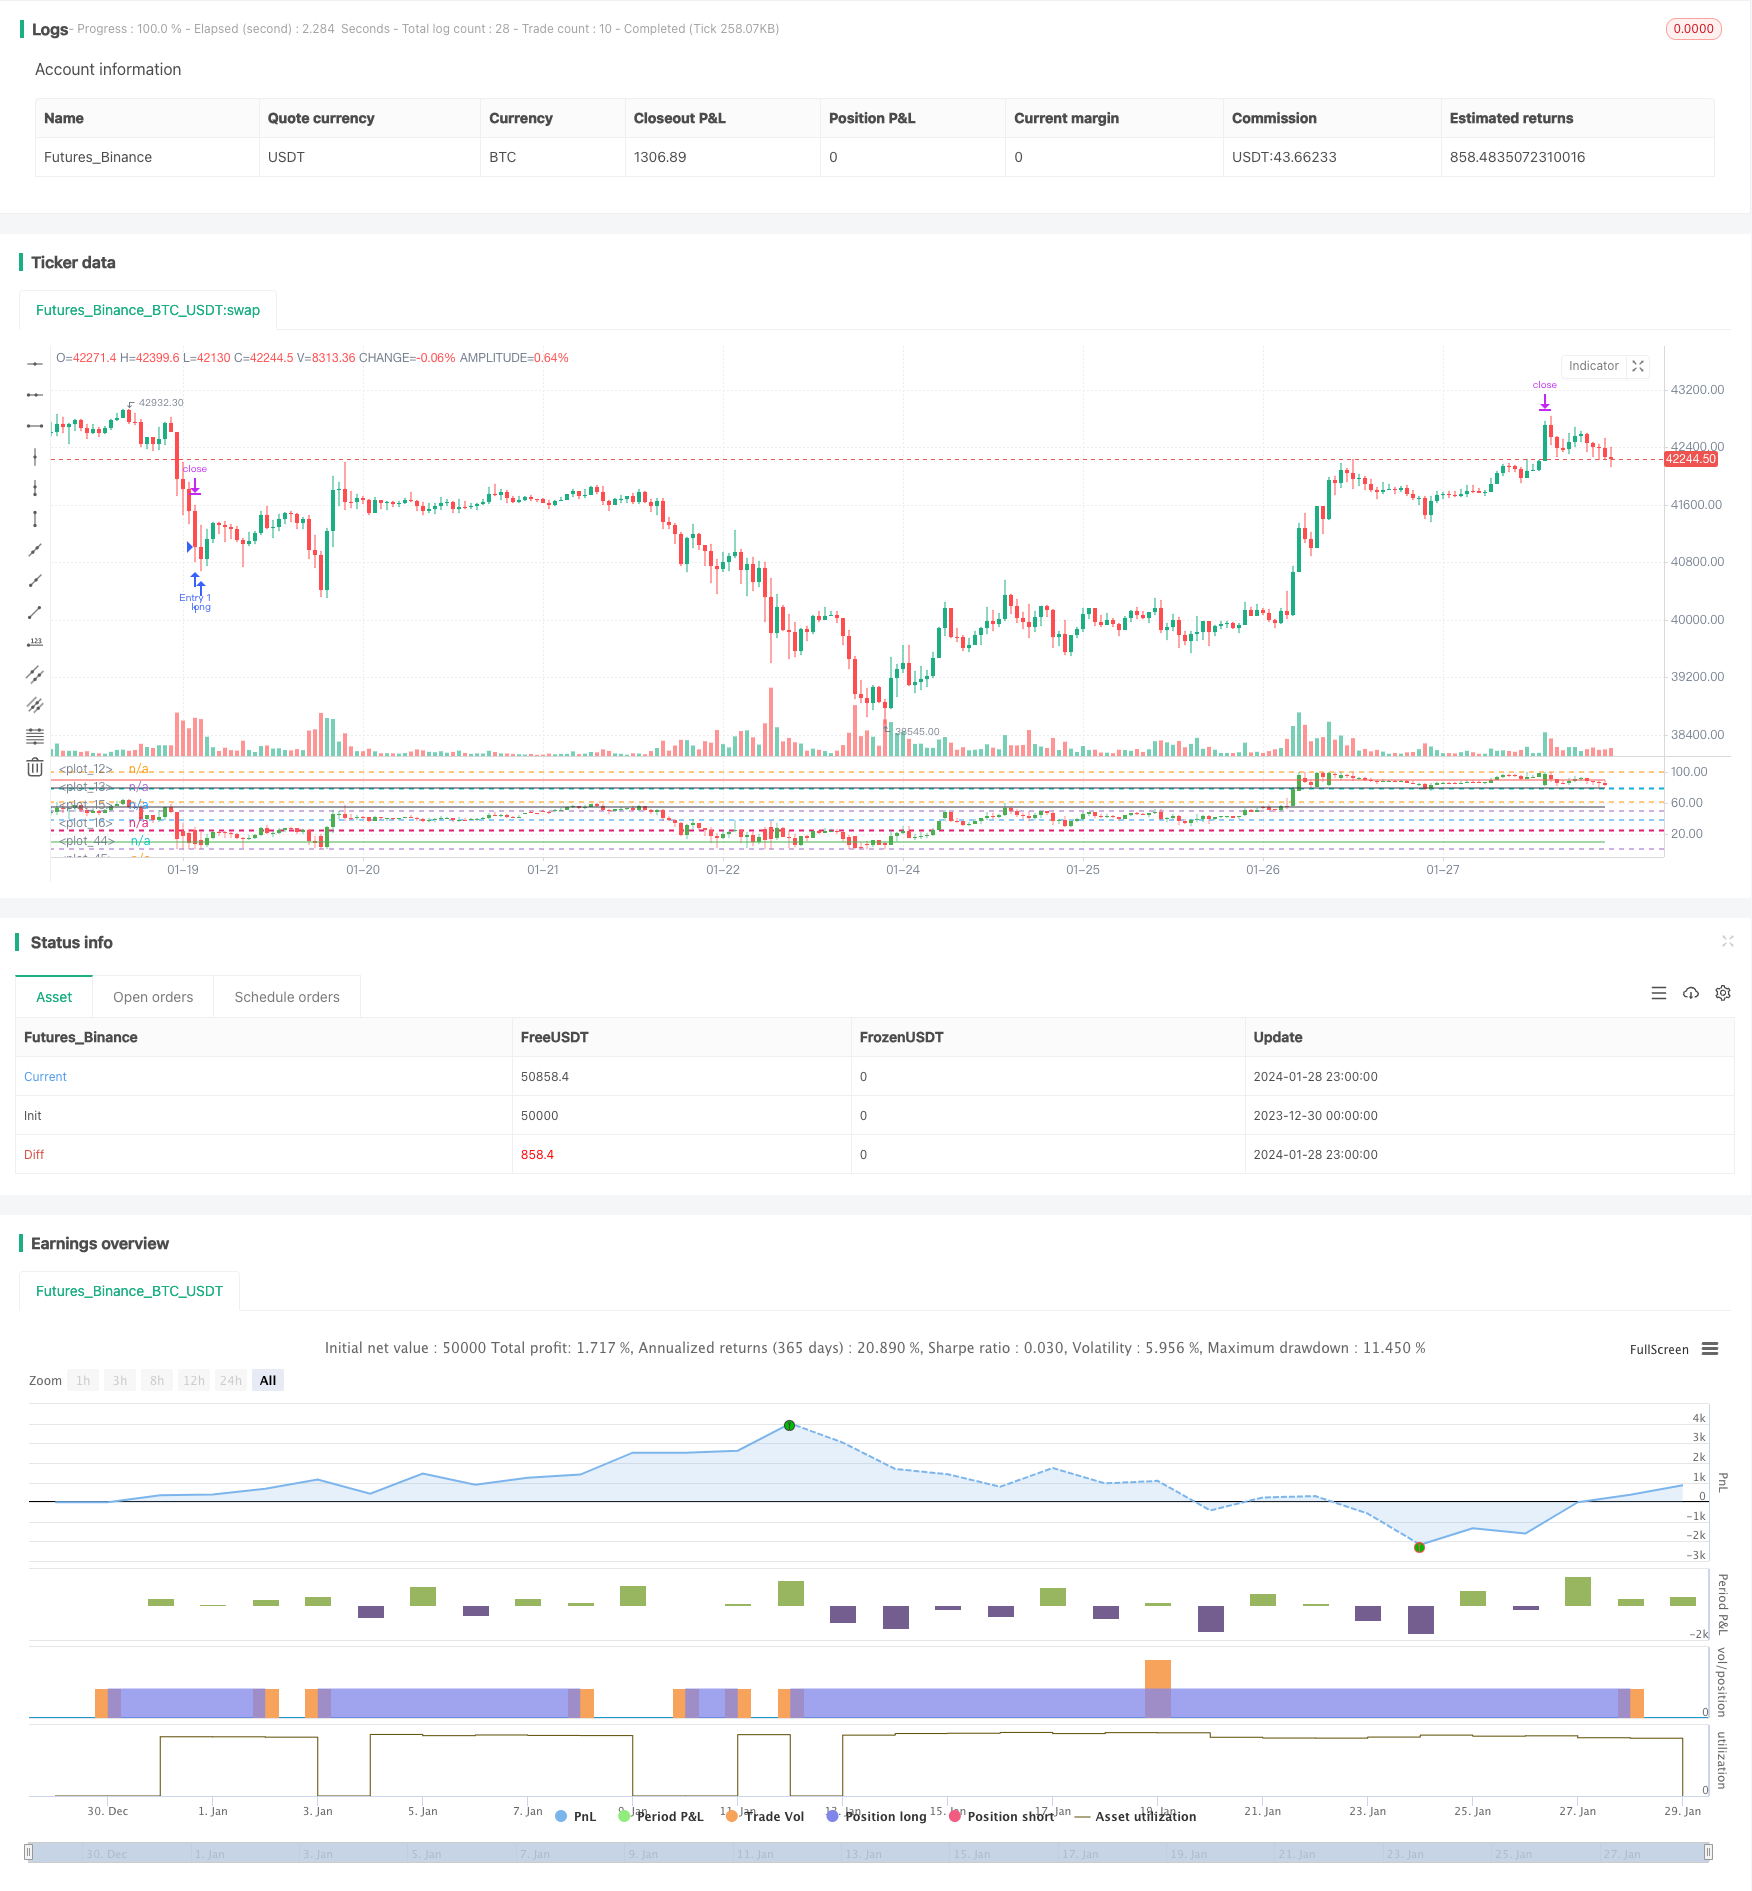
/*backtest
start: 2023-12-30 00:00:00
end: 2024-01-29 00:00:00
period: 1h
basePeriod: 15m
exchanges: [{"eid":"Futures_Binance","currency":"BTC_USDT"}]
*/

//@version=4
// This source code is subject to the terms of the Mozilla Public License 2.0 at https://mozilla.org/MPL/2.0/
// © RafaelZioni

strategy(title='Simple RSI strategy', overlay=false)

SWperiod = 1
look = 0
OverBought = input(80, minval=50)
OverSold = input(25, maxval=50)

bandmx = hline(100)
bandmn = hline(0)

band1 = hline(OverBought)
band0 = hline(OverSold)
//band50 = hline(50, color=black, linewidth=1)
fill(band1, band0, color=color.purple, transp=98)


src = close
len = input(5, minval=1, title="RSI Length")
up = rma(max(change(src), 0), len)
down = rma(-min(change(src), 0), len)
rsi = down == 0 ? 100 : up == 0 ? 0 : 100 - 100 / (1 + up / down)

p = 100

//scale
hh = highest(high, p)
ll = lowest(low, p)
scale = hh - ll

//dynamic OHLC
dyno = (open - ll) / scale * 100
dynl = (low - ll) / scale * 100
dynh = (high - ll) / scale * 100
dync = (close - ll) / scale * 100

//candle color
color_1 = close > open ? 1 : 0

//drawcandle
hline(78.6)
hline(61.8)
hline(50)
hline(38.2)
hline(23.6)
plotcandle(dyno, dynh, dynl, dync, title="Candle", color=color_1 == 1 ? color.green : color.red)
plot(10, color=color.green)
plot(55, color=color.black)
plot(80, color=color.black)
plot(90, color=color.red)

long = rsi <= OverSold ? 5 : na

//Strategy
golong = rsi <= OverSold ? 5 : na

longsignal = golong
//based on https://www.tradingview.com/script/7NNJ0sXB-Pyramiding-Entries-On-Early-Trends-by-Coinrule/
//set take profit

ProfitTarget_Percent = input(3)
Profit_Ticks = close * (ProfitTarget_Percent / 100) / syminfo.mintick

//set take profit

LossTarget_Percent = input(10)
Loss_Ticks = close * (LossTarget_Percent / 100) / syminfo.mintick


//Order Placing

strategy.entry("Entry 1", strategy.long, when=strategy.opentrades == 0 and longsignal)

strategy.entry("Entry 2", strategy.long, when=strategy.opentrades == 1 and longsignal)

strategy.entry("Entry 3", strategy.long, when=strategy.opentrades == 2 and longsignal)

strategy.entry("Entry 4", strategy.long, when=strategy.opentrades == 3 and longsignal)

strategy.entry("Entry 5", strategy.long, when=strategy.opentrades == 4 and longsignal)

strategy.entry("Entry 6", strategy.long, when=strategy.opentrades == 5 and longsignal)

strategy.entry("Entry 7", strategy.long, when=strategy.opentrades == 6 and longsignal)


if strategy.position_size > 0
    strategy.exit(id="Exit 1", from_entry="Entry 1", profit=Profit_Ticks, loss=Loss_Ticks)
    strategy.exit(id="Exit 2", from_entry="Entry 2", profit=Profit_Ticks, loss=Loss_Ticks)
    strategy.exit(id="Exit 3", from_entry="Entry 3", profit=Profit_Ticks, loss=Loss_Ticks)
    strategy.exit(id="Exit 4", from_entry="Entry 4", profit=Profit_Ticks, loss=Loss_Ticks)
    strategy.exit(id="Exit 5", from_entry="Entry 5", profit=Profit_Ticks, loss=Loss_Ticks)
    strategy.exit(id="Exit 6", from_entry="Entry 6", profit=Profit_Ticks, loss=Loss_Ticks)
    strategy.exit(id="Exit 7", from_entry="Entry 7", profit=Profit_Ticks, loss=Loss_Ticks)