Stratégie de trading quantitatif à double moyenne mobile
Date de création:
2024-02-01 15:13:13
Dernière modification:
2024-02-01 15:13:13
Copier:
1
Nombre de clics:
758
1
Suivre
1751
Abonnés
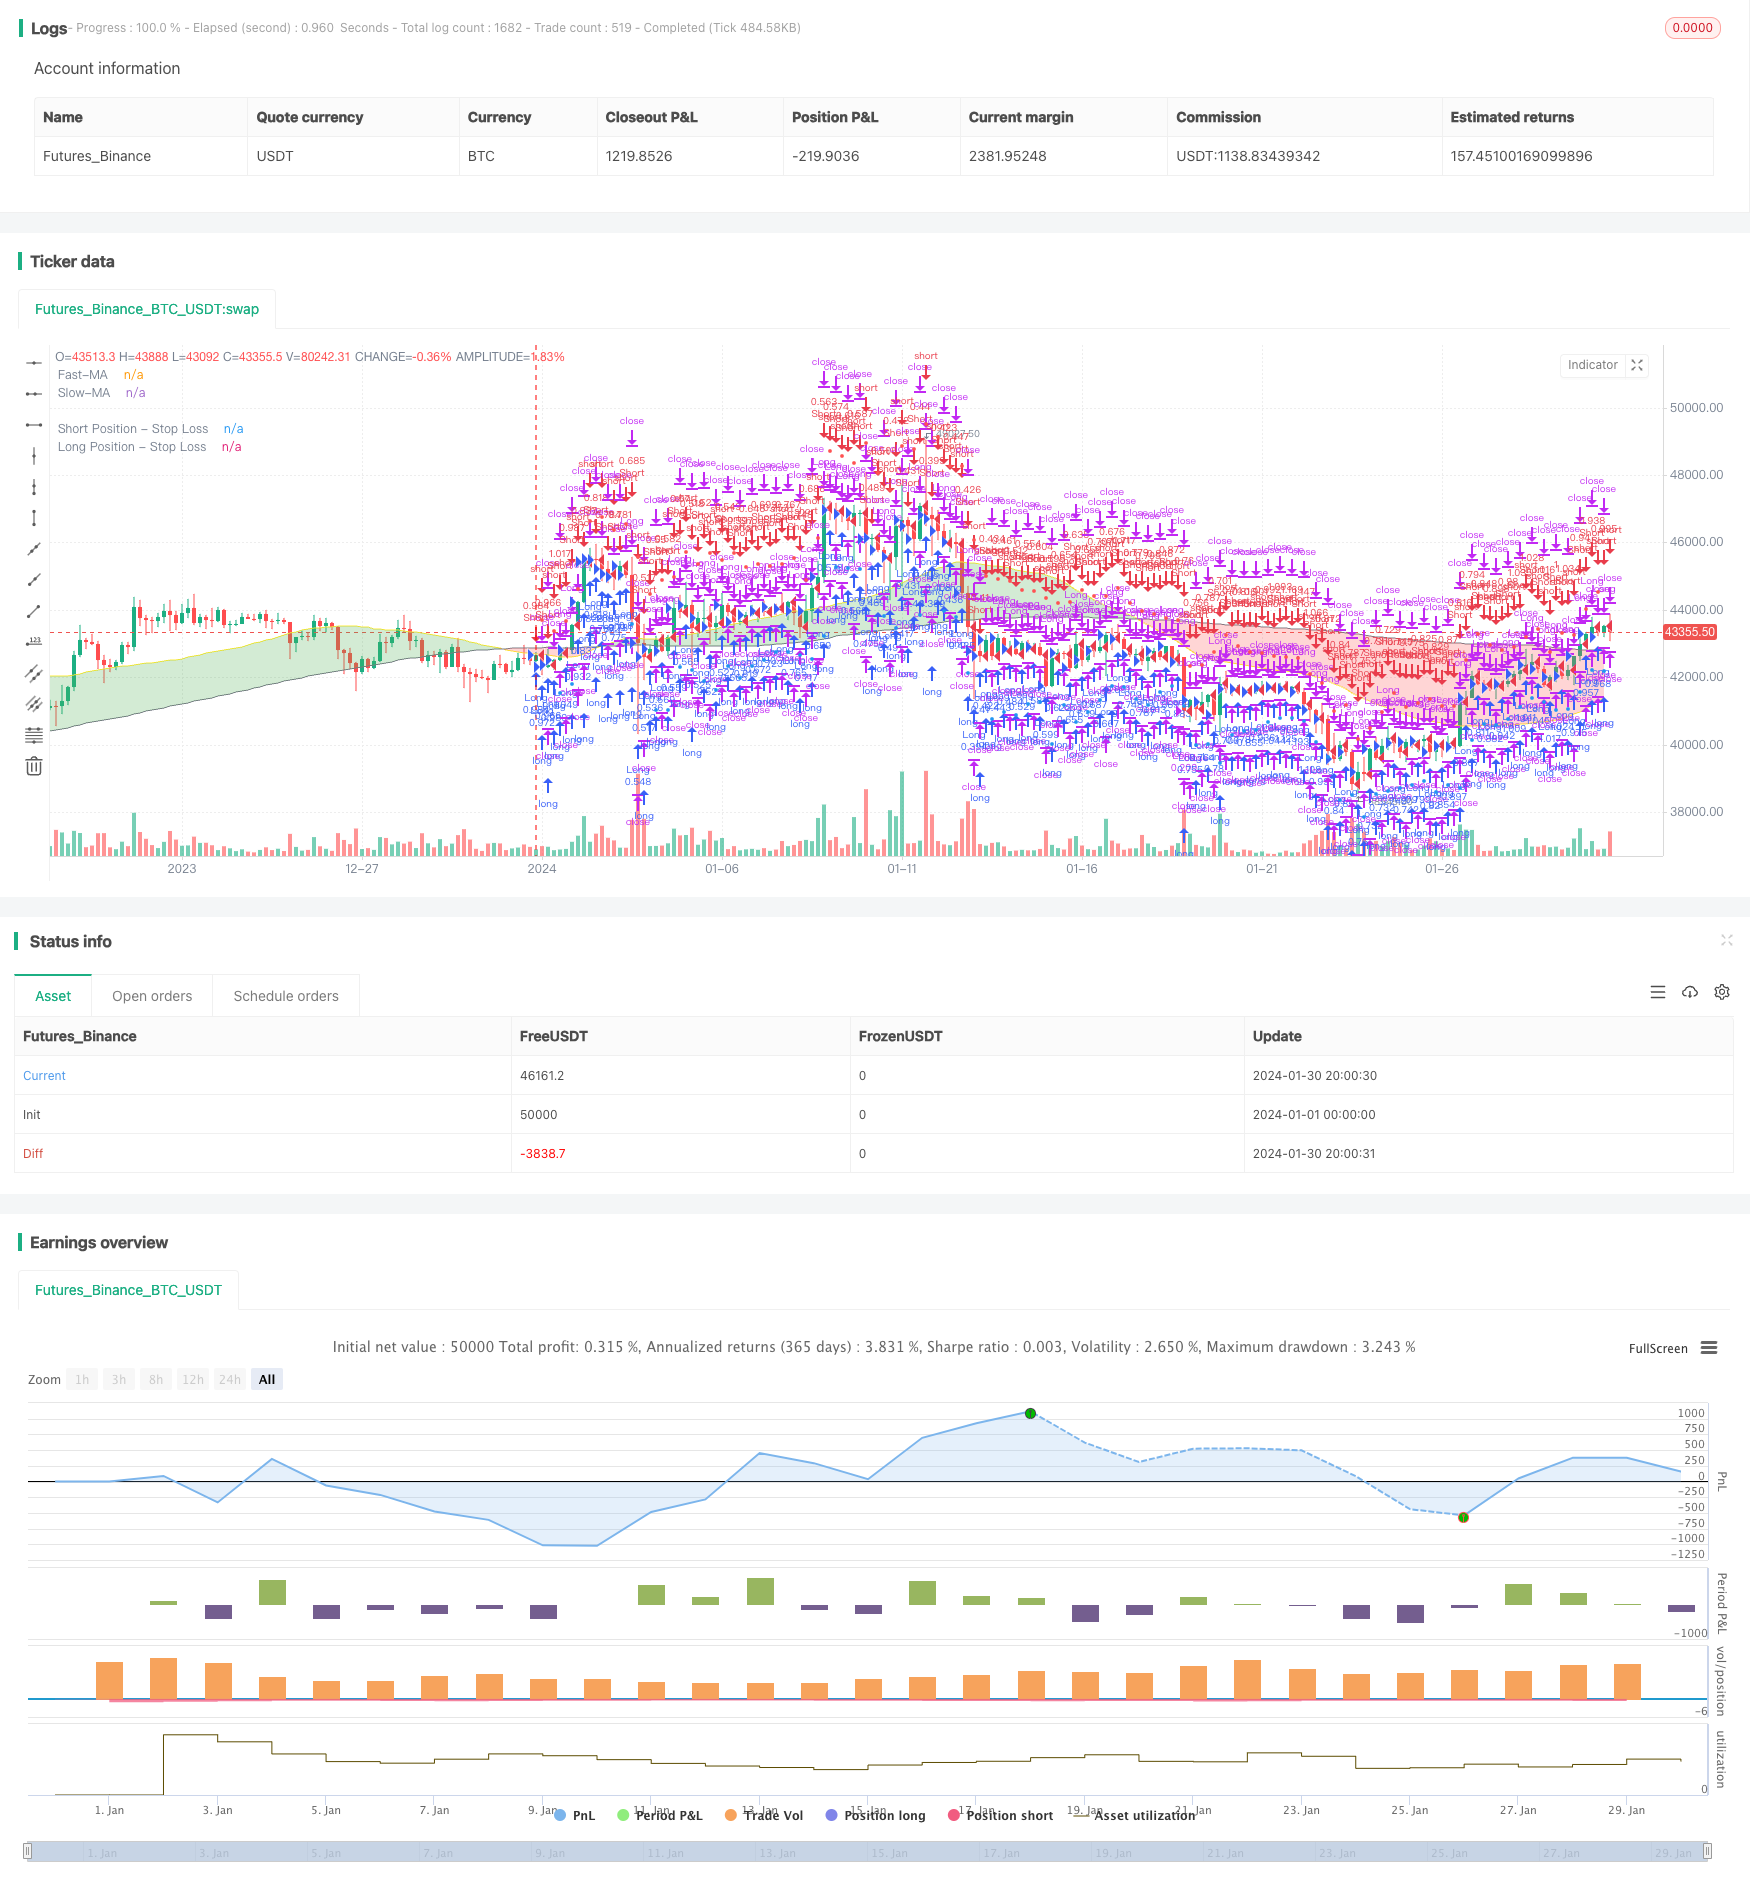
Aperçu
Cette stratégie est un type de stratégie de suivi de tendance. Elle est faite en calculant des moyennes mobiles rapides et des moyennes mobiles lentes, et en combinant l’indicateur de la parabole.
Principe de stratégie
- Calculer les moyennes mobiles rapides et les moyennes mobiles lentes. Les paramètres des moyennes mobiles sont personnalisables.
- Comparer deux moyennes mobiles pour déterminer la direction de la tendance du marché. Lorsqu’une moyenne mobile rapide traverse une moyenne mobile lente, elle est considérée comme un marché à plusieurs têtes. Lorsqu’une moyenne mobile rapide traverse une moyenne mobile lente, elle est considérée comme un marché vide.
- Un signal d’achat n’est généré que lorsque le prix de clôture sur la ligne rapide traverse la ligne lente et que le prix de clôture est supérieur à la ligne rapide; un signal de vente n’est généré que lorsque le prix de clôture sur la ligne rapide traverse la ligne lente et que le prix de clôture est inférieur à la ligne rapide.
- Les indicateurs utilisant des lignes parallèles filtrent les fausses ruptures. Un signal d’achat est finalement généré uniquement lorsque la ligne rapide traverse la ligne lente et que le prix de clôture est supérieur à la ligne rapide et que le prix de l’action est supérieur à la ligne parallèle; et vice versa.
- Le prix de l’arrêt spécifique est calculé en combinaison avec l’indicateur ATR.
Avantages stratégiques
- Utilisez les moyennes mobiles pour déterminer la direction des tendances du marché et évitez les transactions fréquentes dans des marchés de correction sans direction claire.
- Les doubles conditions de filtrage permettent d’éviter les fausses percées courantes
- Une stratégie de gestion efficace des pertes individuelles combinée à une stratégie de gestion des pertes
Risque stratégique
- Les stratégies d’indicateurs sont sujettes à de faux signaux
- Le risque monétaire n’est pas pris en compte
- Il est possible que vous ayez raté une première étape dans une direction différente
Pour répondre à ces questions, il est possible d’optimiser les éléments suivants:
- Optimisation des paramètres des moyennes mobiles pour les rendre plus adaptés aux variétés
- Le filtrage du signal peut être combiné avec d’autres indicateurs ou modèles
- Prendre en compte les risques monétaires liés à la couverture en temps réel ou à la conversion automatique d’un compte de courtier
Direction d’optimisation
- Optimiser les paramètres des moyennes mobiles pour mieux saisir les tendances
- Augmentation du portefeuille de modèles pour une meilleure précision des signaux
- Vérification à cycles multiples pour éviter d’être piégé
- Optimiser les stratégies d’arrêt des pertes et améliorer la stabilité des stratégies
Résumer
Cette stratégie est une stratégie de suivi de tendance typique des deux moyennes mobiles et des combinaisons d’indicateurs. Elle permet de juger de la tendance du marché en comparant les deux directions des moyennes mobiles plus rapidement et plus lentement. Elle est combinée à plusieurs indicateurs de filtrage pour éviter les faux signaux et ainsi générer des signaux de négociation.
Code source de la stratégie
/*backtest
start: 2024-01-01 00:00:00
end: 2024-01-31 00:00:00
period: 4h
basePeriod: 15m
exchanges: [{"eid":"Futures_Binance","currency":"BTC_USDT"}]
*/

// This source code is subject to the terms of the Mozilla Public License 2.0 at https://mozilla.org/MPL/2.0/
// © sosacur01

//@version=5
strategy(title="2 MA | Trend Following", overlay=true, pyramiding=1, commission_type=strategy.commission.percent, commission_value=0.2, initial_capital=10000)

//==========================================


//BACKTEST RANGE
useDateFilter = input.bool(true, title="Filter Date Range of Backtest",
     group="Backtest Time Period")
backtestStartDate = input(timestamp("1 jan 2000"),
     title="Start Date", group="Backtest Time Period",
     tooltip="This start date is in the time zone of the exchange " +
     "where the chart's instrument trades. It doesn't use the time " +
     "zone of the chart or of your computer.")
backtestEndDate = input(timestamp("1 Jul 2100"),
     title="End Date", group="Backtest Time Period",
     tooltip="This end date is in the time zone of the exchange " +
     "where the chart's instrument trades. It doesn't use the time " +
     "zone of the chart or of your computer.")
inTradeWindow = true
if not inTradeWindow and inTradeWindow[1]
    strategy.cancel_all()
    strategy.close_all(comment="Date Range Exit")

//--------------------------------------

//LONG/SHORT POSITION ON/OFF INPUT
LongPositions   = input.bool(title='On/Off Long Postion', defval=true, group="Long & Short Position")
ShortPositions  = input.bool(title='On/Off Short Postion', defval=true, group="Long & Short Position")

//---------------------------------------

//SLOW MA INPUTS
averageType1   = input.string(defval="SMA", group="Slow MA Inputs", title="Slow MA Type", options=["SMA", "EMA", "WMA", "HMA", "RMA", "SWMA", "ALMA", "VWMA", "VWAP"])
averageLength1 = input.int(defval=160, group="Slow MA Inputs", title="Slow MA Length", minval=50)
averageSource1 = input(close, title="Slow MA Source", group="Slow MA Inputs")


//SLOW MA TYPE
MovAvgType1(averageType1, averageSource1, averageLength1) =>
	switch str.upper(averageType1)
        "SMA"  => ta.sma(averageSource1, averageLength1)
        "EMA"  => ta.ema(averageSource1, averageLength1)
        "WMA"  => ta.wma(averageSource1, averageLength1)
        "HMA"  => ta.hma(averageSource1, averageLength1)
        "RMA"  => ta.rma(averageSource1, averageLength1)
        "SWMA" => ta.swma(averageSource1)
        "ALMA" => ta.alma(averageSource1, averageLength1, 0.85, 6)
        "VWMA" => ta.vwma(averageSource1, averageLength1)
        "VWAP" => ta.vwap(averageSource1)
        => runtime.error("Moving average type '" + averageType1 +
             "' not found!"), na


//----------------------------------

//FAST MA INPUTS
averageType2   = input.string(defval="SMA", group="Fast MA Inputs", title="Fast MA Type", options=["SMA","EMA","WMA","HMA","RMA","SWMA","ALMA","VWMA","VWAP"])
averageLength2 = input.int(defval=40, group="Fast MA Inputs", title="Fast MA Length", maxval=40)
averageSource2 = input(close, title="Fast MA Source", group="Fast MA Inputs")

//FAST MA TYPE
MovAvgType2(averageType2, averageSource2, averageLength2) =>
	switch str.upper(averageType2)
        "SMA"  => ta.sma(averageSource2, averageLength2)
        "EMA"  => ta.ema(averageSource2, averageLength2)
        "WMA"  => ta.wma(averageSource2, averageLength2)
        "HMA"  => ta.hma(averageSource2, averageLength2)
        "RMA"  => ta.rma(averageSource2, averageLength2)
        "SWMA" => ta.swma(averageSource2)
        "ALMA" => ta.alma(averageSource2, averageLength2, 0.85, 6)
        "VWMA" => ta.vwma(averageSource2, averageLength2)
        "VWAP" => ta.vwap(averageSource2)
        => runtime.error("Moving average type '" + averageType2 +
             "' not found!"), na

//---------------------------------------------------

//MA VALUES
FASTMA = MovAvgType2(averageType2, averageSource2, averageLength2)
SLOWMA = MovAvgType1(averageType1, averageSource1, averageLength1)

//BUY/SELL TRIGGERS
bullish_trend = FASTMA > SLOWMA and close > FASTMA
bearish_trend = FASTMA < SLOWMA and close < FASTMA

//MAs PLOT
plot1 = plot(SLOWMA,color=color.gray, linewidth=1, title="Slow-MA")
plot2 = plot(FASTMA,color=color.yellow, linewidth=1, title="Fast-MA")
fill(plot1, plot2, color=SLOWMA>FASTMA ? color.new(color.red, 70) : color.new(color.green, 70), title="EMA Clouds")

//-----------------------------------------------------

//PARABOLIC SAR USER INPUT
usepsarFilter = input.bool(title='Use Parabolic Sar?', defval=true, group = "Parabolic SAR Inputs")
psar_display  = input.bool(title="Display Parabolic Sar?", defval=false, group="Parabolic SAR Inputs")
start         = input.float(title="Start", defval=0.02, group="Parabolic SAR Inputs", step=0.001)
increment     = input.float(title="Increment", defval=0.02, group="Parabolic SAR Inputs", step=0.001)
maximum       = input.float(title="Maximum", defval=0.2, group="Parabolic SAR Inputs", step=0.001)

//SAR VALUES
psar        = request.security(syminfo.tickerid, "D", ta.sar(start, increment, maximum))

//BULLISH & BEARISH PSAR CONDITIONS
bullish_psar = (usepsarFilter ? low > psar : bullish_trend )
bearsish_psar = (usepsarFilter ? high < psar : bearish_trend)

//SAR PLOT
psar_plot    = if low > psar
    color.rgb(198, 234, 199, 13)
else
    color.rgb(219, 134, 134, 48)

plot(psar_display ? psar : na, color=psar_plot, title="Par SAR")

//-------------------------------------

//ENTRIES AND EXITS
long_entry  = if inTradeWindow and bullish_trend  and bullish_psar and LongPositions
    true
long_exit   = if inTradeWindow and bearish_trend
    true

short_entry = if inTradeWindow  and bearish_trend and bearsish_psar and ShortPositions
    true
short_exit  = if inTradeWindow  and bullish_trend
    true

//--------------------------------------

//RISK MANAGEMENT - SL, MONEY AT RISK, POSITION SIZING
atrPeriod                = input.int(14, "ATR Length", group="Risk Management Inputs")
sl_atr_multiplier        = input.float(title="Long Position - Stop Loss - ATR Multiplier", defval=2, group="Risk Management Inputs", step=0.5)
sl_atr_multiplier_short  = input.float(title="Short Position - Stop Loss - ATR Multiplier", defval=2, group="Risk Management Inputs", step=0.5)
i_pctStop                = input.float(2, title="% of Equity at Risk", step=.5, group="Risk Management Inputs")/100

//ATR VALUE
_atr = ta.atr(atrPeriod)

//CALCULATE LAST ENTRY PRICE
lastEntryPrice = strategy.opentrades.entry_price(strategy.opentrades - 1)

//STOP LOSS - LONG POSITIONS
var float sl = na

//CALCULTE SL WITH ATR AT ENTRY PRICE - LONG POSITION
if (strategy.position_size[1] != strategy.position_size)
    sl := lastEntryPrice - (_atr * sl_atr_multiplier)

//IN TRADE - LONG POSITIONS
inTrade = strategy.position_size > 0

//PLOT SL - LONG POSITIONS
plot(inTrade ? sl : na, color=color.blue, style=plot.style_circles, title="Long Position - Stop Loss")

//CALCULATE ORDER SIZE - LONG POSITIONS
positionSize = (strategy.equity * i_pctStop) / (_atr * sl_atr_multiplier)

//============================================================================================

//STOP LOSS - SHORT POSITIONS
var float sl_short = na

//CALCULTE SL WITH ATR AT ENTRY PRICE - SHORT POSITIONS
if (strategy.position_size[1] != strategy.position_size)
    sl_short := lastEntryPrice + (_atr * sl_atr_multiplier_short)

//IN TRADE SHORT POSITIONS
inTrade_short = strategy.position_size < 0

//PLOT SL - SHORT POSITIONS
plot(inTrade_short ? sl_short : na, color=color.red, style=plot.style_circles, title="Short Position - Stop Loss")

//CALCULATE ORDER - SHORT POSITIONS
positionSize_short = (strategy.equity * i_pctStop) / (_atr * sl_atr_multiplier_short)


//===============================================

//LONG STRATEGY
strategy.entry("Long", strategy.long, comment="Long", when = long_entry, qty=positionSize)
if (strategy.position_size > 0)
    strategy.close("Long", when = (long_exit), comment="Close Long")
    strategy.exit("Long", stop = sl, comment="Exit Long")

//SHORT STRATEGY
strategy.entry("Short", strategy.short, comment="Short", when = short_entry, qty=positionSize_short)
if (strategy.position_size < 0)
    strategy.close("Short", when = (short_exit), comment="Close Short")
    strategy.exit("Short", stop = sl_short, comment="Exit Short")

//ONE DIRECTION TRADING COMMAND (BELLOW ONLY ACTIVATE TO CORRECT BUGS)