Stratégie de trading à double moyenne mobile sur plusieurs périodes
Aperçu
Cette stratégie génère des signaux d’achat et de vente sur deux périodes différentes en calculant deux types différents de moyennes mobiles. C’est une très bonne stratégie de sandbox qui peut être utilisée pour expérimenter différents types de moyennes mobiles ainsi que différentes combinaisons de périodes.
Principe de stratégie
Cette stratégie utilise deux moyennes mobiles, une moyenne mobile rapide et une moyenne mobile lente. La période de la moyenne mobile rapide est supérieure ou égale à celle du graphique. Un signal d’achat est généré lorsque la moyenne mobile rapide monte au-dessus de la moyenne mobile lente et un signal de vente lorsque la moyenne mobile rapide descend au-dessus de la moyenne mobile lente.
Les utilisateurs peuvent choisir parmi plusieurs types de moyennes mobiles, telles que SMA, EMA, KAMA, etc. Les délais peuvent être différents, afin de trouver les meilleurs paramètres grâce à des expériences combinées.
Analyse des avantages
Le plus grand avantage de cette stratégie est qu’il est très facile d’ajuster les différentes combinaisons d’expériences paramétriques pour trouver le meilleur réglage des paramètres.
L’utilisateur est libre de choisir le type, la durée et la période de deux moyennes mobiles. Le système calcule et affiche les résultats en temps réel. C’est beaucoup plus facile que de tester une stratégie combinée avec un seul paramètre.
La stratégie a également une fonction d’arrêt-perte intégrée qui permet de réduire les risques et d’améliorer la probabilité de profit.
Analyse des risques
Le plus grand risque de cette stratégie réside dans le fait qu’une mauvaise configuration des paramètres peut entraîner des signaux de transaction trop fréquents, ce qui augmente les coûts de transaction et la perte de points de glissement.
En outre, les moyennes mobiles doubles sont elles-mêmes susceptibles de générer de faux signaux, et les signaux d’achat et de vente peuvent être peu fiables si les paramètres sont mal choisis.
Ces risques peuvent être atténués en optimisant les paramètres et en combinant d’autres indicateurs.
Direction d’optimisation
Il est possible d’envisager d’ajouter d’autres combinaisons d’indicateurs sur la base d’une moyenne mobile double, et de les filtrer, comme le RSI pour confirmer les signaux d’achat et de vente, afin de réduire les faux signaux.
On peut également essayer d’optimiser la formation des paramètres des moyennes mobiles pour trouver la meilleure combinaison de paramètres. On peut également envisager d’utiliser des méthodes d’apprentissage automatique pour optimiser dynamiquement les paramètres.
Résumer
Cette stratégie est une très bonne boîte de sable d’expérience de la moyenne mobile double. Son avantage est qu’il est possible d’incruster rapidement différentes combinaisons de paramètres pour trouver la meilleure stratégie de trading. Bien sûr, il existe également un risque de paramétrage inapproprié, ce qui nécessite un filtrage pour réduire le risque en ajoutant d’autres combinaisons d’indicateurs.
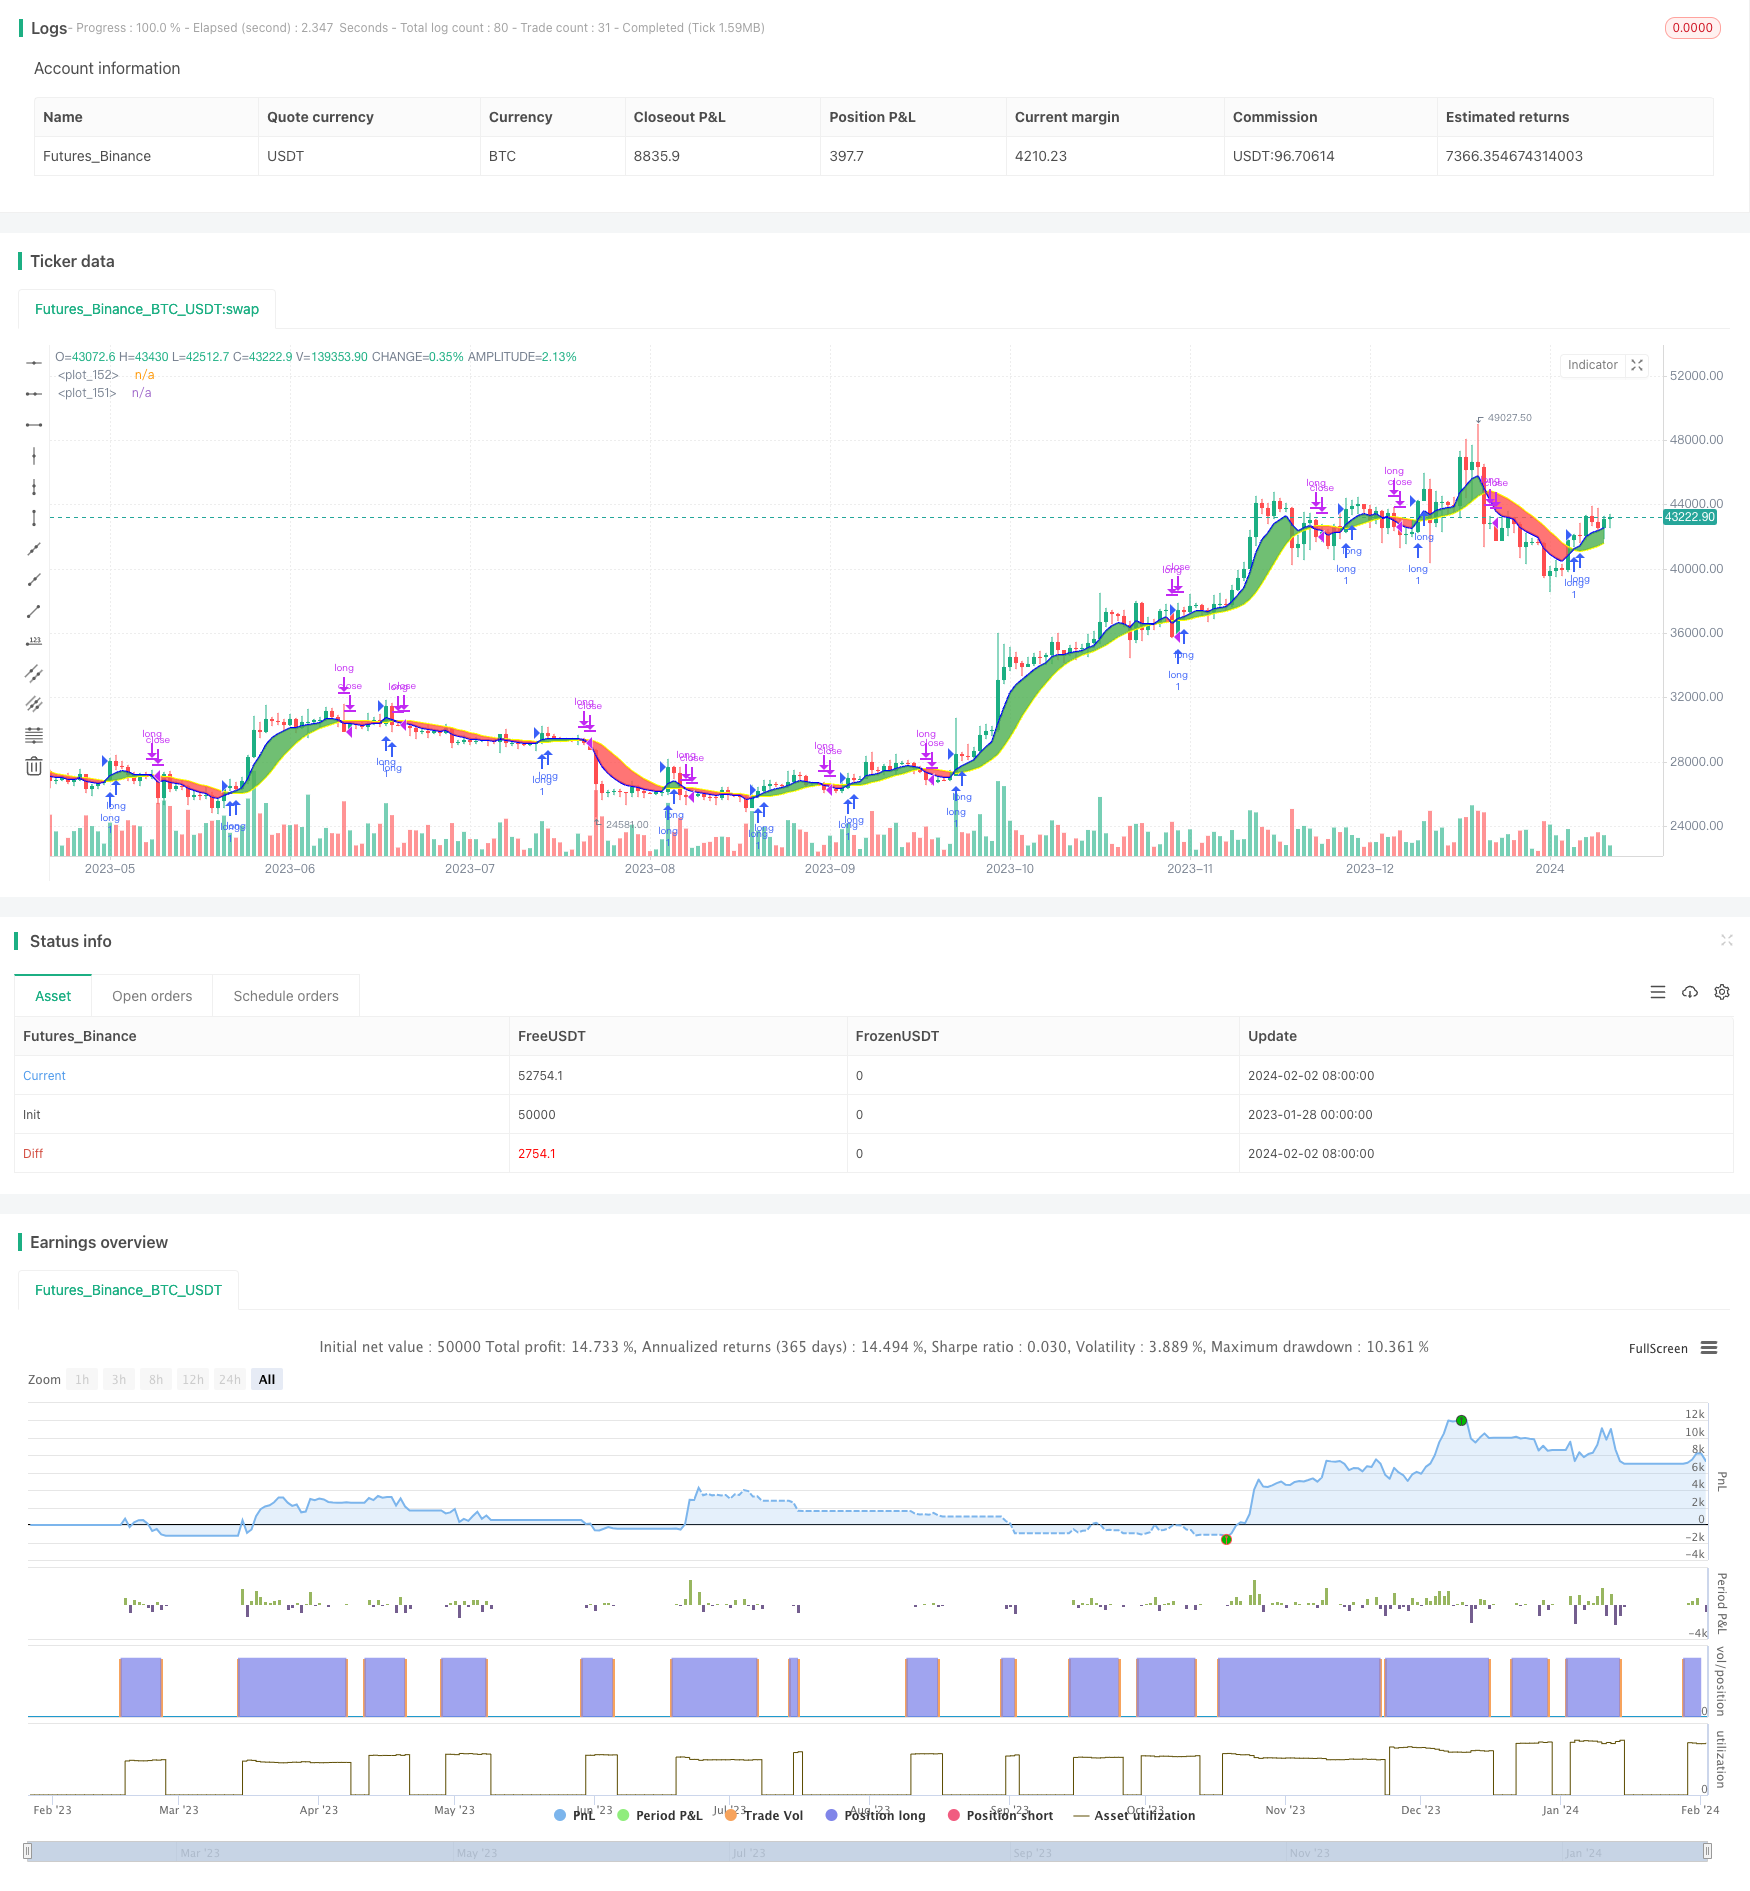
/*backtest
start: 2023-01-28 00:00:00
end: 2024-02-03 00:00:00
period: 1d
basePeriod: 1h
exchanges: [{"eid":"Futures_Binance","currency":"BTC_USDT"}]
*/

// This work is licensed under a Creative Commons Attribution-ShareAlike 4.0 International License https://creativecommons.org/licenses/by-sa/4.0/
// © dman103
// A moving averages SandBox strategy where you can experiment using two different moving averages (like KAMA, ALMA, HMA, JMA, VAMA and more) on different time frames to generate BUY and SELL signals, when they cross.
// Great sandbox for experimenting with different moving averages and different time frames.
//
// == How to use ==
// We select two types of moving averages on two different time frames:
//
// First is the FAST moving average that should be at the same time frame or higher.
// Second is the SLOW moving average that should be on the same time frame or higher.
// When FAST moving average cross over the SLOW moving average we have a BUY signal (for LONG)
// When FAST moving average cross under the SLOW moving average we have a SELL signal (for SHORT)


// WARNING: Using a lower time frame than your chart time frame will result in unrealistic results in your backtesting and bar replay.
// == NOTES ==
// You can select BOTH, LONG, SHORT or NONE in the strategy settings.
// You can also enable Stop Loss and Take Profit.
// More sandboxes to come, Follow to get notified.
// Can also act as indicator by settings 'What trades should be taken' to 'NONE'

//@version=4
strategy("Multi MA MTF SandBox Strategy","Multi MA SandBox",overlay=true)
tradeType = input("LONG", title="What trades should be taken:", options=["LONG", "SHORT", "BOTH", "NONE"])
fast_title = input(true,     title='---------------- Fast Moving Average (BLUE)----------------', type=input.bool)
ma_select1 = input(title="First Slow moving average", defval="EMA", options=["SMA", "EMA", "WMA", "HMA", "JMA", "KAMA", "TMA", "VAMA", "SMMA", "DEMA" , "VMA", "WWMA", "EMA_NO_LAG", "TSF","ALMA"])
resma_fast = input(title="First Time Frame", type=input.resolution, defval="")
lenma_fast = input(title="First MA Length", type=input.integer, defval=6)
slow_title = input(true,     title='---------------- Slow Moving Average (YELLOW)----------------', type=input.bool)
ma_select2 = input(title="Second Fast moving average", defval="JMA", options=["SMA", "EMA", "WMA", "HMA", "JMA", "KAMA", "TMA", "VAMA", "SMMA", "DEMA" , "VMA", "WWMA", "EMA_NO_LAG", "TSF","ALMA"])
resma_slow = input(title="Second time frame", type=input.resolution, defval="")
lenma_slow = input(title="Second MA length", type=input.integer, defval=14)

settings = input(true,     title='---------------- Other Settings ----------------', type=input.bool)
lineWidth = input(2,title="Line Width")
colorTransparency=input(50,title="Color Transparency",step=10,minval=0,maxval=100)
color_fast=input(color.blue,type=input.color)
color_slow=input(color.yellow,type=input.color)
fillColor = input(title="Fill Color", type=input.bool, defval=true)
IndicatorSettings = input(true,     title='---------------- Indicators Settings ----------------', type=input.bool)
offset=input(title="Alma Offset (only for ALMA)",defval=0.85, step=0.05)
volatility_lookback =input(title="Volatility lookback (only for VAMA)",defval=12)
i_fastAlpha = input(1.25,"KAMA's alpha (only for KAMA)", minval=1,step=0.25)
fastAlpha = 2.0 / (i_fastAlpha + 1)
slowAlpha = 2.0 / (31)
///////Moving Averages
MA_selector(src, length,ma_select) =>
    ma = 0.0
    if ma_select == "SMA"
        ma := sma(src, length)
        ma

    if ma_select == "EMA"
        ma := ema(src, length)
        ma

    if ma_select == "WMA"
        ma := wma(src, length)
        ma
    if ma_select == "HMA"
        ma := hma(src,length)
        ma
    if ma_select == "JMA"
        beta = 0.45*(length-1)/(0.45*(length-1)+2)
        alpha = beta
        tmp0 = 0.0, tmp1 = 0.0, tmp2 = 0.0, tmp3 = 0.0, tmp4 = 0.0
        tmp0 := (1-alpha)*src + alpha*nz(tmp0[1])
        tmp1 := (src - tmp0[0])*(1-beta) + beta*nz(tmp1[1])
        tmp2 := tmp0[0] + tmp1[0]
        tmp3 := (tmp2[0] - nz(tmp4[1]))*((1-alpha)*(1-alpha)) + (alpha*alpha)*nz(tmp3[1])
        tmp4 := nz(tmp4[1]) + tmp3[0]
        ma := tmp4
        ma
    if ma_select == "KAMA"
        momentum = abs(change(src, length))
        volatility = sum(abs(change(src)), length)
        efficiencyRatio = volatility != 0 ? momentum / volatility : 0
        smoothingConstant = pow((efficiencyRatio * (fastAlpha - slowAlpha)) + slowAlpha, 2)
        var kama = 0.0
        kama := nz(kama[1], src) + smoothingConstant * (src - nz(kama[1], src))
        ma:=kama
        ma
    if ma_select == "TMA"
        ma := sma(sma(src, ceil(length / 2)), floor(length / 2) + 1)
        ma

    if ma_select == "VMA"
        valpha=2/(length+1)
        vud1=src>src[1] ? src-src[1] : 0
        vdd1=src<src[1] ? src[1]-src : 0
        vUD=sum(vud1,9)
        vDD=sum(vdd1,9)
        vCMO=nz((vUD-vDD)/(vUD+vDD))
        VAR=0.0
        VAR:=nz(valpha*abs(vCMO)*src)+(1-valpha*abs(vCMO))*nz(VAR[1])
        ma := VAR
        ma

    if ma_select == "WWMA"
        wwalpha = 1/ length
        WWMA = 0.0
        WWMA := wwalpha*src + (1-wwalpha)*nz(WWMA[1])
        ma := WWMA
        ma

    if ma_select == "EMA_NO_LAG"
        EMA1= ema(src,length)
        EMA2= ema(EMA1,length)
        Difference= EMA1 - EMA2
        ma := EMA1 + Difference
        ma

    if ma_select == "TSF"
        lrc = linreg(src, length, 0)
        lrc1 = linreg(src,length,1)
        lrs = (lrc-lrc1)
        TSF = linreg(src, length, 0)+lrs
        ma := TSF
        ma

    if ma_select =="VAMA" // Volatility Adjusted from @fractured
        mid=ema(src,length)
        dev=src-mid
        vol_up=highest(dev,volatility_lookback)
        vol_down=lowest(dev,volatility_lookback)
        ma := mid+avg(vol_up,vol_down)
        ma
    if ma_select == "SMMA"
        smma = float (0.0)
        smaval=sma(src, length)
        smma := na(smma[1]) ? smaval : (smma[1] * (length - 1) + src) / length
        ma := smma

    if ma_select == "DEMA"
        e1 = ema(src, length)
        e2 = ema(e1, length)
        ma := 2 * e1 - e2
        ma
    if ma_select == "ALMA"
        ma := alma(src, length,offset, 6)
        ma
    ma

// Calculate EMA
ma_fast = MA_selector(close, lenma_fast,ma_select1)
ma_slow = MA_selector(close, lenma_slow,ma_select2)

maFastStep = security(syminfo.tickerid, resma_fast, ma_fast)
maSlowStep = security(syminfo.tickerid, resma_slow, ma_slow)

ma1_plot=plot(maFastStep, color=color_fast,linewidth=lineWidth,transp=colorTransparency)
ma2_plot=plot(maSlowStep, color=color_slow,linewidth=lineWidth,transp=colorTransparency)
colors=ma_fast>ma_slow ? color.green : color.red
fill(ma1_plot,ma2_plot, color=fillColor? colors: na,transp=colorTransparency+15)

closeStatus = strategy.openprofit > 0 ? "win" : "lose"
////////Long Rules
long = crossover(maFastStep,maSlowStep) and (tradeType == "LONG" or tradeType == "BOTH")
longClose =crossunder(maFastStep,maSlowStep)//and falling(maSlowStep,1)
///////Short Rules
short =crossunder(maFastStep,maSlowStep) and (tradeType == "SHORT" or tradeType == "BOTH")
shortClose =  crossover(maFastStep,maSlowStep)


longShape= crossover(maFastStep,maSlowStep) and tradeType == "NONE"
shortShape = crossunder(maFastStep,maSlowStep) and tradeType == "NONE"
plotshape(longShape, style=shape.triangleup,location=location.belowbar, color=color.lime,size=size.small)
plotshape(shortShape,style=shape.triangledown,location=location.abovebar, color=color.red,size=size.small)
// === Stop LOSS ===
useStopLoss = input(false, title='----- Add Stop Loss / Take profit -----', type=input.bool)

sl_inp = input(2.5, title='Stop Loss %', type=input.float, step=0.1)/100
tp_inp = input(5, title='Take Profit %', type=input.float, step=0.1)/100
stop_level = strategy.position_avg_price * (1 - sl_inp)
take_level = strategy.position_avg_price * (1 + tp_inp)
stop_level_short = strategy.position_avg_price * (1 + sl_inp)
take_level_short = strategy.position_avg_price * (1 - tp_inp)
if (long)
    strategy.entry("long", strategy.long)
if (short)
    strategy.entry("short", strategy.short)

strategy.close ("long", when = longClose, comment=closeStatus)
strategy.close ("short", when = shortClose, comment=closeStatus)

if (useStopLoss)
    strategy.exit("Stop Loss/Profit Long","long", stop=stop_level, limit=take_level,comment =closeStatus )
    strategy.exit("Stop Loss/Profit Short","short", stop=stop_level_short, limit=take_level_short, comment = closeStatus)