Stratégie de trading inversée Bolban Bands + RSI + ADX + ATR
Aperçu
Cette stratégie intègre plusieurs indicateurs techniques et, lorsque l’indicateur des bandes de Bourbon émet un signal de revers de prix, il juge la structure du marché en combinaison avec les indicateurs RSI, ADX et ATR et recherche des opportunités de revers à forte probabilité.
Principe de stratégie
Utilisez des bandes de bourse de 20 cycles et attendez un signal d’achat ou de vente composé d’une ligne K inversée lorsque le prix atteint la trajectoire ascendante ou descendante.
L’indicateur RSI détermine si le marché est dans la zone de choc, avec un RSI supérieur à 60 pour la zone de bullish et un RSI inférieur à 40 pour la zone de bearish.
Les ADX inférieurs à 20 indiquent que le marché est en état de choc, les ADX supérieurs à 20 indiquent que le marché est en tendance.
Réglage et suivi de l’arrêt des pertes ATR.
Il est associé au filtrage homogène EMA.
Analyse des forces stratégiques
La fusion de plusieurs indicateurs donne lieu à des signaux de trading à forte probabilité.
Les paramètres sont configurables pour s’adapter à différents environnements de marché.
Les règles d’arrêt des dommages sont strictes et les risques sont maîtrisés.
Analyse stratégique des risques
Une mauvaise configuration des paramètres peut entraîner des transactions trop fréquentes.
La probabilité d’un échec est toujours présente.
Le suivi des pertes peut ne pas fonctionner dans certains marchés.
Orientation de l’optimisation de la stratégie
Testez plus de combinaisons d’indicateurs pour trouver la configuration de paramètres la plus appropriée.
L’échec d’une percée peut être suivi d’un retour en arrière rapide.
Test de différentes façons d’arrêter les pertes pour les rendre plus intelligentes.
Résumer
La stratégie utilise les bandes de Bourbon comme signal de base, mais les indicateurs auxiliaires constituent un système de filtrage à haute probabilité et la règle de stop-loss est relativement complète. La performance de la stratégie peut encore être améliorée par l’ajustement des paramètres et l’optimisation des indicateurs.
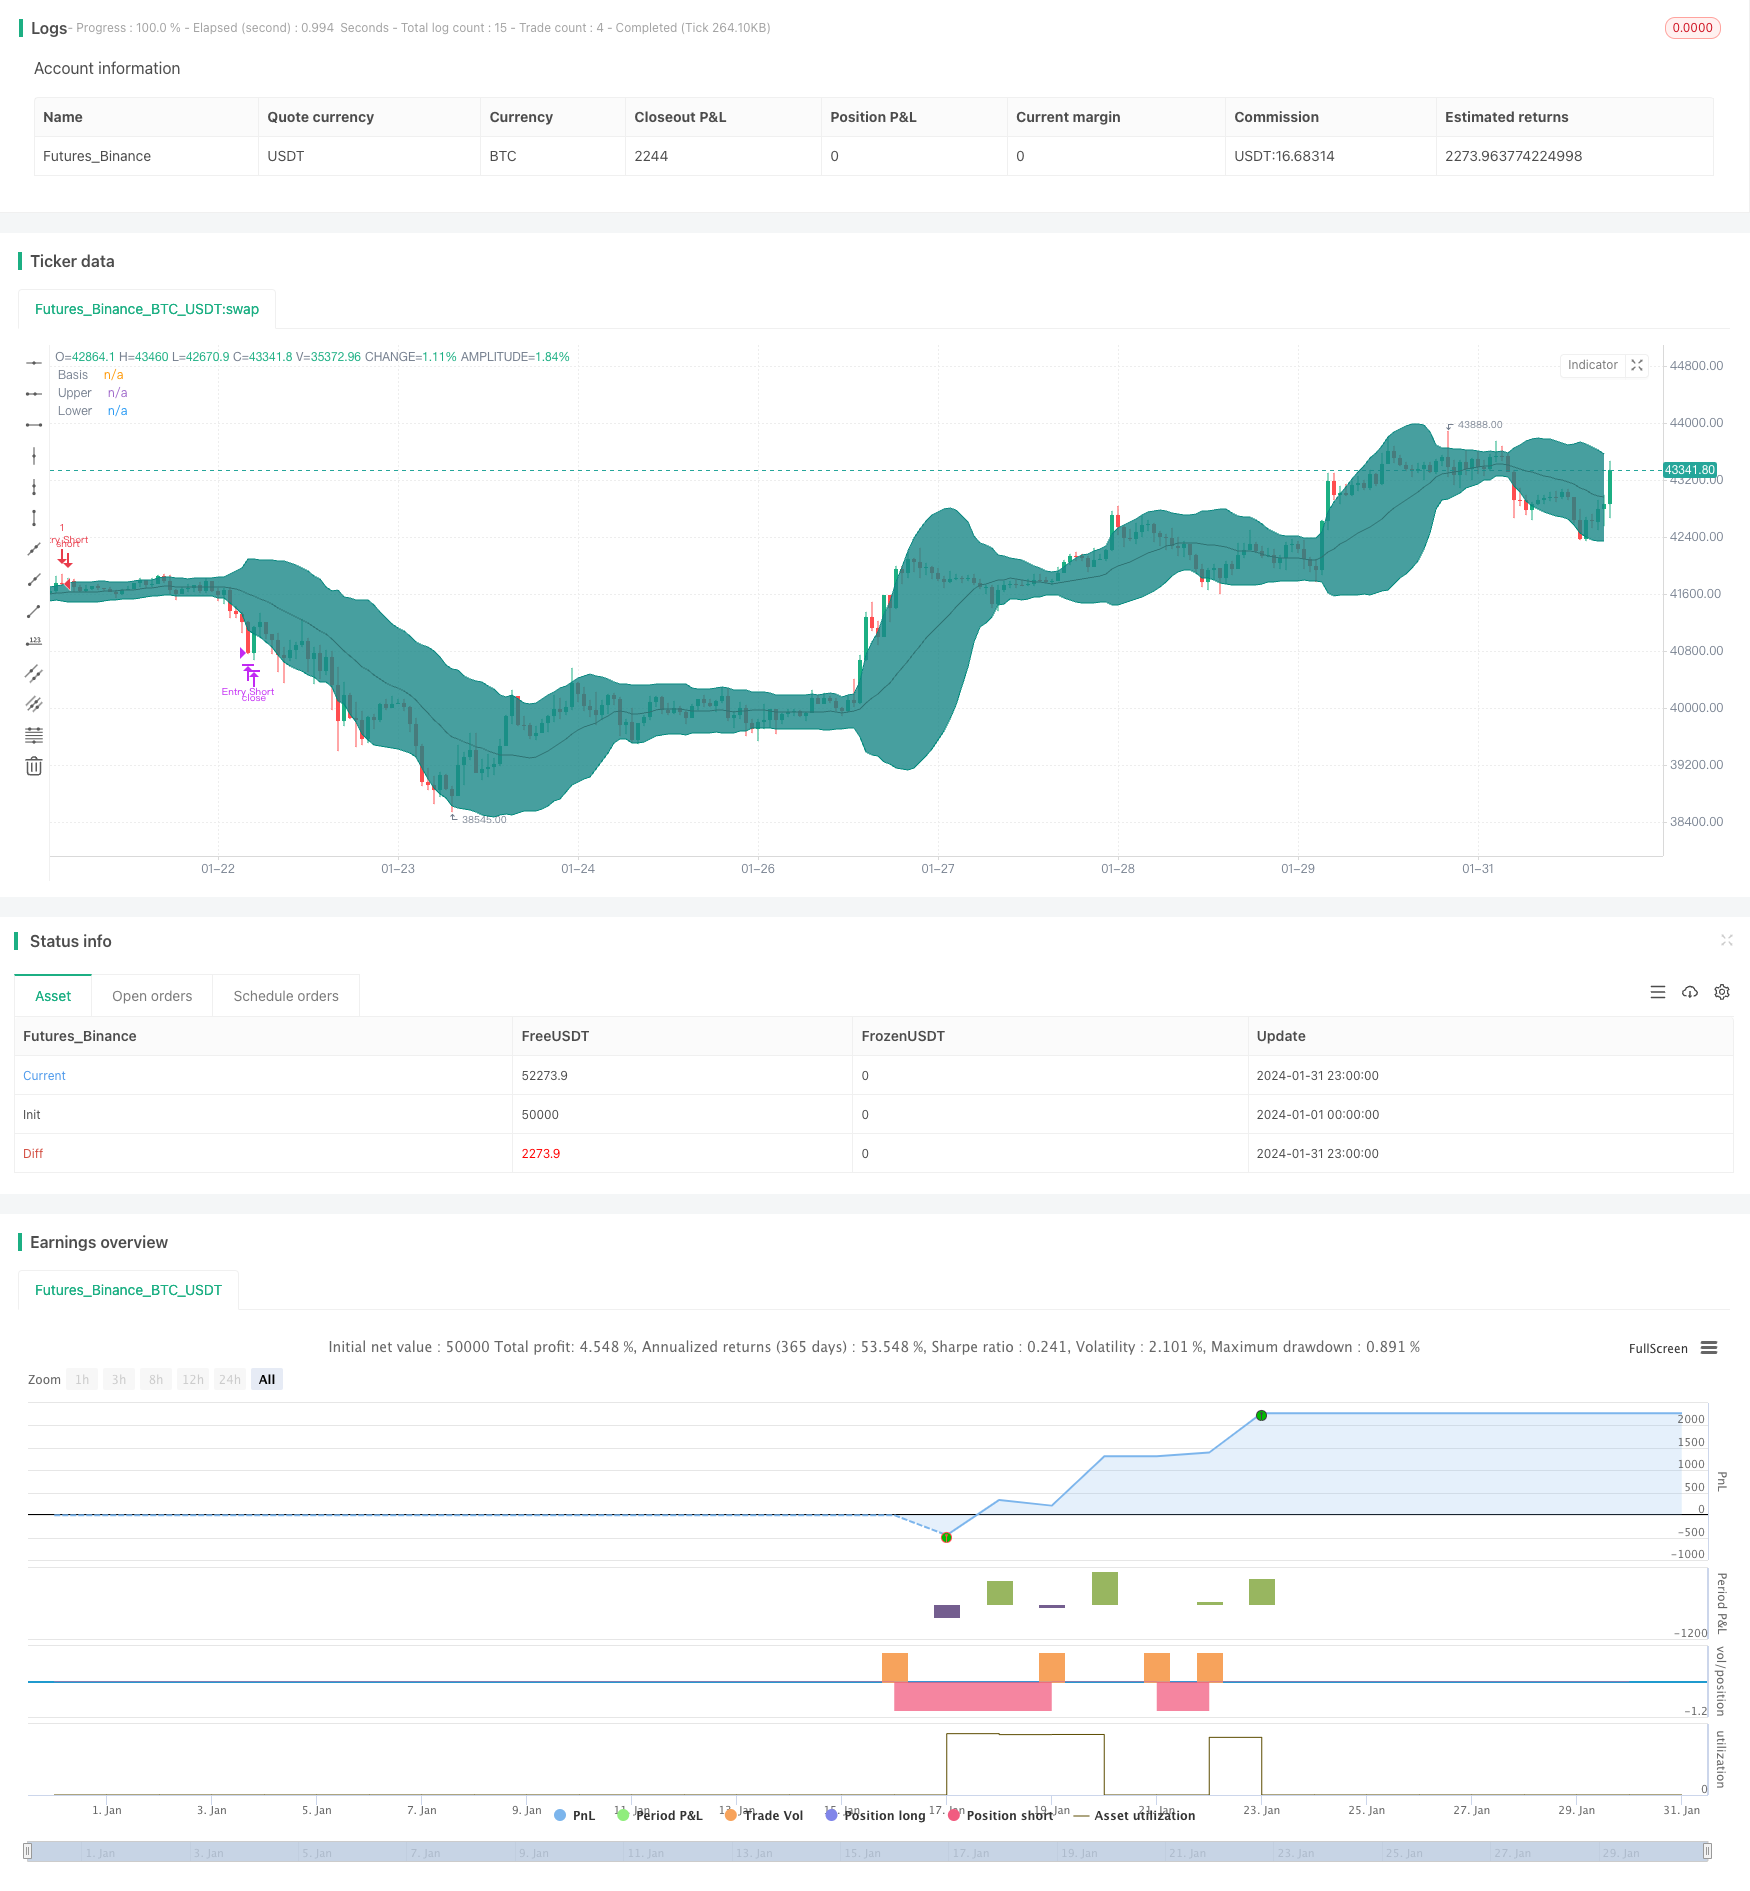
/*backtest
start: 2024-01-01 00:00:00
end: 2024-01-31 23:59:59
period: 1h
basePeriod: 15m
exchanges: [{"eid":"Futures_Binance","currency":"BTC_USDT"}]
*/

//@version=4
strategy(shorttitle="BB + EMA + RSI + ADX + ATR Reversal", title="Bollinger Bands Reversal", overlay=true)

// Inputs
ema1Input       = input(title = "EMA1 Input",                          defval = 200,   minval = 10,    maxval = 400,   step = 10,                      group = "Indicators")
ema2Input       = input(title = "EMA2 Input",                          defval = 100,   minval = 10,    maxval = 400,   step = 10,                      group = "Indicators")
length          = input(title = "BB Length",                           defval = 20,    minval=1,                                                       group = "Bollinger Band Indicator")
bbsrc           = input(title = "BB Source",                            defval = close,                                                                 group = "Bollinger Band Indicator")
mult            = input(title = "BB Standard Deviation",            type = input.float,     defval = 2.0,   minval=0.001,   maxval=50,                                      group = "Bollinger Band Indicator")
offset          = input(title = "BB Offset",                           defval = 0,     minval = -500,  maxval = 500,                                   group = "Bollinger Band Indicator")
rsilen          = input(title = "RSI Length",                          defval = 14,    minval=1,                                                       group = "RSI Indicator")
rsisrc          = input(title = "RSI Source",                           defval = close,                                                                 group = "RSI Indicator")
rsiMaxEntry     = input(title = "RSI Maximum Value",                   defval = 60,    minval = 50,    maxval = 100,                                   group = "RSI Indicator")
rsiMinEntry     = input(title = "RSI Minimum Value",                   defval = 40,    minval = 0,     maxval = 50,                                    group = "RSI Indicator")
rsiMaxExit      = input(title = "RSI Max Exit Value",                  defval = 70,    minval = 50,    maxval = 100,                                   group = "RSI Indicator")
rsiMinExit      = input(title = "RSI Min Exit Value",                  defval = 30,    minval = 0,     maxval = 50,                                    group = "RSI Indicator")
atrLength       = input(title = "ATR Length",                          defval = 14,    minval = 1,                                                     group = "ATR Indicator")
useStructure    = input(title = "Use Trailing Stop?",               type = input.bool,      defval = true,                                                                  group = "ATR Indicator")
atrlookback     = input(title = "ATR Lookback Period",                 defval = 7,     minval = 1,                                                     group = "ATR Indicator")
atrMultiplier   = input(title = "ATR Multiplier",                   type = input.float,     defval = 1.0,   minval = 0.1,                                                   group = "ATR Indicator")
sigMaxValue     = input(title = "ADX Max Value",                    type = input.float,     defval = 20.0,  minval = 0,     maxval = 100,   step = 0.1,                     group = "ADX Indicator")
adxlen          = input(title = "ADX Smoothing",                       defval = 14,                                                                    group = "ADX Indicator")
dilen           = input(title = "DI Length",                           defval = 14,                                                                    group = "ADX Indicator")

// Date input
fromMonth       = input(defval = 1,    title = "From Month",           minval = 1,     maxval = 12,    group = "Backtest Date Range")
fromDay         = input(defval = 1,    title = "From Day",             minval = 1,     maxval = 31,    group = "Backtest Date Range")
fromYear        = input(defval = 2000, title = "From Year",            minval = 1970,                  group = "Backtest Date Range")
thruMonth       = input(defval = 1,    title = "Thru Month",           minval = 1,     maxval = 12,    group = "Backtest Date Range")
thruDay         = input(defval = 1,    title = "Thru Day",             minval = 1,     maxval = 31,    group = "Backtest Date Range")
thruYear        = input(defval = 2099, title = "Thru Year",            minval = 1970,                  group = "Backtest Date Range")
inDataRange     = true

// Built in Bollinger Band
basis           = sma(bbsrc, length)
dev             = mult * stdev(bbsrc, length)
upper           = basis + dev
lower           = basis - dev
// Built in RSI
up              = rma(max(change(rsisrc), 0), rsilen)
down            = rma(-min(change(rsisrc), 0), rsilen)
rsi             = down == 0 ? 100 : up == 0 ? 0 : 100 - (100 / (1 + up / down))
// Built in ADX
dirmov(len) =>
	up = change(high)
	down = -change(low)
	plusDM = na(up) ? na : (up > down and up > 0 ? up : 0)
	minusDM = na(down) ? na : (down > up and down > 0 ? down : 0)
	truerange = rma(tr, len)
	plus = fixnan(100 * rma(plusDM, len) / truerange)
	minus = fixnan(100 * rma(minusDM, len) / truerange)
	[plus, minus]
adx(dilen, adxlen) =>
	[plus, minus] = dirmov(dilen)
	sum = plus + minus
	adx = 100 * rma(abs(plus - minus) / (sum == 0 ? 1 : sum), adxlen)
sig = adx(dilen, adxlen)

// Custom variables
ema1 = ema(close, ema1Input)
ema2 = ema(close, ema2Input)
atr = atr(atrLength)

// Entry and exit signals
CrossLongEntry  = (close <= lower or close[1] <= lower[1]) and close > open and close[1] < open[1] and close > ema1 and close > ema2 and strategy.position_size == 0 and inDataRange and rsi > rsiMinEntry and rsi < rsiMaxEntry and sig < sigMaxValue
CrossShortEntry = (close >= upper or close[1] >= upper[1]) and close < open and close[1] > open[1] and close < ema1 and close < ema2 and strategy.position_size == 0 and inDataRange and rsi > rsiMinEntry and rsi < rsiMaxEntry and sig < sigMaxValue

CrossLongExit   = (close >= upper or close[1] >= upper[1]) and close < open and close[1] > open[1] and strategy.position_size > 0 and inDataRange or rsi < rsiMinExit or rsi > rsiMaxExit
CrossShortExit  = (close <= lower or close[1] <= lower[1]) and close > open and close[1] < open[1] and strategy.position_size < 0 and inDataRange or rsi < rsiMinExit or rsi > rsiMaxExit

// Determining the stop loss based on ATR
StopLossLong    = (useStructure ? lowest(low, atrlookback) : close) - atr * atrMultiplier
StopLossShort   = (useStructure ? highest(high, atrlookback) : close) + atr * atrMultiplier

// Custom variables used to store the stoploss value
var StopLong    = 0.0
var StopShort   = 0.0
// Telling my script to store the stoploss value in the corresponding variables
if CrossLongEntry
    StopLong := StopLossLong
if CrossShortEntry
    StopShort := StopLossShort

// Strategy
strategy.entry("Entry Long", strategy.long, when = CrossLongEntry, comment = "Entry Long")
strategy.close("Entry Long", when = CrossLongExit or close < StopLong, comment = "Long Exit")

strategy.entry("Entry Short", strategy.short, when = CrossShortEntry, comment = "Entry Short")
strategy.close("Entry Short", when = CrossShortExit or close > StopShort, comment = "Short Exit")

// Plots the Bollinger Band
plot(basis, "Basis", color=#872323, offset = offset)
p1 = plot(upper, "Upper", color=color.teal, offset = offset)
p2 = plot(lower, "Lower", color=color.teal, offset = offset)
fill(p1, p2, title = "Background", color=#198787, transp=95)

// Use this if you want to see the stoploss visualised, be aware though plotting these can be confusing
// plot(StopLong)
// plot(StopShort)