Stratégie de trading d'équilibre de contrôle psychologique

Aperçu
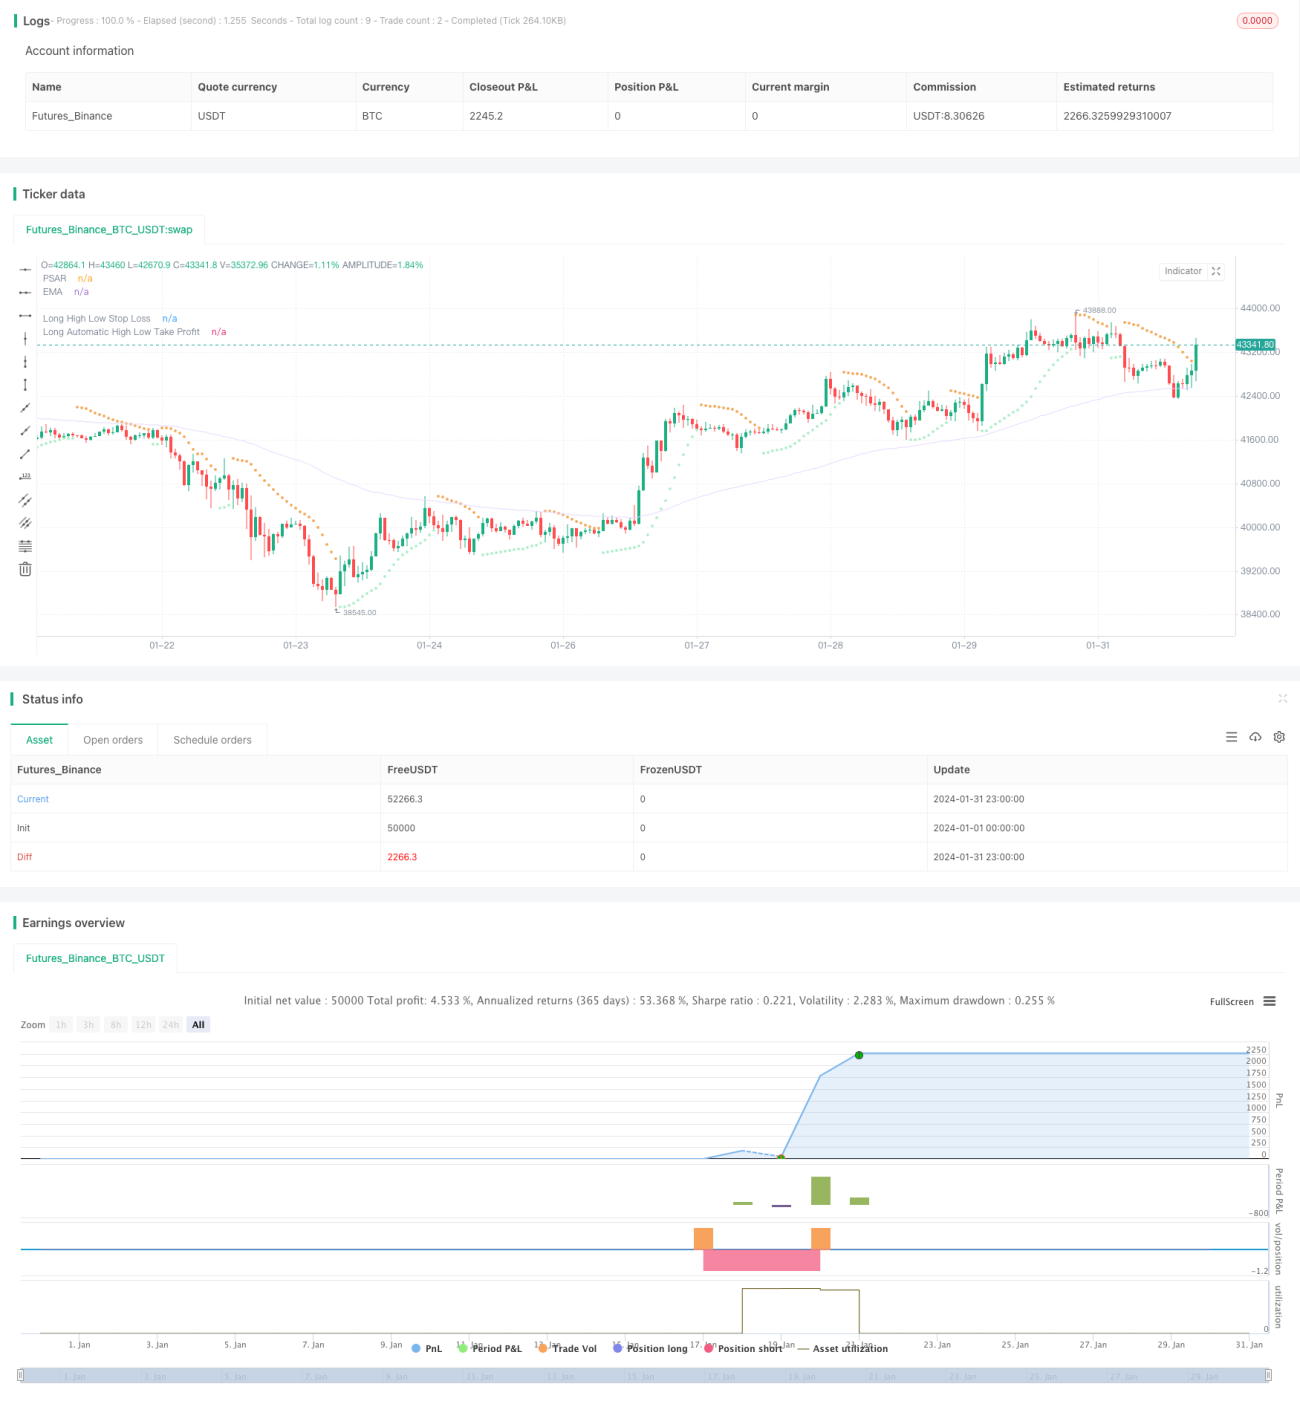
Le but de cette stratégie est d'équilibrer les performances psychologiques et commerciales des traders pour obtenir des rendements plus stables en définissant différents paramètres. Elle utilise des indicateurs tels que la ligne moyenne, les bandes de Bryn et les canaux Keltner pour déterminer la tendance et la volatilité du marché, en combinaison avec l'indicateur PSAR pour déterminer les signaux de revers, et l'indicateur d'extrusion TTM pour déterminer la dynamique.
Principe de stratégie
La logique principale de cette stratégie est la suivante:
-
Déterminez la tendance: utilisez l'EMA moyenne pour déterminer la direction de la tendance du prix, le prix est en hausse au-dessus de l'EMA et en baisse en dessous
-
Inversion de jugement: utilisez le PSAR pour déterminer les points de retournement des prix. Les points PSAR apparaissent en haut du prix comme des signaux de hausse et en bas du prix comme des signaux de baisse
-
Le TTM Squeeze mesure la volatilité en comparant la largeur des bandes de Bryn et des canaux de Keltner. L'extrusion signifie une volatilité extrêmement faible. La levée de l'extrusion signifie une volatilité accrue et un signe que le prix est sur le point de produire un mouvement directionnel plus important.
-
Génération de signaux de transaction: génération de signaux de plus-value lorsque le prix traverse la ligne moyenne EMA, le point PSAR et que l'indicateur TTM Squeeze est décompressé; génération de signaux de plus-value lorsque le prix traverse la ligne moyenne EMA, le point PSAR et que l'indicateur TTM Squeeze est entré en compression
-
La méthode de stop loss: utilisez un stop loss à haute et basse fréquence. Multipliez le multiple de la fréquence en fonction du prix le plus élevé ou le prix le plus bas du dernier cycle.
-
Mode d'arrêt: utilisation d'un arrêt automatique du ratio de risque/rendement. Le point d'arrêt est obtenu en multipliant le paramètre de rapport de risque/rendement par le rapport entre le point d'arrêt et le prix actuel.
Les paramètres permettent de contrôler la fréquence des transactions, la gestion des positions, les points d'arrêt et les points d'arrêt, l'équilibre psychologique des transactions.
Analyse des avantages
Cette stratégie présente les avantages suivants:
-
Plus d'indicateurs pour une meilleure précision des signaux
-
Réverser en priorité, en second, pour capturer les points de retournement, réduire la probabilité de frappe à hauteur et de frappe à basse altitude.
-
L'indicateur TTMSqueeze permet de juger efficacement les ajustements de tendance et d'éviter les transactions invalides pendant les périodes d'ajustement
-
La méthode de stop-loss élevé ou bas est simple et pratique, la distance de stop-loss peut être ajustée en fonction du marché
-
La méthode de compensation des risques par rapport à la compensation des pertes numérise le rapport des pertes et des gains, ce qui facilite l'ajustement
-
Les paramètres sont flexibles et peuvent être ajustés en fonction de vos préférences en matière de risques
Analyse des risques
La stratégie présente également les risques suivants:
-
La combinaison de plusieurs indicateurs a amélioré la précision du signal, mais a également augmenté la probabilité de sauter le point d'entrée
-
Les stratégies basées sur l'inversion peuvent être moins performantes dans des conditions de tendance
-
Les stop-loss élevés et bas sont parfois dépassés et ne permettent pas d'éviter complètement les risques.
-
Le risque-rendement peut aussi s'effondrer en raison d'une hausse ou d'une correction du prix.
-
Une mauvaise configuration des paramètres peut entraîner des pertes ou des pannes fréquentes
Direction d'optimisation
Cette stratégie peut être optimisée dans les domaines suivants:
-
Ajouter ou ajuster le poids de l'indicateur pour rendre le signal plus précis
-
Optimiser les paramètres de l'indicateur de retournement et de jugement de tendance pour améliorer la probabilité de profit
-
Optimiser les paramètres de stop-loss élevé ou bas pour rendre le stop-loss plus raisonnable
-
Tester différents rapports de risque/rendement pour obtenir les meilleurs résultats
-
Ajustement des paramètres du nombre de positions pour réduire l'impact des pertes individuelles
Résumer
Dans l'ensemble, la stratégie permet d'équilibrer efficacement le trading psychologique et d'obtenir des gains positifs stables grâce à un ensemble de jugements et d'ajustements de paramètres. Bien qu'il y ait encore un certain espace d'amélioration, elle a déjà une valeur d'application réelle. Grâce à la rétroaction du marché et à la finition des paramètres, cette stratégie devrait devenir un outil efficace pour contrôler le trading psychologique et obtenir des gains stables à long terme.
- 1