Stratégie de swing trading RSI basée sur des ajustements intra-annuels

Aperçu
Cette stratégie est une stratégie de trading basée sur les oscillations du RSI, ajustées au cours de l'année, qui émet des signaux de trading lorsque l'indicateur RSI touche le bas et le haut en suivant les caractéristiques de oscillation entre les indicateurs RSI sur les trajectoires de hausse et de baisse définies.
Principe de stratégie
- Définition de la longueur moyenne de la MA, des paramètres du RSI, de la trajectoire ascendante et descendante, des paramètres de stop loss et de la portée des cycles de négociation
- Calculer le RSI, le RSI est égal à la moyenne de la hausse plus la moyenne de la baisse.*100
- Tracer le RSI et les hauts et les bas
- Le RSI sur la descente est un signal de multiplication, sur la descente est un signal de rupture
- Ouverture d'une position et constitution d'une liste OCO
- Arrêtez et arrêtez les pertes selon la logique d'arrêt et d'arrêt définie
Analyse des forces stratégiques
- En définissant des cycles de transactions annuels, on évite certains environnements externes inappropriés.
- L'indicateur RSI peut effectivement refléter les situations de sur-achat et de survente, et peut filtrer une partie du bruit en définissant des intervalles raisonnables pour les transactions de choc.
- La fixation d'un OCO en combinaison avec un arrêt-stop-loss permet une gestion efficace des risques.
Analyse stratégique des risques
- L'exactitude de l'évaluation critique du RSI n'est pas garantie et il peut y avoir un certain risque d'erreur.
- Une mauvaise configuration du cycle de négociation de l'année peut vous faire rater de meilleures opportunités de négociation ou vous amener dans un environnement de négociation inapproprié.
- Un stop-loss trop élevé peut entraîner des pertes plus importantes, un stop-loss trop faible peut entraîner des bénéfices trop faibles.
L'optimisation peut être réalisée en ajustant les paramètres RSI, la durée du cycle de négociation, le stop loss ratio, etc.
Orientation de l'optimisation de la stratégie
- Tester les valeurs optimales du RSI sur différents marchés à différentes périodes
- Analyser les cycles de l'ensemble du marché pour déterminer les meilleures périodes de l'année
- Déterminer le ratio de stop-loss raisonnable à l'aide d'une retrospective
- Optimiser le choix des variétés de transactions et augmenter la taille des positions
- Optimisation combinée à d'autres techniques ou indicateurs de trading plus performants
Résumer
La stratégie suit la tendance des transactions par le biais de la caractéristique de choc de l'indicateur RSI sur des cycles déterminés au cours de l'année, ce qui permet de contrôler efficacement le risque de négociation. Une plus grande efficacité de la stratégie peut être obtenue grâce à l'optimisation des paramètres et à l'optimisation des règles.
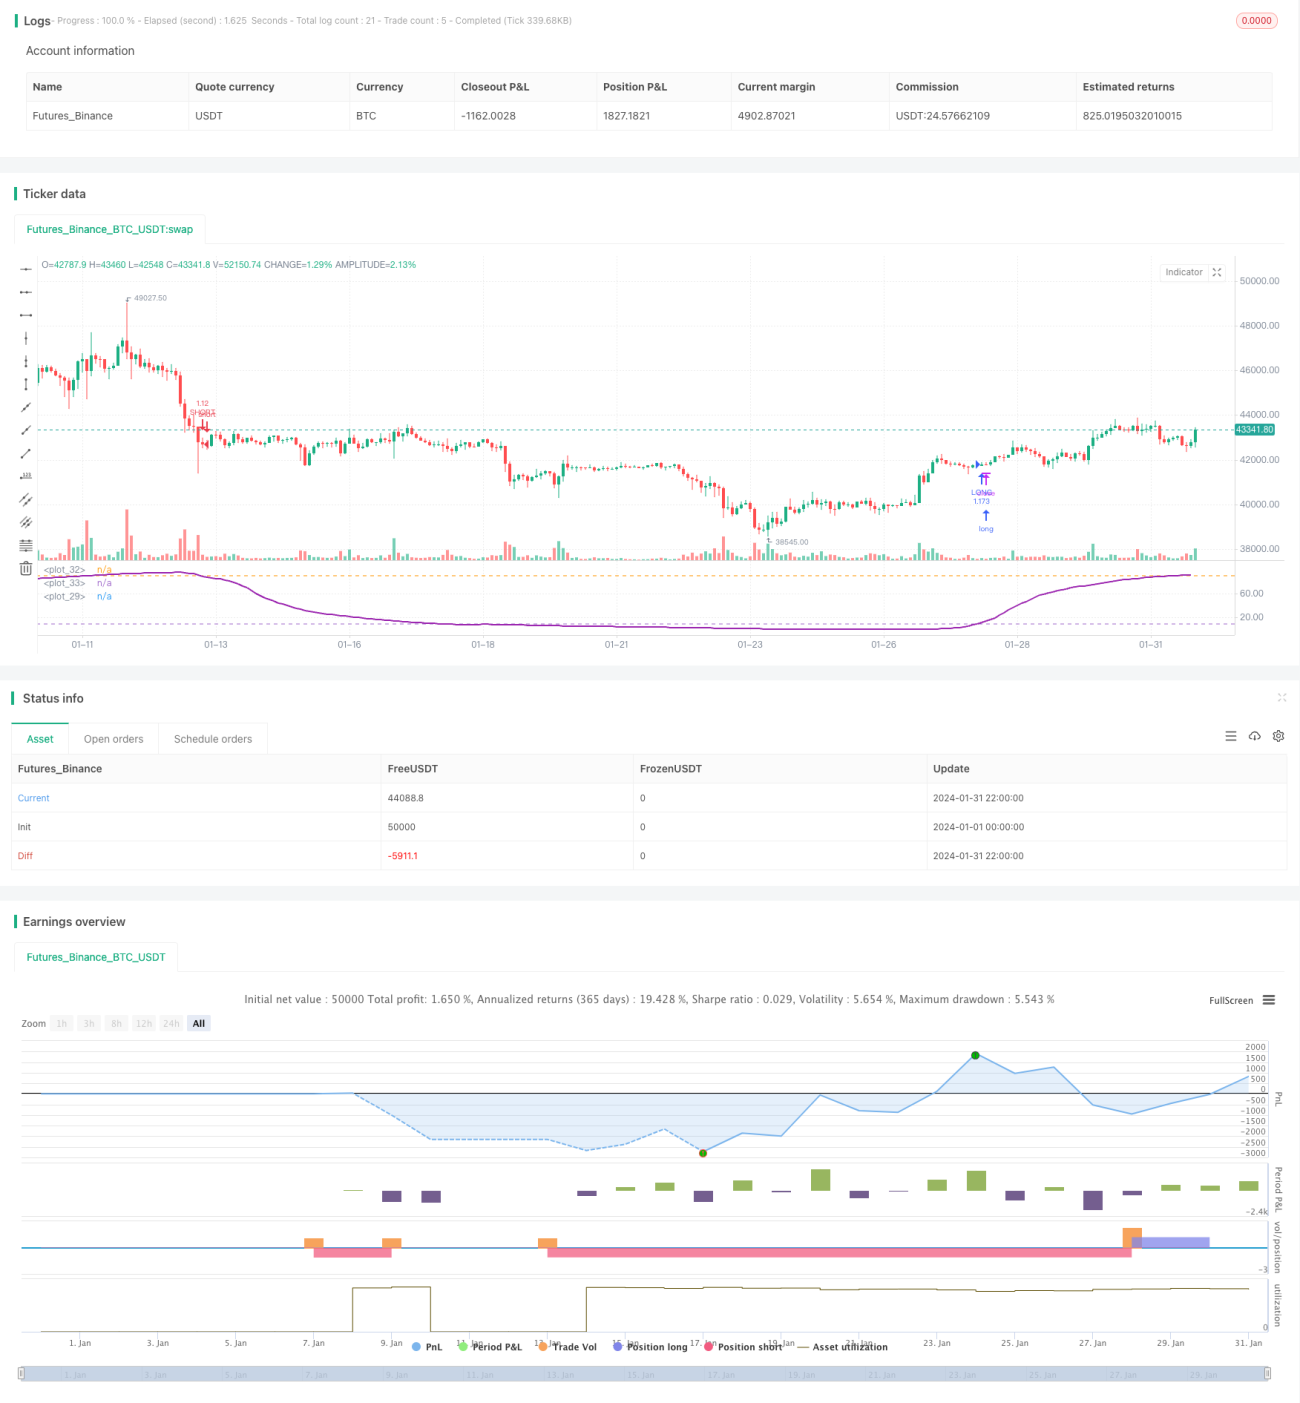
/*backtest
start: 2024-01-01 00:00:00
end: 2024-01-31 23:59:59
period: 2h
basePeriod: 15m
exchanges: [{"eid":"Futures_Binance","currency":"BTC_USDT"}]
*/

//@version=3
strategy(title = "Bitlinc MARSI Study AST",shorttitle="Bitlinc MARSI Study AST",default_qty_type = strategy.percent_of_equity, default_qty_value = 100,commission_type=strategy.commission.percent,commission_value=0.1,initial_capital=1000,currency="USD",pyramiding=0, calc_on_order_fills=false)

// === General Inputs ===- 1