Stratégie de trading BabyShark basée sur les indicateurs VWAP et OBV RSI
Aperçu de la stratégie
La stratégie de négociation BabyShark VWAP est une stratégie de négociation quantitative basée sur la valeur moyenne pondérée en volume de transaction (VWAP) et l’indice de force relative (OBV RSI). La stratégie est conçue pour identifier les signaux d’achat et de vente potentiels en fonction de l’écart de prix du VWAP et de la rupture du RSI OBV de la barre spécifique.
Principe de stratégie
Le principe central de cette stratégie est d’utiliser les deux indicateurs VWAP et OBV RSI pour capturer les tendances et les changements de dynamique du marché. Le VWAP est une moyenne dynamique basée sur les prix et le volume des transactions, capable de refléter les principales zones de négociation du marché.
Plus précisément, la stratégie utilise 60 lignes K comme cycle de calcul du VWAP et prend le prix de clôture comme données d’entrée. Ensuite, il construit des zones de survente et de survente en fonction de l’écart de 3 états positifs et négatifs entre le prix et le VWAP. Pour l’OBV RSI, il utilise 5 lignes K comme cycle de calcul et définit deux seuils de 70 et 30 comme critères de survente et de survente.
En termes de logique de négociation, la stratégie émet un signal de plus lorsque le prix est dans la zone de survente du VWAP en dessous du rail et que l’OBV RSI est inférieur à 30; et un signal de défaut lorsque le prix est dans la zone de survente du VWAP en haut du rail et que l’OBV RSI est supérieur à 70. En outre, la stratégie a également un taux de stop-loss de 0,6% et introduit une période froide de 10 lignes K après des pertes consécutives pour contrôler le risque.
Avantages stratégiques
- Il permet de saisir les tendances et les dynamiques du marché, en combinant plusieurs facteurs tels que les prix et le volume des transactions.
- L’utilisation d’indicateurs dynamiques VWAP et OBV RSI permet de s’adapter aux changements de différentes cycles de marché.
- Il est nécessaire de définir un ratio de stop-loss et une période de répit raisonnables pour contrôler efficacement les risques tout en saisissant les opportunités.
- La logique est claire, facile à comprendre et à mettre en œuvre, avec une certaine interprétabilité.
- Les paramètres sont réglables et peuvent être optimisés et améliorés pour les traders de différents styles.
Risque stratégique
- Les signaux de négociation fréquents peuvent entraîner des transactions excessives et une augmentation des coûts de dérapage en cas de choc ou de récurrence.
- Dans une situation de tendance, le simple fait de s’appuyer sur le VWAP pour effectuer un arrêt peut entraîner une sortie prématurée de la stratégie et la perte de bénéfices de la suite de la tendance.
- Les paramètres fixes peuvent ne pas s’adapter aux changements de l’environnement du marché et doivent être optimisés pour les différentes variétés et cycles.
- L’indicateur OBV est fortement dépendant du volume des transactions et peut induire en erreur le jugement lorsque les données sur le volume des transactions ne sont pas authentiques ou manipulées.
- Le manque de prise en compte de facteurs externes tels que la macroéconomie, l’information, etc., peut entraîner des situations extrêmes.
Direction d’optimisation
- L’introduction de conditions de filtrage supplémentaires, telles que des indicateurs de confirmation de tendance, des indicateurs de volatilité, etc. pour les marchés en crise, réduit la fréquence des transactions.
- Optimiser les conditions de sortie, par exemple en utilisant un stop mobile ou en combinant avec d’autres indicateurs de suivi de la tendance, pour mieux saisir la tendance.
- Optimisation adaptative des paramètres de VWAP et OBV RSI, adaptation dynamique des cycles de calcul et des paramètres de seuil.
- La mise en place d’un mécanisme de vérification de l’authenticité des transactions a amélioré la fiabilité de l’indicateur OBV RSI.
- Envisager d’inclure des analyses de données macroéconomiques, des indicateurs d’humeur, etc. pour améliorer l’adaptabilité et la robustesse de la stratégie.
Résumer
La stratégie de négociation BabyShark VWAP est une stratégie de négociation quantitative qui combine un indice de prix moyen pondéré par la quantité de transaction et un indice de tendance énergétique relativement faible, pour générer un signal de négociation en capturant le statut de survente et la dynamique de la tendance du marché. La logique de la stratégie est claire, combinant plusieurs éléments du marché, tels que le prix et le volume de transaction, afin de saisir pleinement le rythme du marché.
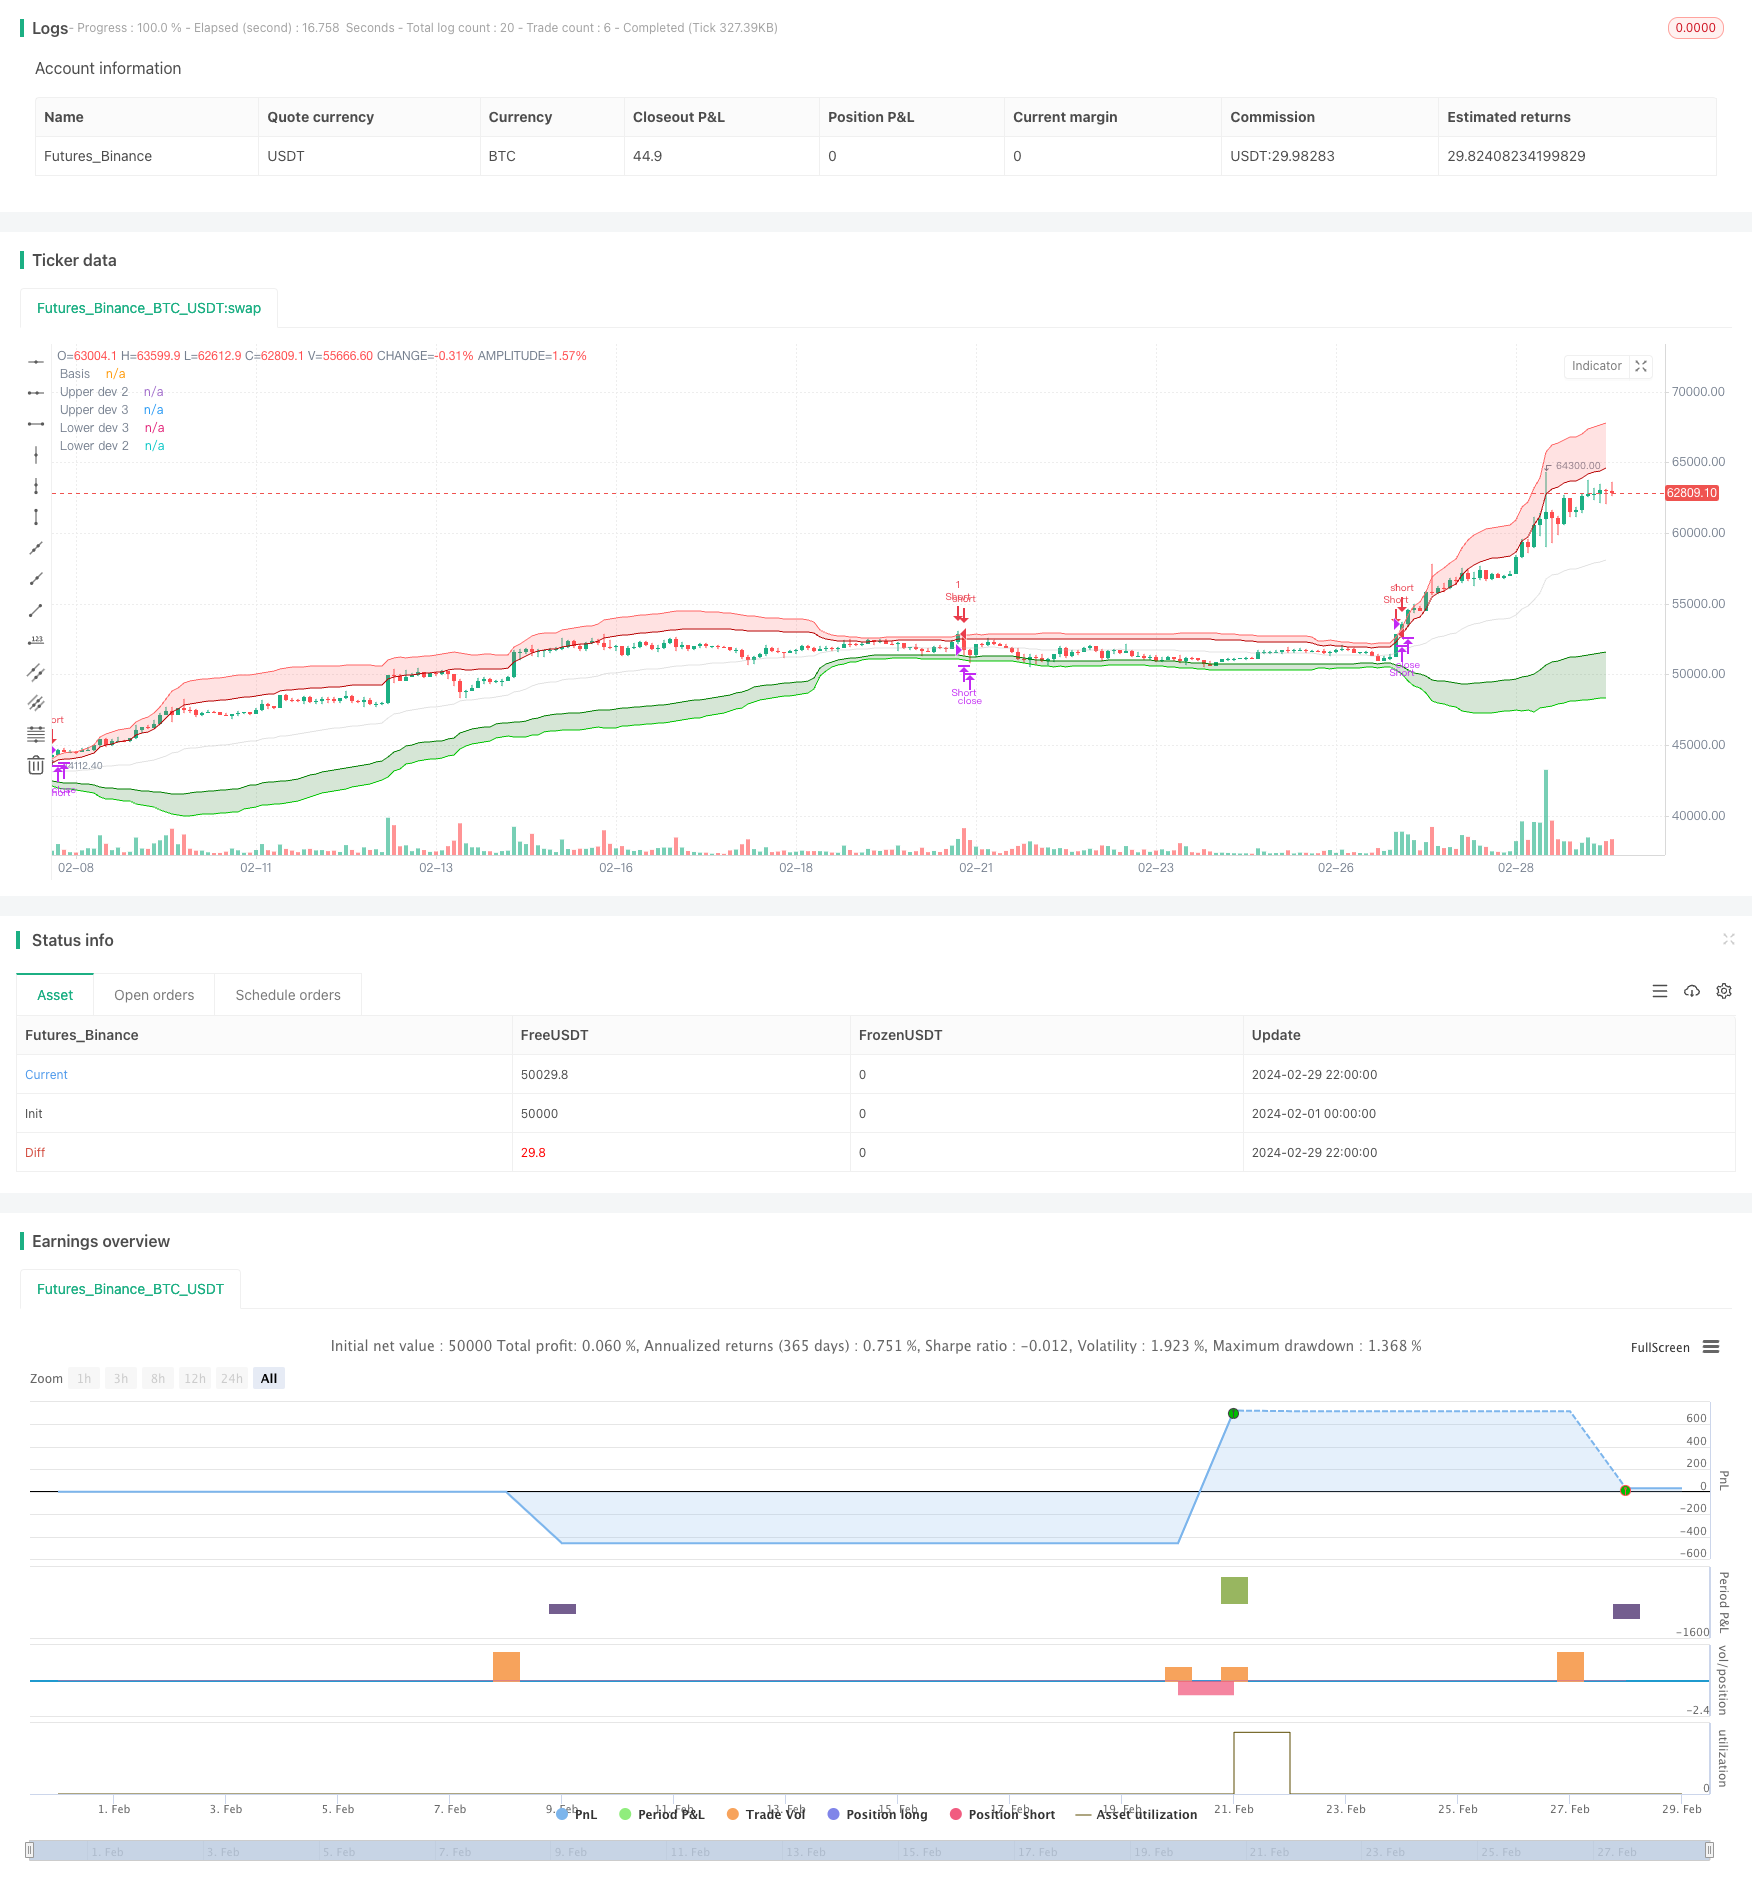
/*backtest
start: 2024-02-01 00:00:00
end: 2024-02-29 23:59:59
period: 2h
basePeriod: 15m
exchanges: [{"eid":"Futures_Binance","currency":"BTC_USDT"}]
*/

// This Pine Script™ code is subject to the terms of the Mozilla Public License 2.0 at https://mozilla.org/MPL/2.0/
// © GreatestUsername

//@version=5
strategy("BabyShark VWAP Strategy", overlay=true, margin_long=100, margin_short=100, calc_on_every_tick = true)


// VWAP
ls = input(false, title='Log-space', group = "Optional")
type = 'Average Deviation'
length = input(60, group="Strategy Modification")
source = input(close, group="Strategy Modification")
_low = ls == true ? math.log(low) : low
_high = ls == true ? math.log(high) : high
src = ls == true ? math.log(source) : source

//weighted mean
pine_vwmean(x, y) =>
    cw = 0.0
    cd = 0.0
    w_sum = 0.0
    d_sum = 0.0
    for i = 0 to y - 1 by 1
        cd := x[i]
        cw := volume[i]
        d_sum += cw * cd
        w_sum += cw
        w_sum
    d_sum / w_sum

//weighted standard deviation
pine_vwstdev(x, y, b) =>
    d_sum = 0.0
    w_sum = 0.0
    cd = 0.0
    for i = 0 to y - 1 by 1
        cd := x[i]
        cw = volume[i]
        d_sum += cw * math.pow(cd - b, 2)
        w_sum += cw
        w_sum
    math.sqrt(d_sum / w_sum)

//weighted average deviation
pine_vwavdev(x, y, b) =>
    d_sum = 0.0
    w_sum = 0.0
    cd = 0.0
    for i = 0 to y - 1 by 1
        cd := x[i]
        cw = volume[i]
        d_sum += cw * math.abs(cd - b)
        w_sum += cw
        w_sum
    d_sum / w_sum

vwmean = pine_vwmean(src, length)

//consider using Average Deviation instead of Standard Deviatio if there are values outside of 3rd upper & lower bands within a rolling window
dev = if type == 'Standard Deviation'
    dev = pine_vwstdev(src, length, vwmean)
    dev
else if type == 'Average Deviation'
    dev = pine_vwavdev(src, length, vwmean)
    dev

basis = ls == true ? math.exp(vwmean) : vwmean
plot(basis, color=color.new(#b7b7b7, 60), title='Basis')

upper_dev_2 = vwmean + dev * 2
upper_dev_3 = vwmean + dev * 3

lower_dev_2 = vwmean - dev * 2
lower_dev_3 = vwmean - dev * 3

fill(
     plot1=plot(ls == true ? math.exp(upper_dev_2) : upper_dev_2, color=color.new(#B20000, 0), title='Upper dev 2'),
     plot2=plot(ls == true ? math.exp(upper_dev_3) : upper_dev_3, color=color.new(#FF6666, 0), title='Upper dev 3', display=display.none),
     color=color.new(#FF4D4D, 80), title='Upper band'
     )
fill(
     plot1=plot(ls == true ? math.exp(lower_dev_3) : lower_dev_3, color=color.new(#00CC00, 0), title='Lower dev 3', display=display.none),
     plot2=plot(ls == true ? math.exp(lower_dev_2) : lower_dev_2, color=color.new(#008000, 0), title='Lower dev 2'),
     color=color.new(#006600, 80), title='Lower band'
     )


// Input to enable or disable the table visibility
table_visible = input(false, title="Show Table", group="Deviation Cross Monitor")
// Input for the number of candles to look back
table_length = input(300, title="Table Lookback Length", group="Deviation Cross Monitor")

// Custom count function
count_occurrences(cond, length) =>
    count = 0
    for i = 0 to length - 1
        if cond[i]
            count := count + 1
    count

// Count occurrences of prices above Upper dev 2 and below Lower dev 2

above_upper_dev_2 = count_occurrences(close > upper_dev_2, table_length)
below_lower_dev_2 = count_occurrences(close < lower_dev_2, table_length)

// Create table in the bottom right corner
var table tbl = table.new(position=position.bottom_right, rows=2, columns=2)

if table_visible
    if barstate.islast
        // Update the table headers
        table.cell(tbl, 0, 0, "Above Upper Dev 2", bgcolor=color.gray, text_color=color.white)
        table.cell(tbl, 0, 1, "Below Lower Dev 2", bgcolor=color.gray, text_color=color.white)

        // Update the table values
        table.cell(tbl, 1, 0, str.tostring(above_upper_dev_2), bgcolor=color.new(color.green, 90), text_color=color.green)
        table.cell(tbl, 1, 1, str.tostring(below_lower_dev_2), bgcolor=color.new(color.red, 90), text_color=color.red)
else
    table.delete(tbl)

// RSI
obvsrc = close
change_1 = ta.change(obvsrc)
obv = ta.cum(ta.change(obvsrc) > 0 ? volume : change_1 < 0 ? -volume : 0 * volume)

src2 = obv
len = input.int(5, minval=1, title="RSI Length", group="Strategy Modification")
up = ta.rma(math.max(ta.change(src2), 0), len)
down = ta.rma(-math.min(ta.change(src2), 0), len)
rsi = down == 0 ? 100 : up == 0 ? 0 : 100 - 100 / (1 + up / down)
higherlvl = input(70, title="Higher Level", group="Strategy Modification")
lowerlvl = input(30, title="Lower Level", group="Strategy Modification")


plot_color = rsi >= higherlvl ? color.red : rsi <= lowerlvl ? color.green : color.new(#b7b7b7, 60)
// plot(rsi, color=plot_color)

//plot(rsi, color=color.white)


// Count occurrences of RSI crossing higher level and lower level
cross_above_higher = ta.crossover(rsi, higherlvl)
cross_below_lower = ta.crossunder(rsi, lowerlvl)
above_higher_count = count_occurrences(cross_above_higher, table_length)
below_lower_count = count_occurrences(cross_below_lower, table_length)

// Create table in the bottom right corner
if (table_visible)
    var table tbl2 = table.new(position=position.bottom_right, rows=2, columns=2)
    if (barstate.islast)
        // Update the table headers
        table.cell(tbl2, 0, 0, "Higher Level Cross", bgcolor=color.gray, text_color=color.white)
        table.cell(tbl2, 0, 1, "Lower Level Cross", bgcolor=color.gray, text_color=color.white)

        // Update the table values
        table.cell(tbl2, 1, 0, str.tostring(above_higher_count), bgcolor=color.new(color.red, 90), text_color=color.red)
        table.cell(tbl2, 1, 1, str.tostring(below_lower_count), bgcolor=color.new(color.green, 90), text_color=color.green)


// Entries

// Long Entry:
// Price is in the shaded GREEN area of [Hoss] VWAP Deviation
// and the [Hoss] OBV RSI is GREEN.
longCondition1 = close <= lower_dev_3
longConditions = plot_color == color.green and longCondition1 and strategy.position_size == 0

// Short Entry:
// Price is in the shaded RED area of [Hoss] VWAP Deviation
// and the [Hoss] OBV RSI is RED.
shortCondition1 = close >= upper_dev_3
shortConditions = plot_color == color.red and shortCondition1 and strategy.position_size == 0

var int lastEntryBar = 0


shortEMA = ta.ema(close, 12)
longEMA = ta.ema(close, 21)
uptrend = shortEMA > longEMA

if longConditions and lastEntryBar < bar_index - 10 //and uptrend
    strategy.entry("Long", strategy.long, stop=close * 0.994)
    lastEntryBar := bar_index

if shortConditions and lastEntryBar < bar_index - 10 //and not uptrend
    strategy.entry("Short", strategy.short, stop=close * 1.006)
    lastEntryBar := bar_index


if strategy.position_size > 0 and (ta.crossover(close, basis) or strategy.opentrades.entry_price(strategy.opentrades - 1) * 0.994 > close)
    strategy.close("Long", immediately = true)
if strategy.position_size < 0 and (ta.crossunder(close, basis) or strategy.opentrades.entry_price(strategy.opentrades - 1) * 1.006 < close)
    strategy.close("Short", immediately = true)

// Stop Loss:
// 0.6%
// After 1 Loss => NO more Trades for 10 Candles (10 minutes) (usually a breakout will happen, and it takes average 10min till it ranges again. So basically wait for range to form again)

// Take Profit:
// Grey line on [Hoss] VWAP Deviation or 0.6%