Stratégie de croisement MACD

Aperçu
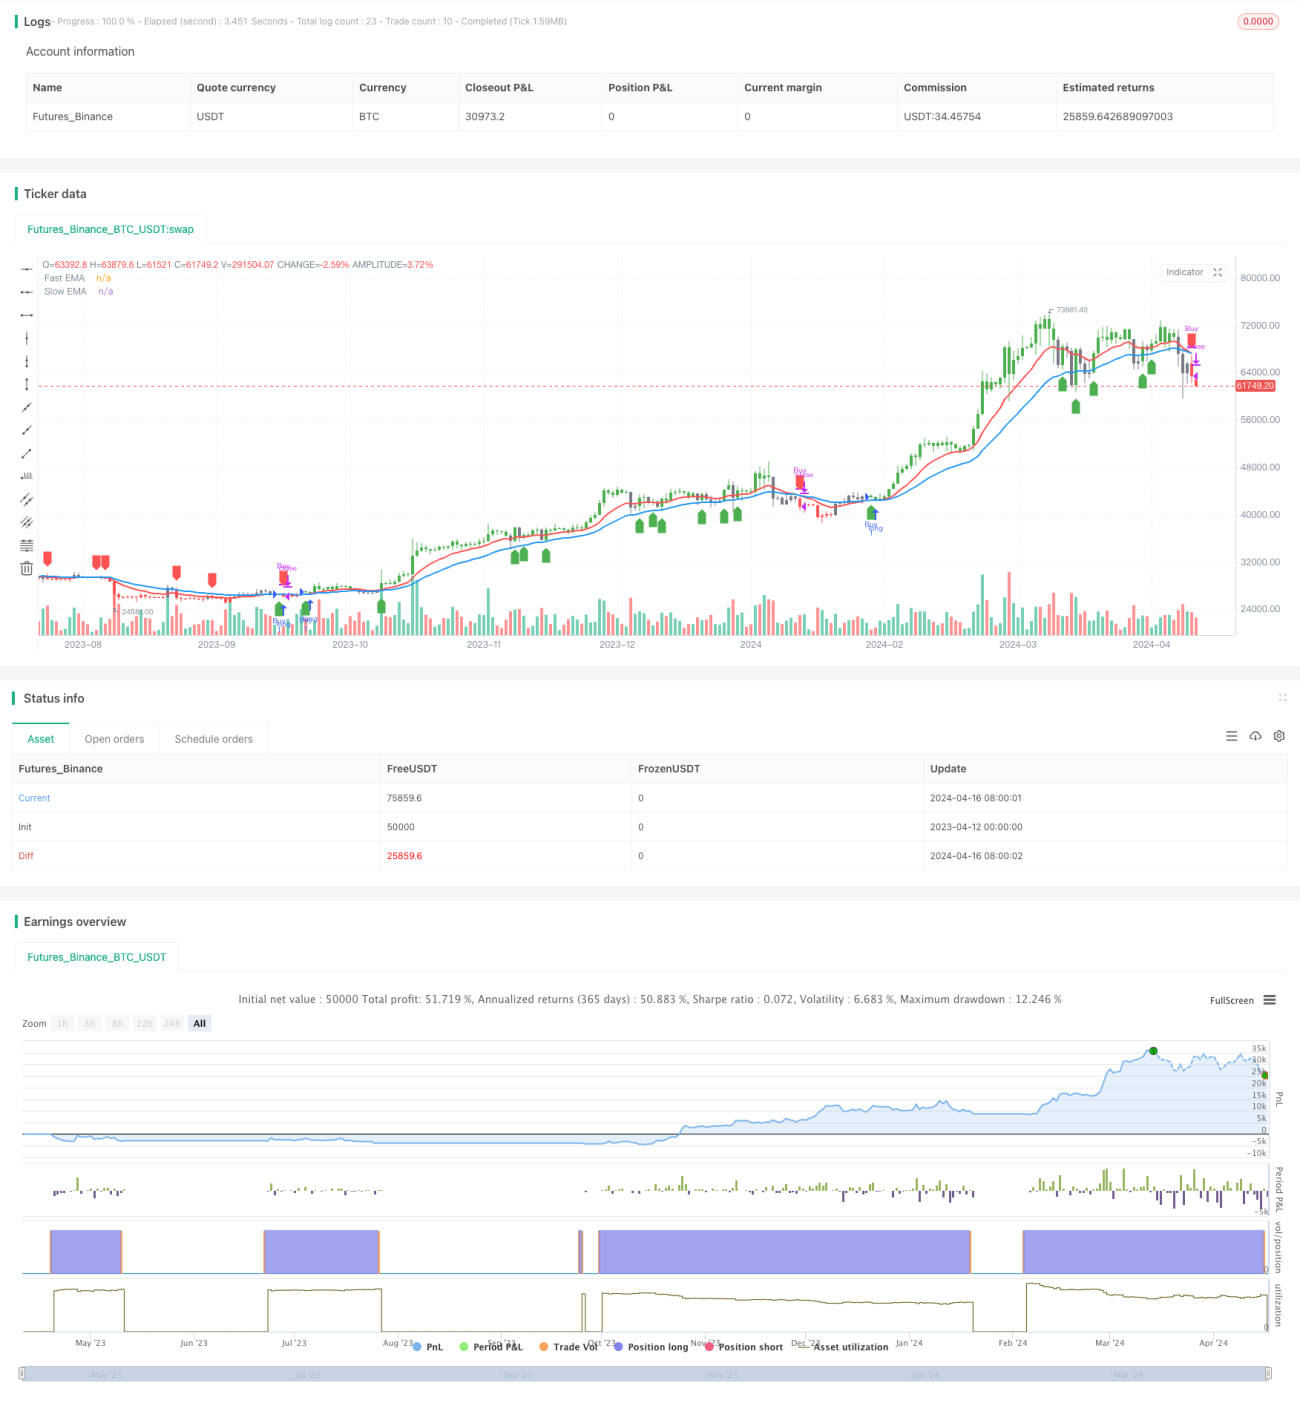
La stratégie utilise deux moyennes mobiles indicielles de deux périodes différentes (EMA) pour la croisée, générant un signal d'achat lorsque l'EMA rapide traverse l'EMA lente de haut en bas et un signal de vente lorsque l'EMA rapide traverse l'EMA lente de haut en bas. La stratégie peut être appliquée à divers instruments financiers et périodes de temps, par exemple, l'or est le plus efficace sur un cycle de 2 heures, le bitcoin est le plus efficace sur un graphique du jour.
Principe de stratégie
- Calculer les EMA rapides (la période par défaut est de 12) et les EMA lentes (la période par défaut est de 26).
- Définition des zones à plusieurs têtes ((EMA rapide au-dessus de l'EMA lente et prix au-dessus de l'EMA rapide) et des zones à tête vide ((EMA rapide au-dessous de l'EMA lente et prix au-dessous de l'EMA rapide).
- Achat lors de la conversion d'une zone de tête vide à une zone de tête multiple et vente lors de la conversion d'une zone de tête multiple à une zone de tête vide.
- Les zones à plusieurs têtes et les zones à tête vide sont indiquées en vert et rouge sur le graphique, les signaux d'achat et de vente sont indiqués par des flèches.
Avantages stratégiques
- C'est facile à comprendre et adapté aux débutants.
- Il s'agit d'une plateforme très polyvalente qui peut être utilisée pour différents instruments financiers et périodes.
- Le système de suivi des tendances est puissant et permet de saisir les tendances à moyen et long terme.
- Les paramètres sont réglables pour une plus grande flexibilité.
Risque stratégique
- Il est facile de faire des erreurs de signalisation dans les marchés en crise, ce qui peut entraîner des pertes.
- La réaction est plus lente lors d'une inversion de tendance, ce qui peut entraîner un certain glissement.
- Une mauvaise sélection de paramètres peut affecter l'efficacité de la stratégie.
Orientation de l'optimisation de la stratégie
- Ajouter des filtres de tendance, par exemple en ne négociant que lorsque l'ADX est supérieur à une valeur donnée, afin de réduire les pertes en cas de choc.
- Optimiser le timing des sorties, par exemple en utilisant l'ATR pour décider d'arrêter le stop loss et réduire les pertes individuelles.
- Optimiser les paramètres pour trouver la meilleure combinaison de paramètres, améliorer la stabilité et la rentabilité.
- La précision du signal est améliorée en combinaison avec d'autres indicateurs de jugement, tels que le MACD, le RSI, etc.
Résumer
La stratégie de croisement MACD est une stratégie simple basée sur le suivi de la tendance. Elle a pour avantage d'être simple et pratique, d'avoir un large éventail d'applications, et pour inconvénient d'avoir du mal à saisir les virages de tendance et à choisir des paramètres difficiles. La performance de la stratégie peut être améliorée par le filtrage de la tendance, l'optimisation des sorties, la sélection des paramètres et la combinaison d'autres indicateurs.
/*backtest
start: 2023-04-12 00:00:00
end: 2024-04-17 00:00:00
period: 1d
basePeriod: 1h
exchanges: [{"eid":"Futures_Binance","currency":"BTC_USDT"}]
*/

//@version=5
strategy('Advance EMA Crossover Strategy', overlay=true, precision=6)
//****************************************************************************//
// CDC Action Zone is based on a simple EMA crossover - 1