एमएसीडी विली रणनीति
लेखक:चाओझांग, दिनांक: 2022-05-09 15:17:57टैगःएमएसीडी
यह रणनीति मुख्य रूप से स्केलिंग / इंट्राडे ट्रेडिंग के लिए विकसित की गई है। इसका उपयोग अल्पकालिक विकल्पों के व्यापार के लिए प्रवेश / निकास संकेतों की पहचान करने के लिए किया जा सकता है। यह नियमित सत्र बार डेटा का उपयोग करके 5 मिनट से 15 मिनट के बीच के समय सीमाओं पर उपयोग किए जाने पर लोकप्रिय शेयरों पर अच्छा प्रदर्शन करता है। यह 3 लोकप्रिय संकेतकों, ईएमए, एमएसीडी, और विलियम % रेंज को जोड़ती है, जिससे लंबे और छोटे दोनों संकेत उत्पन्न होते हैं।
ईएमए: डिफ़ॉल्ट 200 ईएमए लाइन है।
एमएसीडी: डिफ़ॉल्ट रूप से तेज/धीमी सिग्नल इनपुट के लिए 12/26 लंबाई है।
विलियम % आर - सुचारू (प्रकाशित): यह एक कस्टम संकेतक है जो मूल विलियम %R रेखा से दो चलती औसत रेखा उत्पन्न करता है.
यह कैसे काम करता हैः प्रवेश की शर्तें:
- ईएमए रेखा के ऊपर/नीचे पट्टी बंद होने पर लंबी/छोटी प्रविष्टियाँ
- लंबी/छोटी प्रविष्टियाँ जब एमएसीडी रेखा संकेत रेखा से ऊपर/नीचे हो (लंबी के लिए हिस्टोग्राम > 0, छोटी के लिए < 0)
- लंबे/छोटे प्रविष्टियाँ जब विलियम %R तेज एमए लाइन धीमी एमए लाइन से ऊपर/नीचे हो
बाहर निकलने की शर्तेंः
- जब एमएसीडी रेखा सिग्नल रेखा से नीचे हो, तो बाहर निकलने के लिए लंबा, और बाहर निकलने के लिए छोटा
- जब विलियम %R फास्ट एमए लाइन धीमी एमए लाइन से नीचे हो, तो बाहर निकलने के लिए लंबे समय तक बाहर निकलें।
- जब विलियम % आर फास्ट एमए लाइन ओवरबॉट (-20) सीमा से नीचे होनी चाहिए, जब ओवरसोल्ड (-80) सीमा से ऊपर हो तो शॉर्ट से बाहर निकलें।
ध्यान दें कि पैरामीटर किसी विशेष स्टॉक/इंस्ट्रूमेंट के लिए अनुकूलित नहीं हैं।
आनंद लें!
बैकटेस्ट
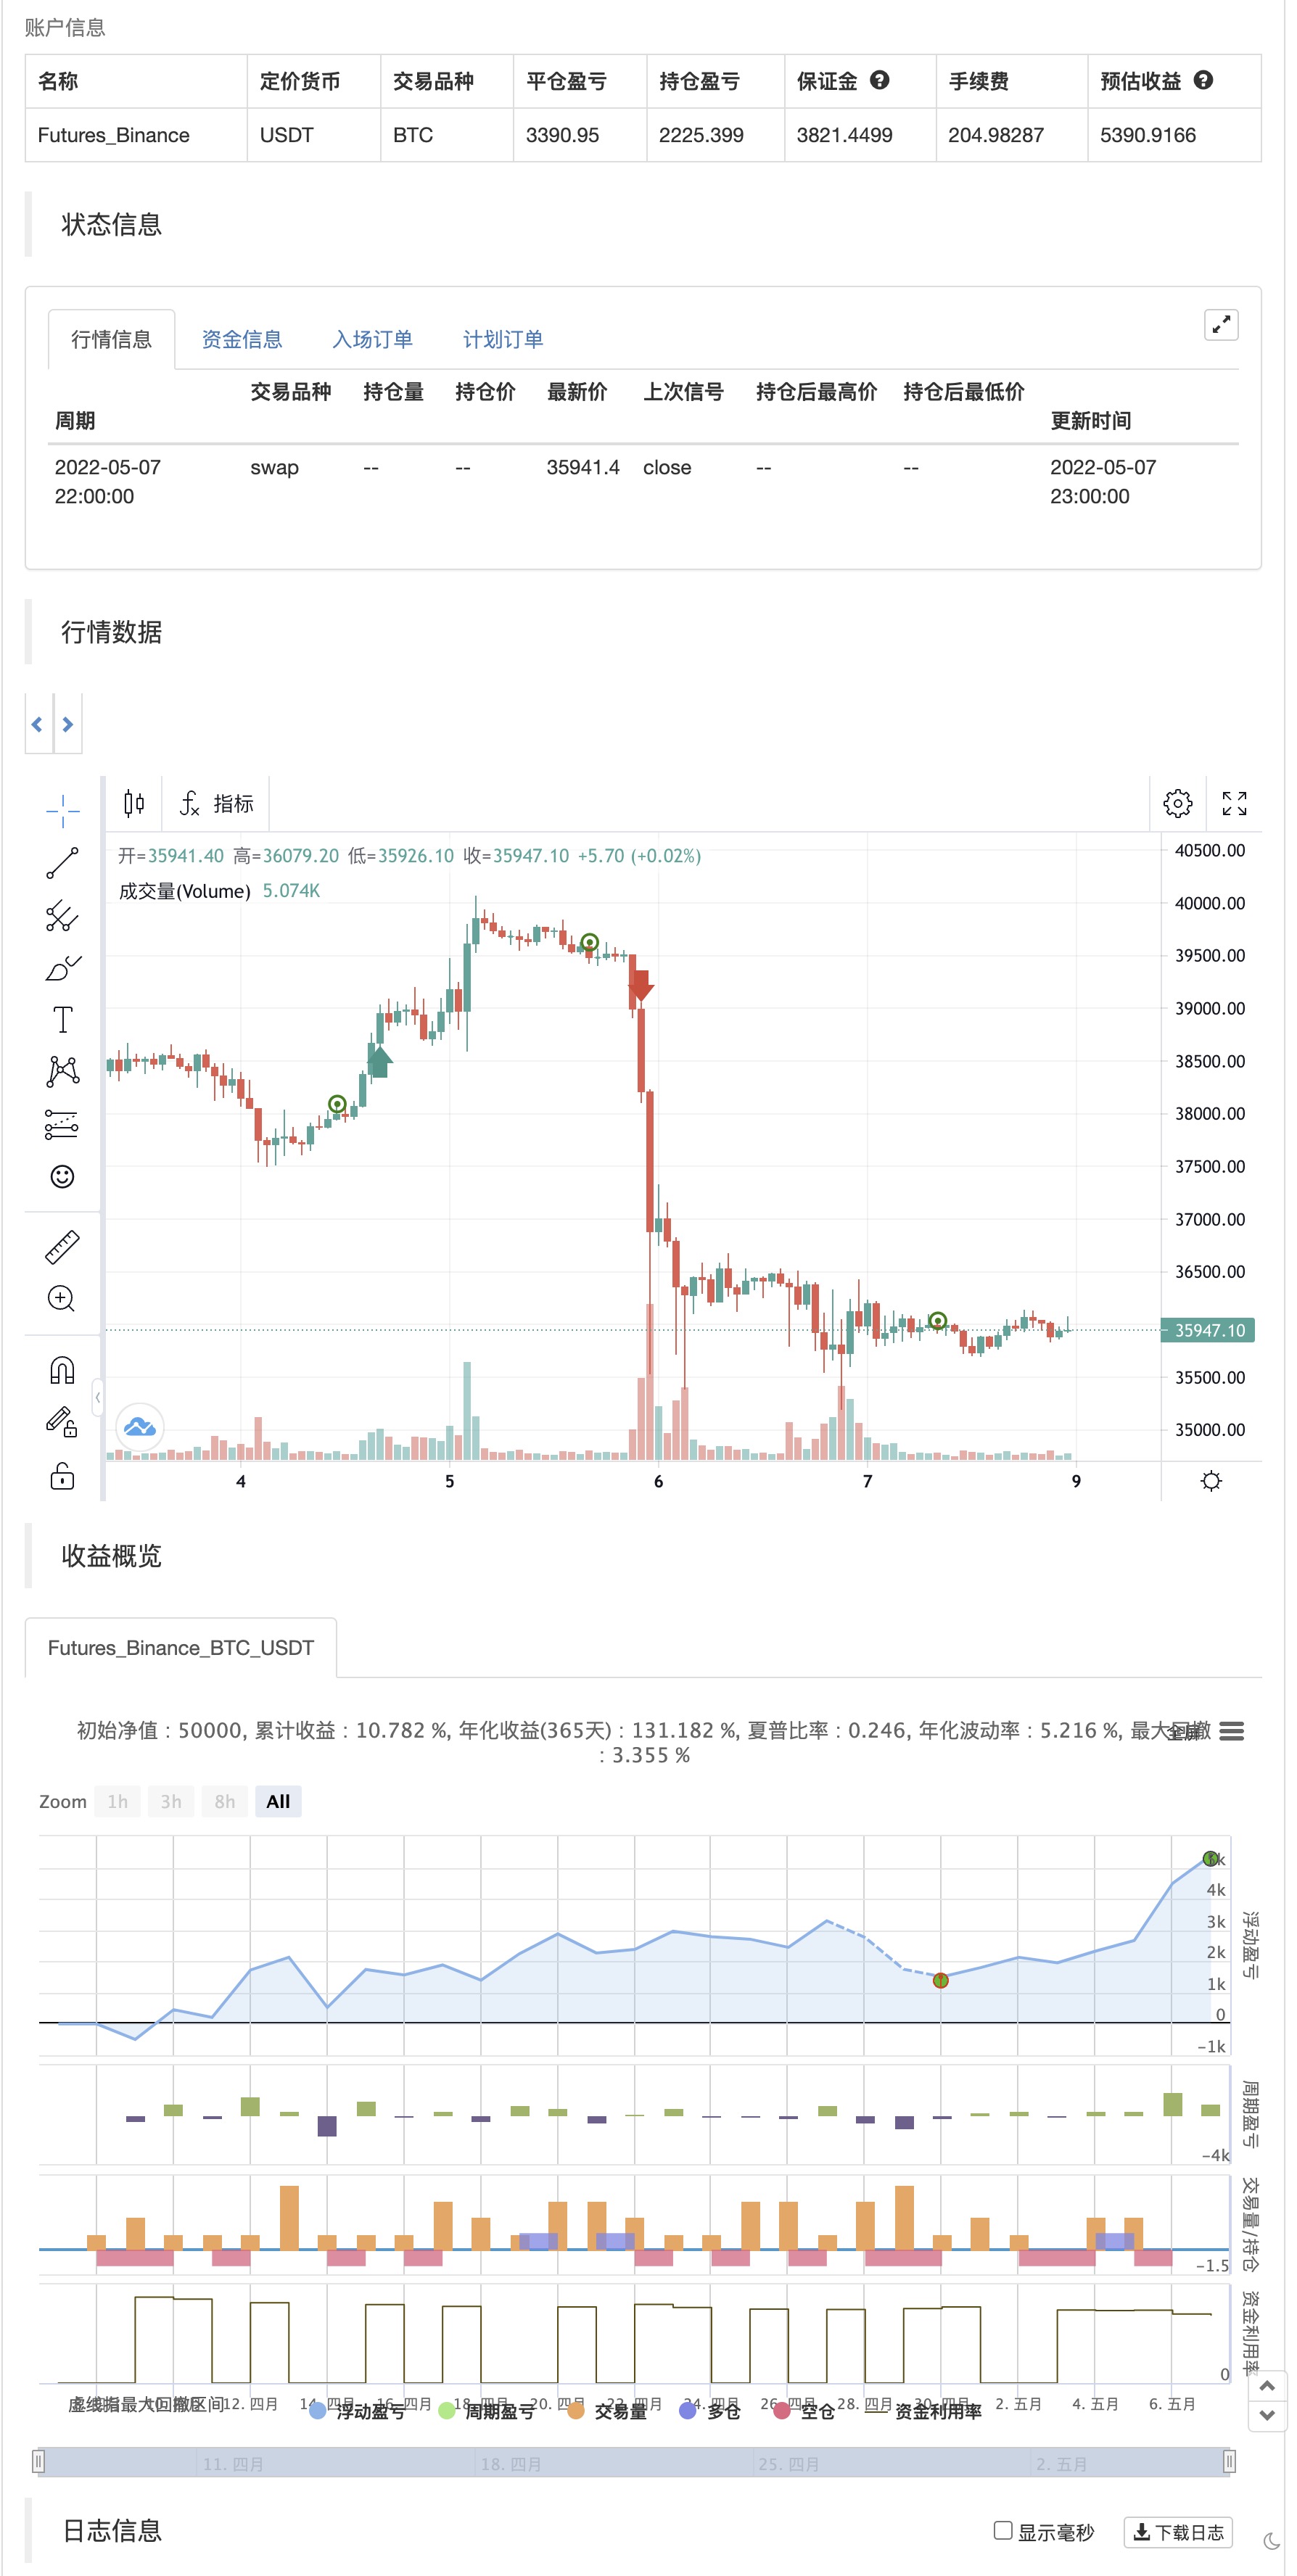
/*backtest
start: 2022-04-08 00:00:00
end: 2022-05-07 23:59:00
period: 1h
basePeriod: 15m
exchanges: [{"eid":"Futures_Binance","currency":"BTC_USDT"}]
*/

// This source code is subject to the terms of the Mozilla Public License 2.0 at https://mozilla.org/MPL/2.0/
// © platsn

//@version=5
strategy("MACD Willy Strategy", overlay=true, pyramiding=1, initial_capital=10000)

// ******************** Trade Period **************************************
startY = input(title='Start Year', defval=2011, group = "Trading window")
startM = input.int(title='Start Month', defval=1, minval=1, maxval=12, group = "Trading window")
startD = input.int(title='Start Day', defval=1, minval=1, maxval=31, group = "Trading window")
finishY = input(title='Finish Year', defval=2050, group = "Trading window")
finishM = input.int(title='Finish Month', defval=12, minval=1, maxval=12, group = "Trading window")
finishD = input.int(title='Finish Day', defval=31, minval=1, maxval=31, group = "Trading window")
//timestart = timestamp(startY, startM, startD, 00, 00)
//timefinish = timestamp(finishY, finishM, finishD, 23, 59)
// t1 = time(timeframe.period, "0945-1545:23456")
// window = time >= timestart and time <= timefinish and t1 ? true : false
// t2 = time(timeframe.period, "0930-1555:23456")
// window2 = time >= timestart and time <= timefinish and t2 ? true : false

leverage = input.float(1, title="Leverage (if applicable)", step=0.1, group = "Trading Options")
reinvest = input.bool(defval=false,title="Reinvest profit", group = "Trading Options")
reinvest_percent = input.float(defval=20, title = "Reinvest percentage", group="Trading Options")
// entry_lookback = input.int(defval=10, title="Lookback period for entry condition", group = "Trading Options")

// -------------------------------------------- Data Source --------------------------------------------

src = input(title="Source", defval=close)

// ***************************************************************************************************** Daily ATR *****************************************************
atrlen = input.int(14, minval=1, title="ATR period", group = "Daily ATR")
iPercent = input.float(5, minval=1, maxval=100, step=0.1, title="% ATR to use for SL / PT", group = "Daily ATR")

percentage = iPercent * 0.01
datr = request.security(syminfo.tickerid, "1D", ta.rma(ta.tr, atrlen))
datrp = datr * percentage

// plot(datr,"Daily ATR")
// plot(datrp, "Daily % ATR")

//*********************************************************** VIX volatility index ****************************************

//VIX = request.security("VIX", timeframe.period, close)
//vix_thres = input.float(20.0, "VIX Threshold for entry", step=0.5, group="VIX Volatility Index")

// ************************************************ Volume ******************************************************

vol_len = input(50, 'Volume MA Period')
avg_vol = ta.sma(volume, vol_len)

//-------------------------------------------------------- Moving Average ------------------------------------

emalen1 = input.int(200, minval=1, title='EMA', group= "Moving Averages")
ema1 = ta.ema(src, emalen1)

// ------------------------------------------ MACD ------------------------------------------
// Getting inputs
fast_length = input(title="Fast Length", defval=12)
slow_length = input(title="Slow Length", defval=26)
signal_length = input.int(title="Signal Smoothing",  minval = 1, maxval = 50, defval = 9)
sma_source = input.string(title="Oscillator MA Type",  defval="EMA", options=["SMA", "EMA"])
sma_signal = input.string(title="Signal Line MA Type", defval="EMA", options=["SMA", "EMA"])
// Plot colors
col_macd = input(#2962FF, "MACD Line  ", group="Color Settings", inline="MACD")
col_signal = input(#FF6D00, "Signal Line  ", group="Color Settings", inline="Signal")
col_grow_above = input(#26A69A, "Above   Grow", group="Histogram", inline="Above")
col_fall_above = input(#B2DFDB, "Fall", group="Histogram", inline="Above")
col_grow_below = input(#FFCDD2, "Below Grow", group="Histogram", inline="Below")
col_fall_below = input(#FF5252, "Fall", group="Histogram", inline="Below")
// Calculating
fast_ma = sma_source == "SMA" ? ta.sma(src, fast_length) : ta.ema(src, fast_length)
slow_ma = sma_source == "SMA" ? ta.sma(src, slow_length) : ta.ema(src, slow_length)
macd = fast_ma - slow_ma
signal = sma_signal == "SMA" ? ta.sma(macd, signal_length) : ta.ema(macd, signal_length)
hist = macd - signal

// ---------------------------------------- William %R --------------------------------------
w_length = input.int(defval=34, minval=1)
w_upper = ta.highest(w_length)
w_lower = ta.lowest(w_length)

w_output = 100 * (close - w_upper) / (w_upper - w_lower)

fast_period = input(defval=5, title='Smoothed %R Length')
slow_period = input(defval=13, title='Slow EMA Length')

w_fast_ma = ta.wma(w_output,fast_period)
w_slow_ma = ta.ema(w_output,slow_period)


// ------------------------------------------------ Entry Conditions ----------------------------------------

L_entry1 = close > ema1 and hist > 0 and w_fast_ma > w_slow_ma
S_entry1 = close < ema1 and hist < 0 and w_fast_ma < w_slow_ma

// -------------------------------------------------- Entry -----------------------------------------------

//profit = strategy.netprofit
//trade_amount = math.floor(strategy.initial_capital*leverage / close)

//if strategy.netprofit > 0 and reinvest
//    trade_amount := math.floor((strategy.initial_capital+(profit*reinvest_percent*0.01))*leverage / close)
//else
//    trade_amount := math.floor(strategy.initial_capital*leverage/ close)


if L_entry1 //and window
    strategy.entry("Long", strategy.long)

if S_entry1 //and window
    strategy.entry("Short", strategy.short)

// --------------------------------------------------- Exit Conditions -------------------------------------

L_exit1 = hist < 0 and w_fast_ma < w_slow_ma and w_fast_ma < -20
S_exit1 = hist > 0 and w_fast_ma > w_slow_ma and w_fast_ma > -80

// ----------------------------------------------------- Exit ---------------------------------------------

if L_exit1 //and window2
    strategy.close("Long")

if S_exit1 //and window2
    strategy.close("Short")

// if time(timeframe.period, "1530-1600:23456")
//     strategy.close_all()
- एमएसीडी आरएसआई इचिमोकू लम्बी रणनीति के बाद गति का रुझान
- लगातार MACD स्वर्ण और मृत्यु क्रॉस पर आधारित ट्रेडिंग रणनीति
- आरएसआई/एमएसीडी/एटीआर के साथ ईएमए क्रॉसओवर रणनीति में सुधार
- एमएसीडी और आरएसआई संयुक्त दीर्घकालिक ट्रेडिंग रणनीति
- बहु-सूचक संयोजन रणनीति (CCI, DMI, MACD, ADX)
- बहु-सूचक प्रवृत्ति रणनीति का पालन करना
- सीसीआई, डीएमआई और एमएसीडी हाइब्रिड लॉन्ग-शॉर्ट रणनीति
- इलियट वेव थ्योरी 4-9 इम्पल्स वेव ऑटोमैटिक डिटेक्शन ट्रेडिंग रणनीति
- एमएसीडी गोल्डन क्रॉस और डेथ क्रॉस रणनीति
- एमएसीडी-वी और फाइबोनैचि मल्टी टाइमफ्रेम डायनेमिक टेक प्रॉफिट रणनीति
- एमएसीडी बीबी ब्रेकआउट रणनीति
- चलती औसत खरीद-बेच
- मिडास एमके. II - अंतिम क्रिप्टो स्विंग
- टीएमए-लेगेसी
- टीवी उच्च और निम्न रणनीति
- सर्वश्रेष्ठ ट्रेडिंग व्यू रणनीति
- बड़े स्नैपर अलर्ट R3.0 + चाइकिंग अस्थिरता की स्थिति + TP RSI
- चंदे क्रॉल स्टॉप
- आरएसआई क्रॉस रणनीति के साथ सीसीआई + ईएमए
- ईएमए बैंड + लेलेडसी + बोलिंगर बैंड ट्रेंड कैचिंग रणनीति
- आरएसआई एमटीएफ ओबी+ओ
- आरएसआई - खरीदें बेचें संकेत
- हेकिन-अशी प्रवृत्ति
- एचए बाजार पूर्वाग्रह
- इचिमोकू क्लाउड स्मूथ ऑसिलेटर
- विलियम्स %R - चिकनी
- क्यूक्यूई एमओडी + एसएसएल हाइब्रिड + वाद्दाह अट्टार विस्फोट
- स्ट्रैट खरीदें/बेचें
- ईएमए और एडीएक्स के साथ ट्रिपल सुपरट्रेंड
- टॉम डेमार्क अनुक्रमिक ताप मानचित्र
- jma + dwma मल्टीग्रेन द्वारा