
ओवर-वन रणनीति एक ट्रेंड ट्रेडिंग रणनीति है जो ओवर-वन सूचक के आधार पर व्यापारिक निर्णय लेती है। यह रणनीति ओवर-वन सूचक के रूपांतरण लाइन, बेंचमार्क लाइन और क्लाउड बैंड के संबंधों को वर्तमान प्रवृत्ति की दिशा का आकलन करने के लिए उपयोग करती है, और कीमतों के रिवर्स के साथ प्रवेश करती है।
सुपर 1 रणनीति मुख्य रूप से मध्यम-लंबी रेखा के रुझान व्यापार के लिए उपयुक्त है, जो बड़ी प्रवृत्ति में लाभान्वित हो सकती है। इस रणनीति में मजबूत प्रवृत्ति पहचानने की क्षमता भी है।
एक से अधिक रणनीतियाँ मुख्य रूप से निम्नलिखित कारकों को देखते हुए व्यापार की दिशा तय करती हैंः
परिवर्तनीय रेखा और बेंचमार्क रेखा का संबंध:जब ट्रांसफॉर्म लाइन ऊपर होती है तो यह बढ़ जाती है और जब यह नीचे होती है तो यह गिर जाती है।
बादलों के रंग:जब बादल हरे होते हैं, तो वे बढ़ते हैं, और जब वे लाल होते हैं, तो वे गिर जाते हैं।
कीमतों में बदलावःमूल्य वापसी परिवर्तनीय रेखा और बेंचमार्क रेखा के बाहर प्रवेश के लिए आवश्यक है
इस रणनीति के लिए ट्रेडिंग सिग्नल इस प्रकार हैं:
यह एक और संकेत है:
यह एक संकेत है।
जब एक ही समय में अधिक / खाली संकेतों को पूरा किया जाता है, तो स्थिति की स्थिति के अनुसार स्थिति खोलने का संचालन किया जाता है
एक से अधिक रणनीतियों के निम्नलिखित फायदे हैंः
एक से अधिक संकेतकों के संयोजन का उपयोग करके प्रवृत्ति की दिशा का निर्धारण करने के लिए उच्च सटीकता
परिवर्तनीय रेखा और बेंचमार्क रेखा स्पष्ट रूप से मध्यम-लघु अवधि के रुझानों का आकलन करती हैं, जबकि बादल पट्टी लंबी अवधि के रुझानों का आकलन करती हैं
शर्तों के अनुसार, कीमतों को टर्नओवर लाइन को वापस लेने की आवश्यकता होती है, जिससे झूठे ब्रेक के नुकसान से बचा जा सके।
जोखिम नियंत्रण हाल की अवधि में उच्चतम न्यूनतम मूल्य की रोकथाम को अपनाना, एकल हानि को प्रभावी ढंग से नियंत्रित करना
स्थिर लाभ के लिए उचित से अधिक घाटा
विभिन्न चक्रों में लागू, मध्यम और लंबी रेखा प्रवृत्ति व्यापार के लिए उपयुक्त
रणनीति स्पष्ट और समझने में आसान है, पैरामीटर अनुकूलन के लिए जगह है
विभिन्न बाजार स्थितियों में अच्छा काम करता है
एक से अधिक रणनीतियों के साथ निम्नलिखित जोखिम भी हैं:
अस्थिर बाजारों में, स्टॉप लॉस को बार-बार ट्रिगर किया जा सकता है, जिससे लाभप्रदता प्रभावित हो सकती है
जब रुझान तेजी से बदलता है, तो समय पर स्थिति को उलटने में असमर्थता से नुकसान हो सकता है
सेट लाभ हानि अनुपात सभी किस्मों के लिए उपयुक्त नहीं है, विभिन्न मापदंडों के लिए समायोजन मापदंडों की आवश्यकता है
बादल के क्षेत्र को पार करने के बाद सीमित स्थान के साथ, लाभ सीमित हो सकता है
सूचक पैरामीटर को बार-बार परीक्षण और अनुकूलन की आवश्यकता होती है और बार-बार पैरामीटर को समायोजित करने वाली किस्मों के लिए उपयुक्त नहीं है
जोखिम को निम्न तरीकों से कम किया जा सकता हैः
विभिन्न चक्रों और किस्मों की विशेषताओं के लिए अनुकूलित पैरामीटर
अन्य संकेतक के साथ संयोजन में प्रवेश संकेतों को फ़िल्टर करना, अस्थिर बाजार में झूठे ब्रेक से बचें
गतिशील रूप से स्टॉप लॉस स्थिति को समायोजित करें, स्टॉप लॉस के ट्रिगर होने की संभावना को कम करें
विभिन्न लाभ-हानि अनुपात सेटिंग्स का परीक्षण करें
प्रवृत्ति संकेतों की ताकत का पता लगाने के लिए चार्ट आकार आदि का उपयोग करना
एक से अधिक रणनीतियों को निम्नलिखित पहलुओं से अनुकूलित किया जा सकता हैः
रूपांतरण लाइन और बेंचमार्क लाइन पैरामीटर को अनुकूलित करें ताकि वे ट्रेड की गई किस्मों की विशेषताओं के अनुरूप हों
क्लाउड बैंड पैरामीटर को अनुकूलित करें ताकि क्लाउड बैंड लंबी अवधि के रुझानों को अधिक सटीक रूप से निर्धारित कर सके
ऑप्टिमाइज़्ड स्टॉप-लॉस एल्गोरिदम, जैसे कि एटीआर के अनुसार स्टॉप-सेट या डायनामिक स्टॉप-लॉस
अन्य संकेतकों के साथ संयोजन में सिग्नल फ़िल्टरिंग, अधिक फ़िल्टरिंग स्थितियों को कॉन्फ़िगर करना, गलत प्रवेश की संभावना को कम करना
अनुकूलित लाभ-हानि अनुपात सेटिंग्स, विभिन्न किस्मों और चक्रों पर रणनीति को अनुकूलित करना
मार्टिन्गेल पद्धति का उपयोग करके विभिन्न बाजार उतार-चढ़ाव की आवृत्ति के लिए स्थिति का प्रबंधन करना
उच्च स्थिरता के लिए पैरामीटर को अनुकूलित करने के लिए मशीन सीखने के तरीकों का उपयोग करना
विभिन्न ट्रेडिंग समय सीमाएं सेट करें, जो रात के डिस्क और डिस्क के बीच की स्थिति के लिए अनुकूलित हैं
सुपर 1 रणनीति समग्र रूप से एक रणनीति है जो मध्यम और लंबी रेखा प्रवृत्ति व्यापार के लिए बहुत उपयुक्त है। यह प्रवृत्ति की दिशा का आकलन करने के लिए सुपर 1 संकेतक का उपयोग करने का स्पष्ट लाभ है, जबकि कीमत में सुधार के साथ प्रवेश करने से गलत प्रवेश को प्रभावी ढंग से रोका जा सकता है। अनुकूलन पैरामीटर सेटिंग के माध्यम से, रणनीति को अधिक किस्मों और अधिक चक्रों पर स्थिर लाभप्रदता प्राप्त करने की अनुमति है। यह रणनीति समझने में आसान है और इसमें बहुत अधिक अनुकूलन स्थान है, जो रणनीति अनुसंधान और सीखने के लिए एक बुनियादी रणनीति के रूप में उपयुक्त है।
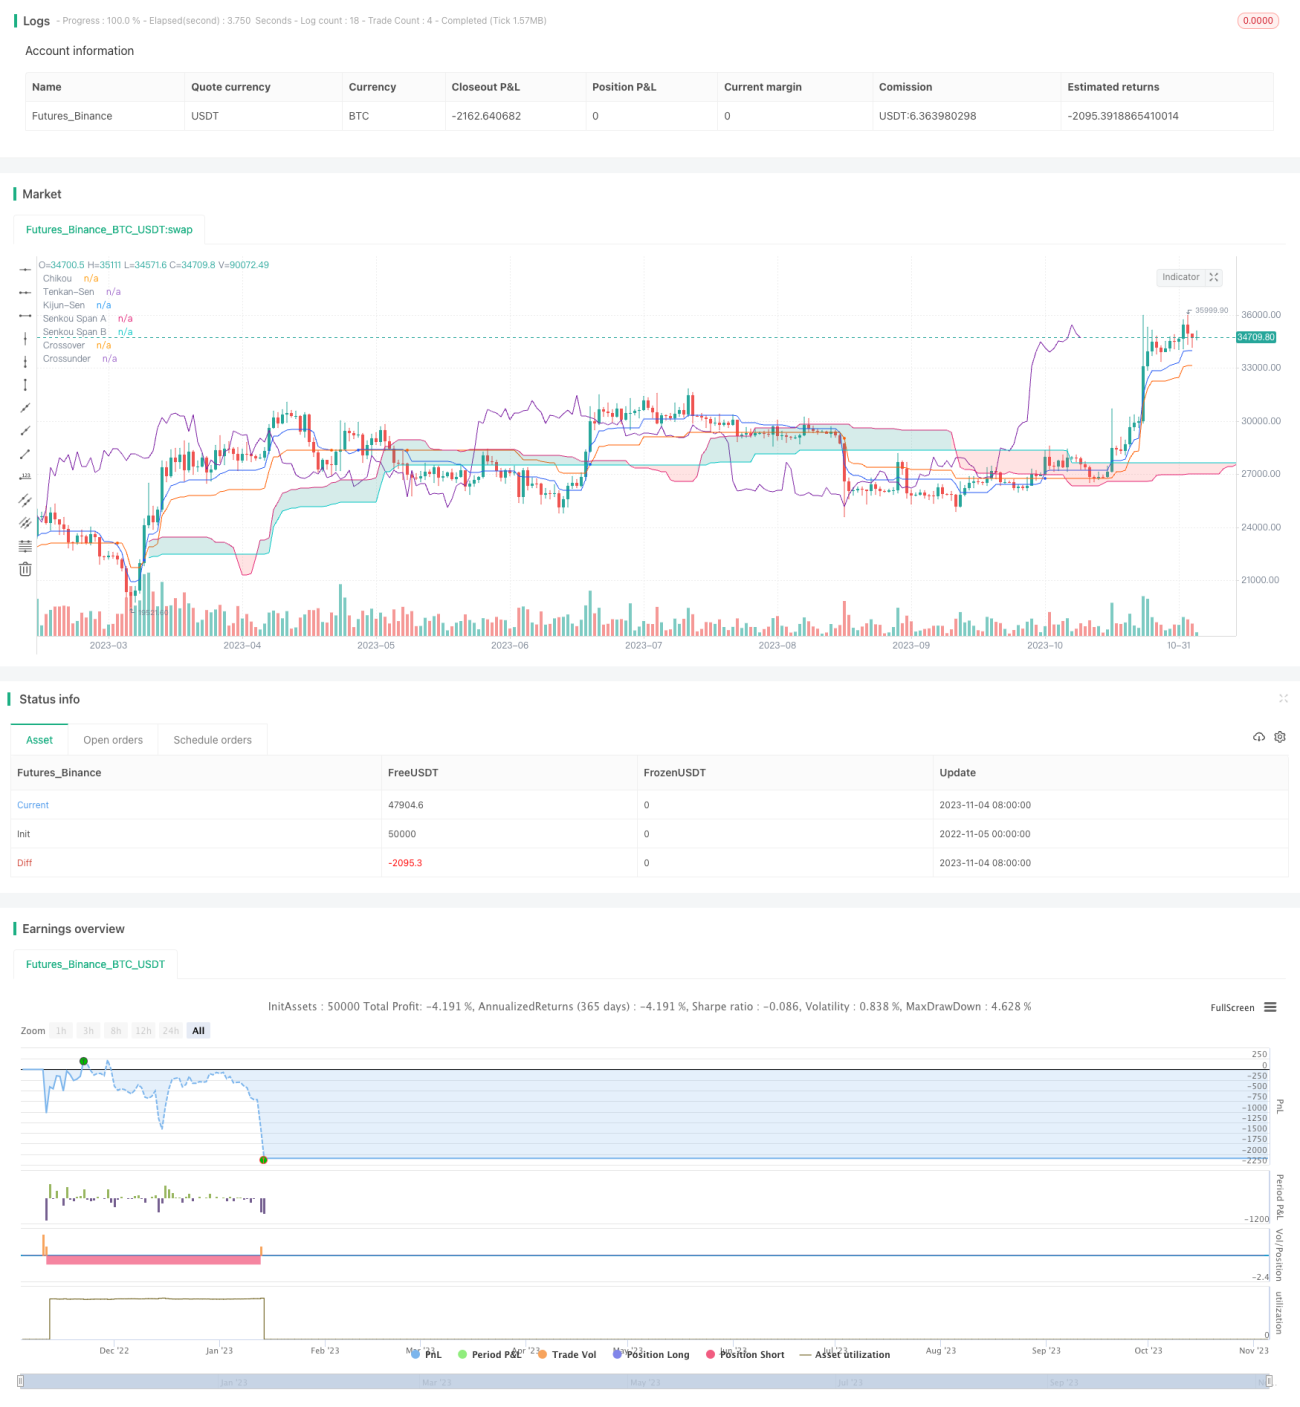
/*backtest
start: 2022-11-05 00:00:00
end: 2023-11-05 00:00:00
period: 1d
basePeriod: 1h
exchanges: [{"eid":"Futures_Binance","currency":"BTC_USDT"}]
*/
// Strategy based on the the SuperIchi indicator.
//
// Strategy was designed for the purpose of back testing.
// See strategy documentation for info on trade entry logic.
//
// Credits:
// - SuperIchi [LUX]: LuxAlgo (https://www.tradingview.com/script/vDGd9X9y-SuperIchi-LUX/)
//@version=5
strategy("SuperIchi Strategy", overlay=true, initial_capital=1000, currency=currency.NONE, max_labels_count=500, default_qty_type=strategy.cash, commission_type=strategy.commission.percent, commission_value=0.01)
// =============================================================================
// STRATEGY INPUT SETTINGS
// =============================================================================
// ---------------
// Risk Management
// ---------------
swingLength = input.int(15, "Swing High/Low Lookback Length", group='Strategy: Risk Management', tooltip='Stop Loss is calculated by the swing high or low over the previous X candles')
accountRiskPercent = input.float(2, "Account percent loss per trade", step=0.1, group='Strategy: Risk Management', tooltip='Each trade will risk X% of the account balance')
profitFactor = input.float(2, "Profit Factor (R:R Ratio)", step = 0.1, group='Strategy: Risk Management')
useAtrOverride = input.bool(true, "Use Swing High/Low ATR Override", group='Strategy: Risk Management', tooltip='In some cases price may not have a large enough (if any) swing withing previous X candles. Turn this on to use an ATR value when swing high/low is lower than the given ATR value')
atrMultiplier = input.int(1, "Swing High/Low ATR Override Multiplier", group='Strategy: Risk Management')
atrLength = input.int(14, "Swing High/Low ATR Override Length", group='Strategy: Risk Management')
// -----------------
// Strategy Settings
// -----------------
pullbackLength = input.int(5, "Pullback Lookback Length", group='Strategy: Settings', tooltip='Number of candles to consider for a pullback into the moving averages (prerequisite for trade entry)')
// ----------
// Date Range
// ----------
start_year = input.int(title='Start Date', defval=2022, minval=2010, maxval=3000, group='Strategy: Date Range', inline='1')
start_month = input.int(title='', defval=1, group='Strategy: Date Range', inline='1', options = [1, 2, 3, 4, 5, 6, 7, 8, 9, 10, 11, 12])
start_date = input.int(title='', defval=1, group='Strategy: Date Range', inline='1', options = [1, 2, 3, 4, 5, 6, 7, 8, 9, 10, 11, 12, 13, 14, 15, 16, 17, 18, 19, 20, 21, 22, 23, 24, 25, 26, 27, 28, 29, 30, 31])
end_year = input.int(title='End Date', defval=2023, minval=1800, maxval=3000, group='Strategy: Date Range', inline='2')
end_month = input.int(title='', defval=1, group='Strategy: Date Range', inline='2', options = [1, 2, 3, 4, 5, 6, 7, 8, 9, 10, 11, 12])
end_date = input.int(title='', defval=1, group='Strategy: Date Range', inline='2', options = [1, 2, 3, 4, 5, 6, 7, 8, 9, 10, 11, 12, 13, 14, 15, 16, 17, 18, 19, 20, 21, 22, 23, 24, 25, 26, 27, 28, 29, 30, 31])
in_date_range = time >= timestamp(syminfo.timezone, start_year, start_month, start_date, 0, 0) and time < timestamp(syminfo.timezone, end_year, end_month, end_date, 0, 0)
// =============================================================================
// INDICATORS
// =============================================================================
// ---------------
// SuperIchi [LUX]
// ---------------
tenkan_len = input(9,'Tenkan ',inline='SuperIchi', group='Indicator: SuperIchi Settings')
tenkan_mult = input(2.,'',inline='SuperIchi', group='Indicator: SuperIchi Settings')
kijun_len = input(26,'Kijun ',inline='SuperIchi', group='Indicator: SuperIchi Settings')
kijun_mult = input(4.,'',inline='SuperIchi', group='Indicator: SuperIchi Settings')
spanB_len = input(52,'Senkou Span B ',inline='SuperIchi', group='Indicator: SuperIchi Settings')
spanB_mult = input(6.,'',inline='SuperIchi', group='Indicator: SuperIchi Settings')
offset = input(26,'Displacement', inline='SuperIchi', group='Indicator: SuperIchi Settings')
//------------------------------------------------------------------------------
avg(src,length,mult)=>
atr = ta.atr(length)*mult
up = hl2 + atr
dn = hl2 - atr
upper = 0.,lower = 0.
upper := src[1] < upper[1] ? math.min(up,upper[1]) : up
lower := src[1] > lower[1] ? math.max(dn,lower[1]) : dn
os = 0,max = 0.,min = 0.
os := src > upper ? 1 : src < lower ? 0 : os[1]
spt = os == 1 ? lower : upper
max := ta.cross(src,spt) ? math.max(src,max[1]) : os == 1 ? math.max(src,max[1]) : spt
min := ta.cross(src,spt) ? math.min(src,min[1]) : os == 0 ? math.min(src,min[1]) : spt
math.avg(max,min)
//------------------------------------------------------------------------------
tenkan = avg(close,tenkan_len,tenkan_mult)
kijun = avg(close,kijun_len,kijun_mult)
senkouA = math.avg(kijun,tenkan)
senkouB = avg(close,spanB_len,spanB_mult)
//------------------------------------------------------------------------------
tenkan_css = #2157f3 //blue
kijun_css = #ff5d00 //red
cloud_a = color.new(color.teal,80)
cloud_b = color.new(color.red,80)
chikou_css = #7b1fa2
plot(tenkan,'Tenkan-Sen',tenkan_css)
plot(kijun,'Kijun-Sen',kijun_css)
plot(ta.crossover(tenkan,kijun) ? kijun : na,'Crossover',#2157f3,3,plot.style_circles)
plot(ta.crossunder(tenkan,kijun) ? kijun : na,'Crossunder',#ff5d00,3,plot.style_circles)
A = plot(senkouA,'Senkou Span A',na,offset=offset-1)
B = plot(senkouB,'Senkou Span B',na,offset=offset-1)
fill(A,B,senkouA > senkouB ? cloud_a : cloud_b)
plot(close,'Chikou',chikou_css,offset=-offset+1,display=display.none)
// =============================================================================
// STRATEGY LOGIC
// =============================================================================
plotchar(kijun, "kijun", "", location = location.top)
plotchar(senkouA[offset-1], "senkouA", "", location = location.top)
plotchar(tenkan > kijun, "line above", "", location = location.top)
plotchar(close > tenkan, "price above", "", location = location.top)
plotchar(kijun > senkouA[offset-1], "above cloud", "", location = location.top)
// blue line above red line + price above both lines + both lines above cloud
longSen = tenkan > kijun and close > tenkan and kijun > senkouA[offset-1]
// red line below blue line + price below both lines + both lines below cloud
shortSen = tenkan < kijun and close < tenkan and kijun < senkouA[offset-1]
plotchar(longSen, "longSen", "", location = location.top)
plotchar(shortSen, "shortSen", "", location = location.top)
// Cloud is green
longSenkou = senkouA[offset-1] > senkouB[offset-1]
// Cloud is red
shortSenkou = senkouA[offset-1] < senkouB[offset-1]
// price must have pulled back below sen lines before entry
barsSinceLongPullback = ta.barssince(close < kijun and close < tenkan)
longPullback = barsSinceLongPullback <= pullbackLength
// price must have pulled back above sen lines before entry
barsSinceShortPullback = ta.barssince(close > kijun and close > tenkan)
shortPullback = barsSinceShortPullback <= pullbackLength
// plotchar(lowestClose, "lowestClose", "", location = location.top)
// plotchar(highestClose, "highestClose", "", location = location.top)
inLong = strategy.position_size > 0
inShort = strategy.position_size < 0
longCondition = longSen and longSenkou and longPullback and in_date_range
shortCondition = shortSen and shortSenkou and shortPullback and in_date_range
swingLow = ta.lowest(source=low, length=swingLength)
swingHigh = ta.highest(source=high, length=swingLength)
atr = useAtrOverride ? ta.atr(atrLength) * atrMultiplier : 0
longSl = math.min(close - atr, swingLow)
shortSl = math.max(close + atr, swingHigh)
longStopPercent = math.abs((1 - (longSl / close)) * 100)
shortStopPercent = math.abs((1 - (shortSl / close)) * 100)
longTpPercent = longStopPercent * profitFactor
shortTpPercent = shortStopPercent * profitFactor
longTp = close + (close * (longTpPercent / 100))
shortTp = close - (close * (shortTpPercent / 100))
// Position sizing (default risk 2% per trade)
riskAmt = strategy.equity * accountRiskPercent / 100
longQty = math.abs(riskAmt / longStopPercent * 100) / close
shortQty = math.abs(riskAmt / shortStopPercent * 100) / close
if (longCondition and not inLong)
strategy.entry("Long", strategy.long, qty=longQty)
strategy.exit("Long SL/TP", from_entry="Long", stop=longSl, limit=longTp, alert_message='Long SL Hit')
buyLabel = label.new(x=bar_index, y=high[1], color=color.green, style=label.style_label_up)
label.set_y(id=buyLabel, y=low)
label.set_tooltip(id=buyLabel, tooltip="Risk Amt: " + str.tostring(riskAmt) + "\nQty: " + str.tostring(longQty) + "\nSwing low: " + str.tostring(swingLow) + "\nStop Percent: " + str.tostring(longStopPercent) + "\nTP Percent: " + str.tostring(longTpPercent))
if (shortCondition and not inShort)
strategy.entry("Short", strategy.short, qty=shortQty)
strategy.exit("Short SL/TP", from_entry="Short", stop=shortSl, limit=shortTp, alert_message='Short SL Hit')
sellLabel = label.new(x=bar_index, y=high[1], color=color.red, style=label.style_label_up)
label.set_y(id=sellLabel, y=low)
label.set_tooltip(id=sellLabel, tooltip="Risk Amt: " + str.tostring(riskAmt) + "\nQty: " + str.tostring(shortQty) + "\nSwing high: " + str.tostring(swingHigh) + "\nStop Percent: " + str.tostring(shortStopPercent) + "\nTP Percent: " + str.tostring(shortTpPercent))