प्रवृत्ति और अस्थिरता मात्रात्मक व्यापार रणनीतियों का संयोजन
अवलोकन
एक द्वि-प्रवृत्ति शॉक रणनीति एक मात्रात्मक ट्रेडिंग रणनीति है जो प्रवृत्ति और शॉक को जोड़ती है। यह प्रवृत्ति की दिशा और ताकत की पहचान करने के लिए दो संकेतकों के संयोजन का उपयोग करती है और प्रवृत्ति के शॉक के दौरान बेहतर प्रवेश समय की तलाश करती है।
रणनीति सिद्धांत
रणनीति मुख्य रूप से दो सार्वजनिक संकेतकों का उपयोग करती हैः ट्रेंड सर्फर्स और माव्रीज़ का ट्रेंड ऑसिलेटर।
ट्रेंड सर्फर्स एक रुझान-ट्रेसिंग स्टॉप-लॉस सूचक है। यह एक निश्चित अवधि में उच्चतम और निम्नतम कीमतों की गणना करके मूल्य आंदोलन का आकलन करता है और एक अनुशंसित स्टॉप-लॉस स्थिति देता है। उदाहरण के लिए, जब कीमत नवीनतम 168 के लाइन के उच्चतम मूल्य को तोड़ती है, तो यह एक नकारात्मक संकेत है; जब कीमत नवीनतम 168 के लाइन के निम्नतम मूल्य को तोड़ती है, तो यह एक नकारात्मक संकेत है।
Mawreez’s Trend Oscillator एक द्वि-रेखीय अस्थिरता संकेतक है। यह MACD की तरह है, जो डीआई के अंतर के माध्यम से प्रवृत्ति की दिशा और ताकत का न्याय करता है। यह संकेतक वक्र 0 अक्ष के ऊपर आशावादी है, नीचे आशावादी है।
इस रणनीति के लिए ट्रेडिंग नियम इस प्रकार हैंः
मल्टी हेड एंट्रीः ट्रेंड सर्फर्स ने उच्चतम रेखा को तोड़ दिया और माव्रीज़ के ट्रेंड ऑस्सिलेटर सूचक ने पूर्वाग्रह के लिए खरीदा खोखले प्रवेशः ट्रेंड सर्फर्स ने निचली रेखा को तोड़ दिया और माव्रीज के ट्रेंड ऑसिलेटर ने इसे गिरा दिया
स्टॉप लॉस ट्रेंड फॉलो स्टॉप लॉस प्लस फिक्स्ड स्टॉप लॉस
श्रेष्ठता विश्लेषण
इस रणनीति में ट्रेंड और शॉक इंडिकेटर शामिल हैं, जो ट्रेंड को पकड़ने और शॉक के बीच बेहतर कीमतों को खोजने के लिए सक्षम हैं, जिसमें निम्नलिखित फायदे हैंः
- डबल इंडिकेटर फ़िल्टरिंग, झूठी दरारों से बचने के लिए प्रभावी
- प्रवृत्ति और उतार-चढ़ाव के संयोजन के साथ, कीमतों को पकड़ने के लिए आसान है, जो कि उतार-चढ़ाव के बीच में एक कम-अंतराल वाली पिकअप लेआउट या उच्च-अंतराल वाली हल्की स्टॉकिंग है
- मल्टीपल स्टॉप लॉस के साथ, जोखिम को अच्छी तरह से नियंत्रित किया जा सकता है
जोखिम विश्लेषण
इस रणनीति के कुछ जोखिम भी हैं:
- दोहरे सूचकांक संयोजन
- ट्रेंड इंडिकेटर और शेक इंडिकेटर के बीच संघर्ष हो सकता है
- फिक्स्ड स्टॉप लॉस समय से पहले बंद हो सकता है
इन जोखिमों से बचने के लिए, निम्नलिखित उपाय किए जा सकते हैंः
- सूचकांक मापदंडों को उचित रूप से ढीला करना, कम आवृत्ति
- ट्रेंड को समझने के लिए नियम जोड़ें, और सूचकांक के संघर्ष से बचें
- गतिशील समायोजन रोक स्थान
अनुकूलन दिशा
इस रणनीति को और भी बेहतर बनाने के लिए जगह हैः
- विभिन्न संयोजनों और चक्रों का परीक्षण करें, सबसे अच्छा खोजें
- अस्थिरता, लेन-देन की मात्रा आदि जैसे सहायक निर्णय नियम
- मशीन लर्निंग तकनीक का उपयोग करके गतिशील अनुकूलन के संकेतक और पैरामीटर
संक्षेप
द्वि-प्रवृत्ति आघात रणनीतियों का व्यापक उपयोग ट्रेंड ट्रैकिंग और आघात संकेतकों का लाभ, प्रवृत्ति की दिशा की पहचान करने के साथ-साथ आघात के अवसरों को पकड़ने के लिए, पैरामीटर और नियमों के अनुकूलन के माध्यम से, रणनीति की लाभप्रदता को और बढ़ाया जा सकता है। इस रणनीति के लिए अच्छी संभावनाएं हैं।
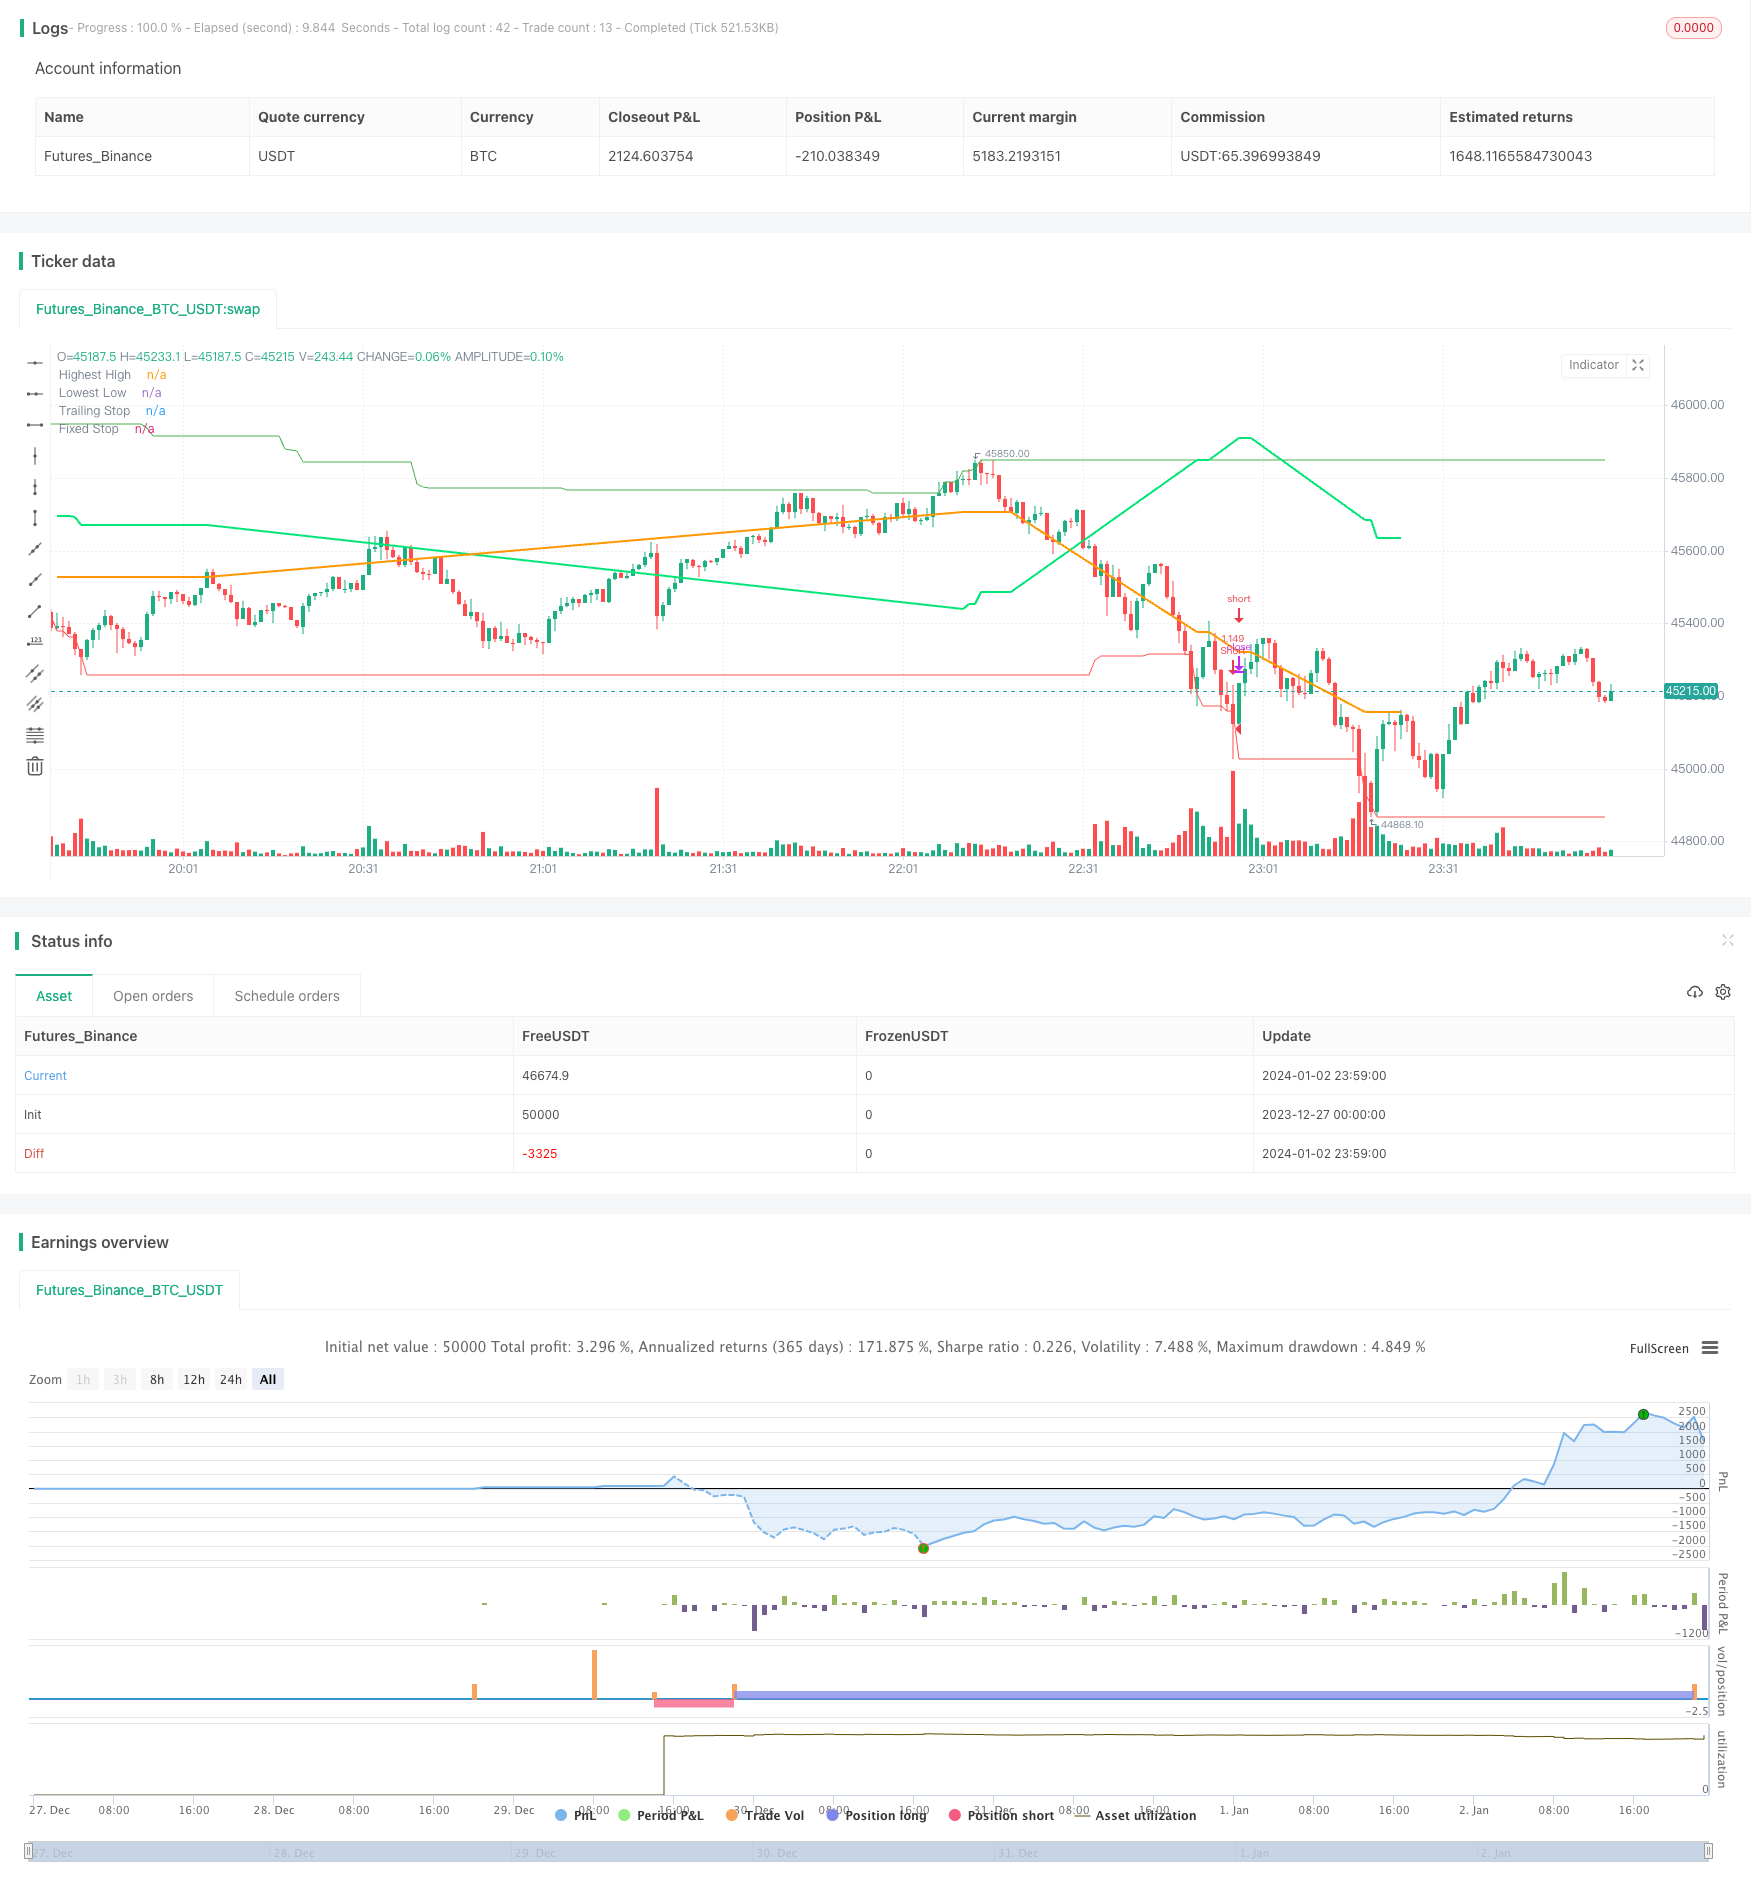
/*backtest
start: 2023-12-27 00:00:00
end: 2024-01-03 00:00:00
period: 1m
basePeriod: 1m
exchanges: [{"eid":"Futures_Binance","currency":"BTC_USDT"}]
*/

// This source code is subject to the terms of the Mozilla Public License 2.0 at https://mozilla.org/MPL/2.0/
// © myn

//@version=5
strategy('Strategy Myth-Busting #8 - TrendSurfers+TrendOsc - [MYN]', max_bars_back=5000, overlay=true, pyramiding=0, initial_capital=20000, currency='USD', default_qty_type=strategy.percent_of_equity, default_qty_value=100.0, commission_value=0.075, use_bar_magnifier = false)

/////////////////////////////////////
//* Put your strategy logic below *//
/////////////////////////////////////
//cAe9It4ynO4


// Strategies
// Trend Surfers - Premium Indicator
// Mawreez' Trend Oscillator Indicator

// Trading Setup / Rules


// Long Condition
// Trend Surfers Trailing stop line goes below (Crosses) lowest low
// Bullish Candle (red)
// Mawreeze Trend Oscilator Indicator is green


// Short Condition

// Trend Surfers Trailing stop line goes above (Crosses) highest high
// Bearish Candle (red)
// Mawreeze Trend Oscilator Indicator is red

// Stop loss middle between high and low Risk 1:2


//@version=5
//strategy(shorttitle='Trend Surfers - Breakout', title='Trend Surfers - Premium Breakout', overlay=true, calc_on_every_tick=false, initial_capital=100000, default_qty_type=strategy.percent_of_equity, default_qty_value=100, commission_type='percent', commission_value=0.04)

// Risk for position and pyramid
maxriskval = input.float(2, 'Max % risk', tooltip='Risk % over total equity / Position', group='Risk Management')
pairnumber = input.int(title='How many pairs', defval=1, tooltip='How many pairs are you trading with the strategy?', group='Risk Management')

// Emtry Exit
highPeriod = input.int(title='Highest High Period', defval=168, tooltip='Highest High of X bars - This will trigger a Long Entry when close is above. (Thin Green Line)', group='Entry Condition')
lowPeriod = input.int(title='Lowest Low Period', defval=168, tooltip='Lowest low of X bars - This will trigger a Short Entry when close is under. (Thin Red Line)', group='Entry Condition')
// Stoploss
trailingAtrPeriod = input.int(title='Trailing ATR Pediod', defval=10, tooltip='Average True Range for the Trailing Stop. (Thick Green Line) ', group='Exit Condition')
trailingAtrMultiplier = input.float(title='Trailing ATR Multiplier', defval=8, group='Exit Condition')
fixAtrPeriod = input.int(title='Fix ATR Pediod', defval=10, tooltip='Average True Range for the Fix Stoloss. (Thick Yellow Line)', group='Exit Condition')
fixAtrMultiplier = input.float(title='Fix ATR Multiplier', defval=2, group='Exit Condition')
// Pair info
pair = syminfo.basecurrency + syminfo.currency

// High Low Variable
highestHigh = ta.highest(high, highPeriod)[1]
lowestLow = ta.lowest(low, lowPeriod)[1]
trailingAtr = ta.atr(trailingAtrPeriod) * trailingAtrMultiplier

// Trade Condition
longConditionTrendSurfers = ta.crossover(close, highestHigh)
shortConditionTrendSurfers = ta.crossunder(close, lowestLow)

// Risk Variable
fixAtr = ta.atr(fixAtrPeriod) * fixAtrMultiplier
stopvaluelong = close[1] - fixAtr[1]
stopvalueshort = close[1] + fixAtr[1]

// Position size Long
maxpossize = strategy.equity / close
positionsizelong = maxriskval / 100 * strategy.equity / (close - stopvaluelong)
stopperclong = (close - stopvaluelong) / close * 100
leveragelong = math.max(1, math.ceil(positionsizelong / maxpossize)) * 2
posperclong = positionsizelong * close / strategy.equity * 100 / leveragelong / pairnumber
realposlong = posperclong / 100 * strategy.equity * leveragelong / close

// Position size Short
positionsizeshort = maxriskval / 100 * strategy.equity / (stopvalueshort - close)
stoppercshort = (close - stopvalueshort) / close * 100
leverageshort = math.max(1, math.ceil(positionsizeshort / maxpossize)) * 2
pospercshort = positionsizeshort * close / strategy.equity * 100 / leverageshort / pairnumber
realposshort = pospercshort / 100 * strategy.equity * leverageshort / close

// Alert Message
entry_long_message = '\nGo Long for ' + pair + 'NOW!' + '\nPosition Size % =' + str.tostring(posperclong) + '\nLeverage' + str.tostring(leveragelong) + '\nStoploss Price =' + str.tostring(stopvaluelong) + '\nClose any Short position that are open for ' + pair + '!' + '\n\nVisit TrendSurfersSignals.com' + '\nFor automated premium signals (FREE)'

entry_short_message = '\nGo Short for ' + pair + 'NOW!' + '\nPosition Size % =' + str.tostring(pospercshort) + '\nLeverage' + str.tostring(leverageshort) + '\nStoploss Price =' + str.tostring(stopvalueshort) + '\nClose any Long position that are open for ' + pair + '!' + '\n\nVisit TrendSurfersSignals.com' + '\nFor automated premium signals (FREE)'

exit_short_message = '\nExit Short for ' + pair + 'NOW!' + '\n\nVisit TrendSurfersSignals.com' + '\nFor automated premium signals (FREE)'

exit_long_message = '\nExit Long for ' + pair + 'NOW!' + '\n\nVisit TrendSurfersSignals.com' + '\nFor automated premium signals (FREE)'
// Order
// if longCondition
//     strategy.entry('Long', strategy.long, stop=highestHigh, comment='Long', qty=realposlong, alert_message=entry_long_message)
// if shortCondition
//     strategy.entry('Short', strategy.short, stop=lowestLow, comment='Short', qty=realposshort, alert_message=entry_short_message)

// Stoploss Trailing
longTrailing = close - trailingAtr
shortTrailing = close + trailingAtr

var longTrailingStop = 0.0
var shortTrailingStop = 999999.9

trailingStopLine = 0.0
trailingStopLine := na
fixedStopLine = 0.0
fixedStopLine := na
var inTrade = 0
if longConditionTrendSurfers or shortConditionTrendSurfers
    if 0 == inTrade
        if longConditionTrendSurfers
            inTrade := 1
            inTrade
        else
            inTrade := -1
            inTrade
if 1 == inTrade and (shortConditionTrendSurfers or low <= math.max(fixedStopLine[1], longTrailingStop))
    inTrade := 0
    inTrade
if -1 == inTrade and (longConditionTrendSurfers or high >= math.min(fixedStopLine[1], shortTrailingStop))
    inTrade := 0
    inTrade

longTrailingStop := if 1 == inTrade
    stopValue = longTrailing
    math.max(stopValue, longTrailingStop[1])
else
    0

shortTrailingStop := if -1 == inTrade
    stopValue = shortTrailing
    math.min(stopValue, shortTrailingStop[1])
else
    999999

// Fix Stoploss
firstPrice = 0.0
firstFixAtr = 0.0
firstPrice := na
firstFixAtr := na
if 0 != inTrade
    firstPrice := ta.valuewhen(inTrade != inTrade[1] and 0 != inTrade, close, 0)
    firstFixAtr := ta.valuewhen(inTrade != inTrade[1] and 0 != inTrade, fixAtr, 0)
    if 1 == inTrade
        fixedStopLine := firstPrice - firstFixAtr
        trailingStopLine := longTrailingStop
        trailingStopLine
    else
        fixedStopLine := firstPrice + firstFixAtr
        trailingStopLine := shortTrailingStop
        trailingStopLine

// if strategy.position_size > 0
//     strategy.exit(id='L Stop', stop=math.max(fixedStopLine, longTrailingStop), alert_message=exit_long_message)

// if strategy.position_size < 0
//     strategy.exit(id='S Stop', stop=math.min(fixedStopLine, shortTrailingStop), alert_message=exit_short_message)


// Plot
plot(highestHigh, color=color.new(color.green, 0), linewidth=1, title='Highest High')
plot(lowestLow, color=color.new(color.red, 0), linewidth=1, title='Lowest Low')
plot(trailingStopLine, color=color.new(color.lime, 0), linewidth=2, offset=1, title='Trailing Stop')
plot(fixedStopLine, color=color.new(color.orange, 0), linewidth=2, offset=1, title='Fixed Stop')

// Trend Surfers Trailing stop line goes above (Crossesover) highest high
// Bearish Candle (red)
// Mawreeze Trend Oscilator Indicator is red

trendSurfersShortEntry = trailingStopLine > highestHigh and close < close[1]
trendSurfersLongEntry = trailingStopLine < lowestLow and close > close[1]


//@version=5

// Taken from the TradingView house rules regarding scripts:

// "All open source scripts that do not mention a specific open source license
// in their comments are licensed under the Mozilla Public License 2.0.
// Following the Mozilla License, any script reusing open source code originally
// published by someone else must also be open source, unless specific
// permission is granted by the original author."

//indicator('Mawreez\' Trend Oscillator', precision=3)

len = input.int(title='DI Length', minval=1, defval=14)
sens = input.float(title='Sensitivity', defval=25)

// Lag-free smoothing of a given series
smooth(series, len) =>
    f28 = ta.ema(series, len)
    f30 = ta.ema(f28, len)
    vC = f28 * 1.5 - f30 * 0.5
    f38 = ta.ema(vC, len)
    f40 = ta.ema(f38, len)
    v10 = f38 * 1.5 - f40 * 0.5
    f48 = ta.ema(v10, len)
    f50 = ta.ema(f48, len)
    f48 * 1.5 - f50 * 0.5

// Constructing the +DI and -DI
up = ta.change(high)
down = -ta.change(low)
plus_dm = up > 0 and up > down ? up : 0
minus_dm = down > 0 and down > up ? down : 0
range_1 = ta.rma(ta.tr, len)
plus_di = smooth(ta.rma(plus_dm, len) / range_1, 3)
minus_di = smooth(ta.rma(minus_dm, len) / range_1, 3)

// Constructing and plotting the modified ADX
adj_adx = 100 * math.abs(plus_di - minus_di) / (plus_di + minus_di) - sens
adj_adx := (minus_di > plus_di ? -1 : 1) * (adj_adx < 0 ? 0 : adj_adx)
//plot(smooth(adj_adx, 3), color=plus_di > minus_di ? color.green : color.red, style=plot.style_columns)

trendOscShortEntry = plus_di < minus_di
trendOscLongEntry = plus_di > minus_di


//////////////////////////////////////
//* Put your strategy rules below *//
/////////////////////////////////////

longCondition = trendSurfersLongEntry and trendOscLongEntry
shortCondition = trendSurfersShortEntry and trendOscShortEntry

//define as 0 if do not want to use
closeLongCondition = 0
closeShortCondition = 0


// ADX
//░░░░░░░░░░░░░░░░░░░░░░░░░░░░░░░░░░░░░░░░░░░░░░░░░░░░░░░░░░░░░░░░░░░░░░░░░░░░░░░░░░░░░░░░░░░░░░░░░░░░░░░░░░░░░░░░░░░░░░░░░░░░░░░░░░░░░░░░░░░░░░░░░░

adxEnabled = input.bool(defval = false , title = "Average Directional Index (ADX)", tooltip = "", group ="ADX" )
adxlen = input(14, title="ADX Smoothing", group="ADX")
adxdilen = input(14, title="DI Length", group="ADX")
adxabove = input(25, title="ADX Threshold", group="ADX")

adxdirmov(len) =>
	adxup = ta.change(high)
	adxdown = -ta.change(low)
	adxplusDM = na(adxup) ? na : (adxup > adxdown and adxup > 0 ? adxup : 0)
	adxminusDM = na(adxdown) ? na : (adxdown > adxup and adxdown > 0 ? adxdown : 0)
	adxtruerange = ta.rma(ta.tr, len)
	adxplus = fixnan(100 * ta.rma(adxplusDM, len) / adxtruerange)
	adxminus = fixnan(100 * ta.rma(adxminusDM, len) / adxtruerange)
	[adxplus, adxminus]
adx(adxdilen, adxlen) =>
	[adxplus, adxminus] = adxdirmov(adxdilen)
	adxsum = adxplus + adxminus
	adx = 100 * ta.rma(math.abs(adxplus - adxminus) / (adxsum == 0 ? 1 : adxsum), adxlen)

adxsig = adxEnabled ? adx(adxdilen, adxlen) : na
isADXEnabledAndAboveThreshold = adxEnabled ? (adxsig > adxabove) : true

//Backtesting Time Period (Input.time not working as expected as of 03/30/2021.  Giving odd start/end dates
//░░░░░░░░░░░░░░░░░░░░░░░░░░░░░░░░░░░░░░░░░░░░░░░░░░░░░░░░░░░░░░░░░░░░░░░░░░░░░░░░░░░░░░░░░░░░░░░░░░░░░░░░░░░░░░░░░░░░░░░░░░░░░░░░░░░░░░░░░░░░░░░░░░
useStartPeriodTime = input.bool(true, 'Start', group='Date Range', inline='Start Period')
startPeriodTime = input(timestamp('1 Jan 2019'), '', group='Date Range', inline='Start Period')
useEndPeriodTime = input.bool(true, 'End', group='Date Range', inline='End Period')
endPeriodTime = input(timestamp('31 Dec 2030'), '', group='Date Range', inline='End Period')

start = useStartPeriodTime ? startPeriodTime >= time : false
end = useEndPeriodTime ? endPeriodTime <= time : false
calcPeriod = true

// Trade Direction
// ░░░░░░░░░░░░░░░░░░░░░░░░░░░░░░░░░░░░░░░░░░░░░░░░░░░░░░░░░░░░░░░░░░░░░░░░░░░░░░░░░░░░░░░░░░░░░░░░░░░░░░░░░░░░░░░░░░░░░░░░░░░░░░░░░░░░░░░░░░░░░░░░░░
tradeDirection = input.string('Long and Short', title='Trade Direction', options=['Long and Short', 'Long Only', 'Short Only'], group='Trade Direction')

// Percent as Points
// ░░░░░░░░░░░░░░░░░░░░░░░░░░░░░░░░░░░░░░░░░░░░░░░░░░░░░░░░░░░░░░░░░░░░░░░░░░░░░░░░░░░░░░░░░░░░░░░░░░░░░░░░░░░░░░░░░░░░░░░░░░░░░░░░░░░░░░░░░░░░░░░░░░
per(pcnt) =>
    strategy.position_size != 0 ? math.round(pcnt / 100 * strategy.position_avg_price / syminfo.mintick) : float(na)

// Take profit 1
// ░░░░░░░░░░░░░░░░░░░░░░░░░░░░░░░░░░░░░░░░░░░░░░░░░░░░░░░░░░░░░░░░░░░░░░░░░░░░░░░░░░░░░░░░░░░░░░░░░░░░░░░░░░░░░░░░░░░░░░░░░░░░░░░░░░░░░░░░░░░░░░░░░░
tp1 = input.float(title='Take Profit 1 - Target %', defval=100, minval=0.0, step=0.5, group='Take Profit', inline='Take Profit 1')
q1 = input.int(title='% Of Position', defval=100, minval=0, group='Take Profit', inline='Take Profit 1')

// Take profit 2
// ░░░░░░░░░░░░░░░░░░░░░░░░░░░░░░░░░░░░░░░░░░░░░░░░░░░░░░░░░░░░░░░░░░░░░░░░░░░░░░░░░░░░░░░░░░░░░░░░░░░░░░░░░░░░░░░░░░░░░░░░░░░░░░░░░░░░░░░░░░░░░░░░░░
tp2 = input.float(title='Take Profit 2 - Target %', defval=100, minval=0.0, step=0.5, group='Take Profit', inline='Take Profit 2')
q2 = input.int(title='% Of Position', defval=100, minval=0, group='Take Profit', inline='Take Profit 2')

// Take profit 3
// ░░░░░░░░░░░░░░░░░░░░░░░░░░░░░░░░░░░░░░░░░░░░░░░░░░░░░░░░░░░░░░░░░░░░░░░░░░░░░░░░░░░░░░░░░░░░░░░░░░░░░░░░░░░░░░░░░░░░░░░░░░░░░░░░░░░░░░░░░░░░░░░░░░
tp3 = input.float(title='Take Profit 3 - Target %', defval=100, minval=0.0, step=0.5, group='Take Profit', inline='Take Profit 3')
q3 = input.int(title='% Of Position', defval=100, minval=0, group='Take Profit', inline='Take Profit 3')

// Take profit 4
// ░░░░░░░░░░░░░░░░░░░░░░░░░░░░░░░░░░░░░░░░░░░░░░░░░░░░░░░░░░░░░░░░░░░░░░░░░░░░░░░░░░░░░░░░░░░░░░░░░░░░░░░░░░░░░░░░░░░░░░░░░░░░░░░░░░░░░░░░░░░░░░░░░░
tp4 = input.float(title='Take Profit 4 - Target %', defval=100, minval=0.0, step=0.5, group='Take Profit')

/// Stop Loss
// ░░░░░░░░░░░░░░░░░░░░░░░░░░░░░░░░░░░░░░░░░░░░░░░░░░░░░░░░░░░░░░░░░░░░░░░░░░░░░░░░░░░░░░░░░░░░░░░░░░░░░░░░░░░░░░░░░░░░░░░░░░░░░░░░░░░░░░░░░░░░░░░░░░
stoplossPercent = input.float(title='Stop Loss (%)', defval=999, minval=0.01, group='Stop Loss') * 0.01
slLongClose = close < strategy.position_avg_price * (1 - stoplossPercent)
slShortClose = close > strategy.position_avg_price * (1 + stoplossPercent)

/// Leverage
// ░░░░░░░░░░░░░░░░░░░░░░░░░░░░░░░░░░░░░░░░░░░░░░░░░░░░░░░░░░░░░░░░░░░░░░░░░░░░░░░░░░░░░░░░░░░░░░░░░░░░░░░░░░░░░░░░░░░░░░░░░░░░░░░░░░░░░░░░░░░░░░░░░░
leverage = input.float(1, 'Leverage', step=.5, group='Leverage')
contracts = math.min(math.max(.000001, strategy.equity / close * leverage), 1000000000)


/// Trade State Management
// ░░░░░░░░░░░░░░░░░░░░░░░░░░░░░░░░░░░░░░░░░░░░░░░░░░░░░░░░░░░░░░░░░░░░░░░░░░░░░░░░░░░░░░░░░░░░░░░░░░░░░░░░░░░░░░░░░░░░░░░░░░░░░░░░░░░░░░░░░░░░░░░░░░

isInLongPosition = strategy.position_size > 0
isInShortPosition = strategy.position_size < 0

/// ProfitView Alert Syntax String Generation
// ░░░░░░░░░░░░░░░░░░░░░░░░░░░░░░░░░░░░░░░░░░░░░░░░░░░░░░░░░░░░░░░░░░░░░░░░░░░░░░░░░░░░░░░░░░░░░░░░░░░░░░░░░░░░░░░░░░░░░░░░░░░░░░░░░░░░░░░░░░░░░░░░░░

alertSyntaxPrefix = input.string(defval='CRYPTANEX_99FTX_Strategy-Name-Here', title='Alert Syntax Prefix', group='ProfitView Alert Syntax')
alertSyntaxBase = alertSyntaxPrefix + '\n#' + str.tostring(open) + ',' + str.tostring(high) + ',' + str.tostring(low) + ',' + str.tostring(close) + ',' + str.tostring(volume) + ','


/// Trade Execution
// ░░░░░░░░░░░░░░░░░░░░░░░░░░░░░░░░░░░░░░░░░░░░░░░░░░░░░░░░░░░░░░░░░░░░░░░░░░░░░░░░░░░░░░░░░░░░░░░░░░░░░░░░░░░░░░░░░░░░░░░░░░░░░░░░░░░░░░░░░░░░░░░░░░

longConditionCalc = (longCondition and isADXEnabledAndAboveThreshold)
shortConditionCalc = (shortCondition and isADXEnabledAndAboveThreshold)

if calcPeriod
    if longConditionCalc and tradeDirection != 'Short Only' and isInLongPosition == false
        strategy.entry('Long', strategy.long, qty=contracts)

        alert(message=alertSyntaxBase + 'side:long', freq=alert.freq_once_per_bar_close)

    if shortConditionCalc and tradeDirection != 'Long Only' and isInShortPosition == false
        strategy.entry('Short', strategy.short, qty=contracts)

        alert(message=alertSyntaxBase + 'side:short', freq=alert.freq_once_per_bar_close)

    //Inspired from Multiple %% profit exits example by adolgo https://www.tradingview.com/script/kHhCik9f-Multiple-profit-exits-example/
    strategy.exit('TP1', qty_percent=q1, profit=per(tp1))
    strategy.exit('TP2', qty_percent=q2, profit=per(tp2))
    strategy.exit('TP3', qty_percent=q3, profit=per(tp3))
    strategy.exit('TP4', profit=per(tp4))

    strategy.close('Long', qty_percent=100, comment='SL Long', when=slLongClose)
    strategy.close('Short', qty_percent=100, comment='SL Short', when=slShortClose)

    strategy.close_all(when=closeLongCondition or closeShortCondition, comment='Close Postion')

/// Dashboard
// ░░░░░░░░░░░░░░░░░░░░░░░░░░░░░░░░░░░░░░░░░░░░░░░░░░░░░░░░░░░░░░░░░░░░░░░░░░░░░░░░░░░░░░░░░░░░░░░░░░░░░░░░░░░░░░░░░░░░░░░░░░░░░░░░░░░░░░░░░░░░░░░░░░
// Inspired by https://www.tradingview.com/script/uWqKX6A2/ - Thanks VertMT

showDashboard = input.bool(group="Dashboard", title="Show Dashboard", defval=false)

f_fillCell(_table, _column, _row, _title, _value, _bgcolor, _txtcolor) =>
    _cellText = _title + "\n" + _value
    table.cell(_table, _column, _row, _cellText, bgcolor=_bgcolor, text_color=_txtcolor, text_size=size.auto)

// Draw dashboard table
if showDashboard
    var bgcolor = color.new(color.black,0)

    // Keep track of Wins/Losses streaks
    newWin  = (strategy.wintrades  > strategy.wintrades[1]) and (strategy.losstrades == strategy.losstrades[1]) and (strategy.eventrades == strategy.eventrades[1])
    newLoss = (strategy.wintrades == strategy.wintrades[1]) and (strategy.losstrades  > strategy.losstrades[1]) and (strategy.eventrades == strategy.eventrades[1])

    varip int winRow     = 0
    varip int lossRow    = 0
    varip int maxWinRow  = 0
    varip int maxLossRow = 0

    if newWin
        lossRow := 0
        winRow := winRow + 1
    if winRow > maxWinRow
        maxWinRow := winRow

    if newLoss
        winRow := 0
        lossRow := lossRow + 1
    if lossRow > maxLossRow
        maxLossRow := lossRow


    // Prepare stats table
    var table dashTable = table.new(position.bottom_right, 1, 15, border_width=1)


    if barstate.islastconfirmedhistory
        // Update table
        dollarReturn = strategy.netprofit
        f_fillCell(dashTable, 0, 0, "Start:", str.format("{0,date,long}", strategy.closedtrades.entry_time(0)) , bgcolor, color.white) // + str.format(" {0,time,HH:mm}", strategy.closedtrades.entry_time(0))
        f_fillCell(dashTable, 0, 1, "End:", str.format("{0,date,long}", strategy.opentrades.entry_time(0)) , bgcolor, color.white) // + str.format(" {0,time,HH:mm}", strategy.opentrades.entry_time(0))
        _profit = (strategy.netprofit / strategy.initial_capital) * 100
        f_fillCell(dashTable, 0, 2, "Net Profit:", str.tostring(_profit, '##.##') + "%", _profit > 0 ? color.green : color.red, color.white)
        _numOfDaysInStrategy = (strategy.opentrades.entry_time(0) - strategy.closedtrades.entry_time(0)) / (1000 * 3600 * 24)
        f_fillCell(dashTable, 0, 3, "Percent Per Day", str.tostring(_profit / _numOfDaysInStrategy, '#########################.#####')+"%", _profit > 0 ? color.green : color.red, color.white)
        _winRate = ( strategy.wintrades / strategy.closedtrades ) * 100
        f_fillCell(dashTable, 0, 4, "Percent Profitable:", str.tostring(_winRate, '##.##') + "%", _winRate < 50 ? color.red : _winRate < 75 ? #999900 : color.green, color.white)
        f_fillCell(dashTable, 0, 5, "Profit Factor:", str.tostring(strategy.grossprofit / strategy.grossloss,  '##.###'), strategy.grossprofit > strategy.grossloss ? color.green : color.red, color.white)
        f_fillCell(dashTable, 0, 6, "Total Trades:", str.tostring(strategy.closedtrades), bgcolor, color.white)
        f_fillCell(dashTable, 0, 8, "Max Wins In A Row:", str.tostring(maxWinRow, '######') , bgcolor, color.white)
        f_fillCell(dashTable, 0, 9, "Max Losses In A Row:", str.tostring(maxLossRow, '######') , bgcolor, color.white)