समर्थन और प्रतिरोध स्विंग ट्रेडिंग रणनीति
निर्माण तिथि:
2024-01-25 15:53:06
अंत में संशोधित करें:
2024-01-25 15:53:06
कॉपी:
2
क्लिक्स:
603
1
ध्यान केंद्रित करना
1750
समर्थक
अवलोकन
यह रणनीति आरएसआई, यादृच्छिक संकेतकों के साथ एक क्रॉस-ट्रैक्शन रणनीति के साथ-साथ बियर स्लाइड पॉइंट ऑप्टिमाइज़ेशन रणनीति के साथ मिलकर ट्रेडिंग लॉजिक के सटीक नियंत्रण और सटीक स्टॉप-लॉस को प्राप्त करती है। सिग्नल ऑप्टिमाइज़ेशन को शामिल करके, ट्रेडों को बेहतर तरीके से ट्रेंड करने के लिए, धन के उचित प्रबंधन को प्राप्त करने के लिए।
रणनीति सिद्धांत
- आरएसआई सूचकांक ओवरबॉट ओवरसोल्ड क्षेत्र का आकलन करता है, जो कि यादृच्छिक सूचकांक के और डी के मूल्य के साथ गोल्डन फोर्क-डेड-फोर्क ट्रेडिंग सिग्नल बनाता है।
- K लाइनों के लिए वर्गीकरण की पहचान की शुरूआत, ट्रेंड सिग्नल का आकलन करने में सहायता, गलत ट्रेडों से बचें।
- SMA औसत रेखा प्रवृत्ति की दिशा का आकलन करने में सहायक होती है। जब अल्पकालिक औसत रेखा नीचे से ऊपर की ओर लंबी अवधि की औसत रेखा को तोड़ती है, तो यह एक bullish संकेत है।
- एक फ्लैट स्लाइड पॉइंट रणनीति, जिसमें स्टॉप-लॉस और स्टॉप-ऑफ की कीमतों को उच्चतम और निम्नतम मूल्य में उतार-चढ़ाव के आधार पर सेट किया जाता है।
श्रेष्ठता विश्लेषण
- आरएसआई सूचक पैरामीटर अनुकूलित, ओवरबॉट और ओवरसोल्ड क्षेत्रों को अच्छी तरह से निर्धारित करने के लिए, गलत ट्रेडों से बचें
- STO संकेतक पैरामीटर अनुकूलित, चिकनाई पैरामीटर को समायोजित करें, शोर को हटा दें, सिग्नल की गुणवत्ता में सुधार करें
- ट्रेडिंग सिग्नल की सटीकता सुनिश्चित करने के लिए K-लाइन एंटिटी की दिशा में परिवर्तन की पहचान करने के लिए Heikin-Ashi तकनीकी विश्लेषण का परिचय
- एसएमए औसत रेखा एक बड़ी प्रवृत्ति की दिशा का आकलन करने में मदद करती है, विपरीत ट्रेडिंग से बचती है
- स्टॉप-स्टॉप-लॉस स्लाइड-पॉइंट रणनीति के साथ, प्रति ट्रेड पर अधिकतम लाभ के लिए लॉकिंग
जोखिम विश्लेषण
- बड़े बाजारों में गिरावट जारी रहने पर, फंडों को अधिक जोखिम होता है
- लेनदेन की आवृत्ति अधिक हो सकती है, लेनदेन की लागत और स्लाइड-ऑफ लागत में वृद्धि
- आरएसआई संकेतक झूठे संकेतों के लिए अतिसंवेदनशील हैं और अन्य संकेतक के संयोजन से फ़िल्टर किया जाना चाहिए
रणनीति अनुकूलन
- आरएसआई पैरामीटर को समायोजित करें और ओवरबॉट और ओवरसोल्ड निर्णयों को अनुकूलित करें
- STO संकेतक पैरामीटर, चिकनाई और चक्र को समायोजित करें और सिग्नल की गुणवत्ता में सुधार करें
- चलती औसत चक्र को समायोजित करें और रुझान को अनुकूलित करें
- सिग्नल निर्णय की सटीकता में सुधार के लिए अधिक तकनीकी संकेतकों को शामिल करना
- स्टॉप-लॉस और स्टॉप-ऑफ अनुपात को अनुकूलित करना, एकल-व्यापार जोखिम को कम करना
संक्षेप
इस रणनीति में कई मुख्यधारा के तकनीकी संकेतकों की ताकत को एकीकृत किया गया है, जो पैरामीटर अनुकूलन और नियमों के सुधार के माध्यम से व्यापारिक संकेत गुणवत्ता और स्टॉप-स्टॉप-लॉस के संतुलन को प्राप्त करता है। इसकी कुछ सार्वभौमिकता और स्थिर लाभप्रदता है। निरंतर अनुकूलन के माध्यम से, जीत और लाभप्रदता को और बढ़ाया जा सकता है।
रणनीति स्रोत कोड
/*backtest
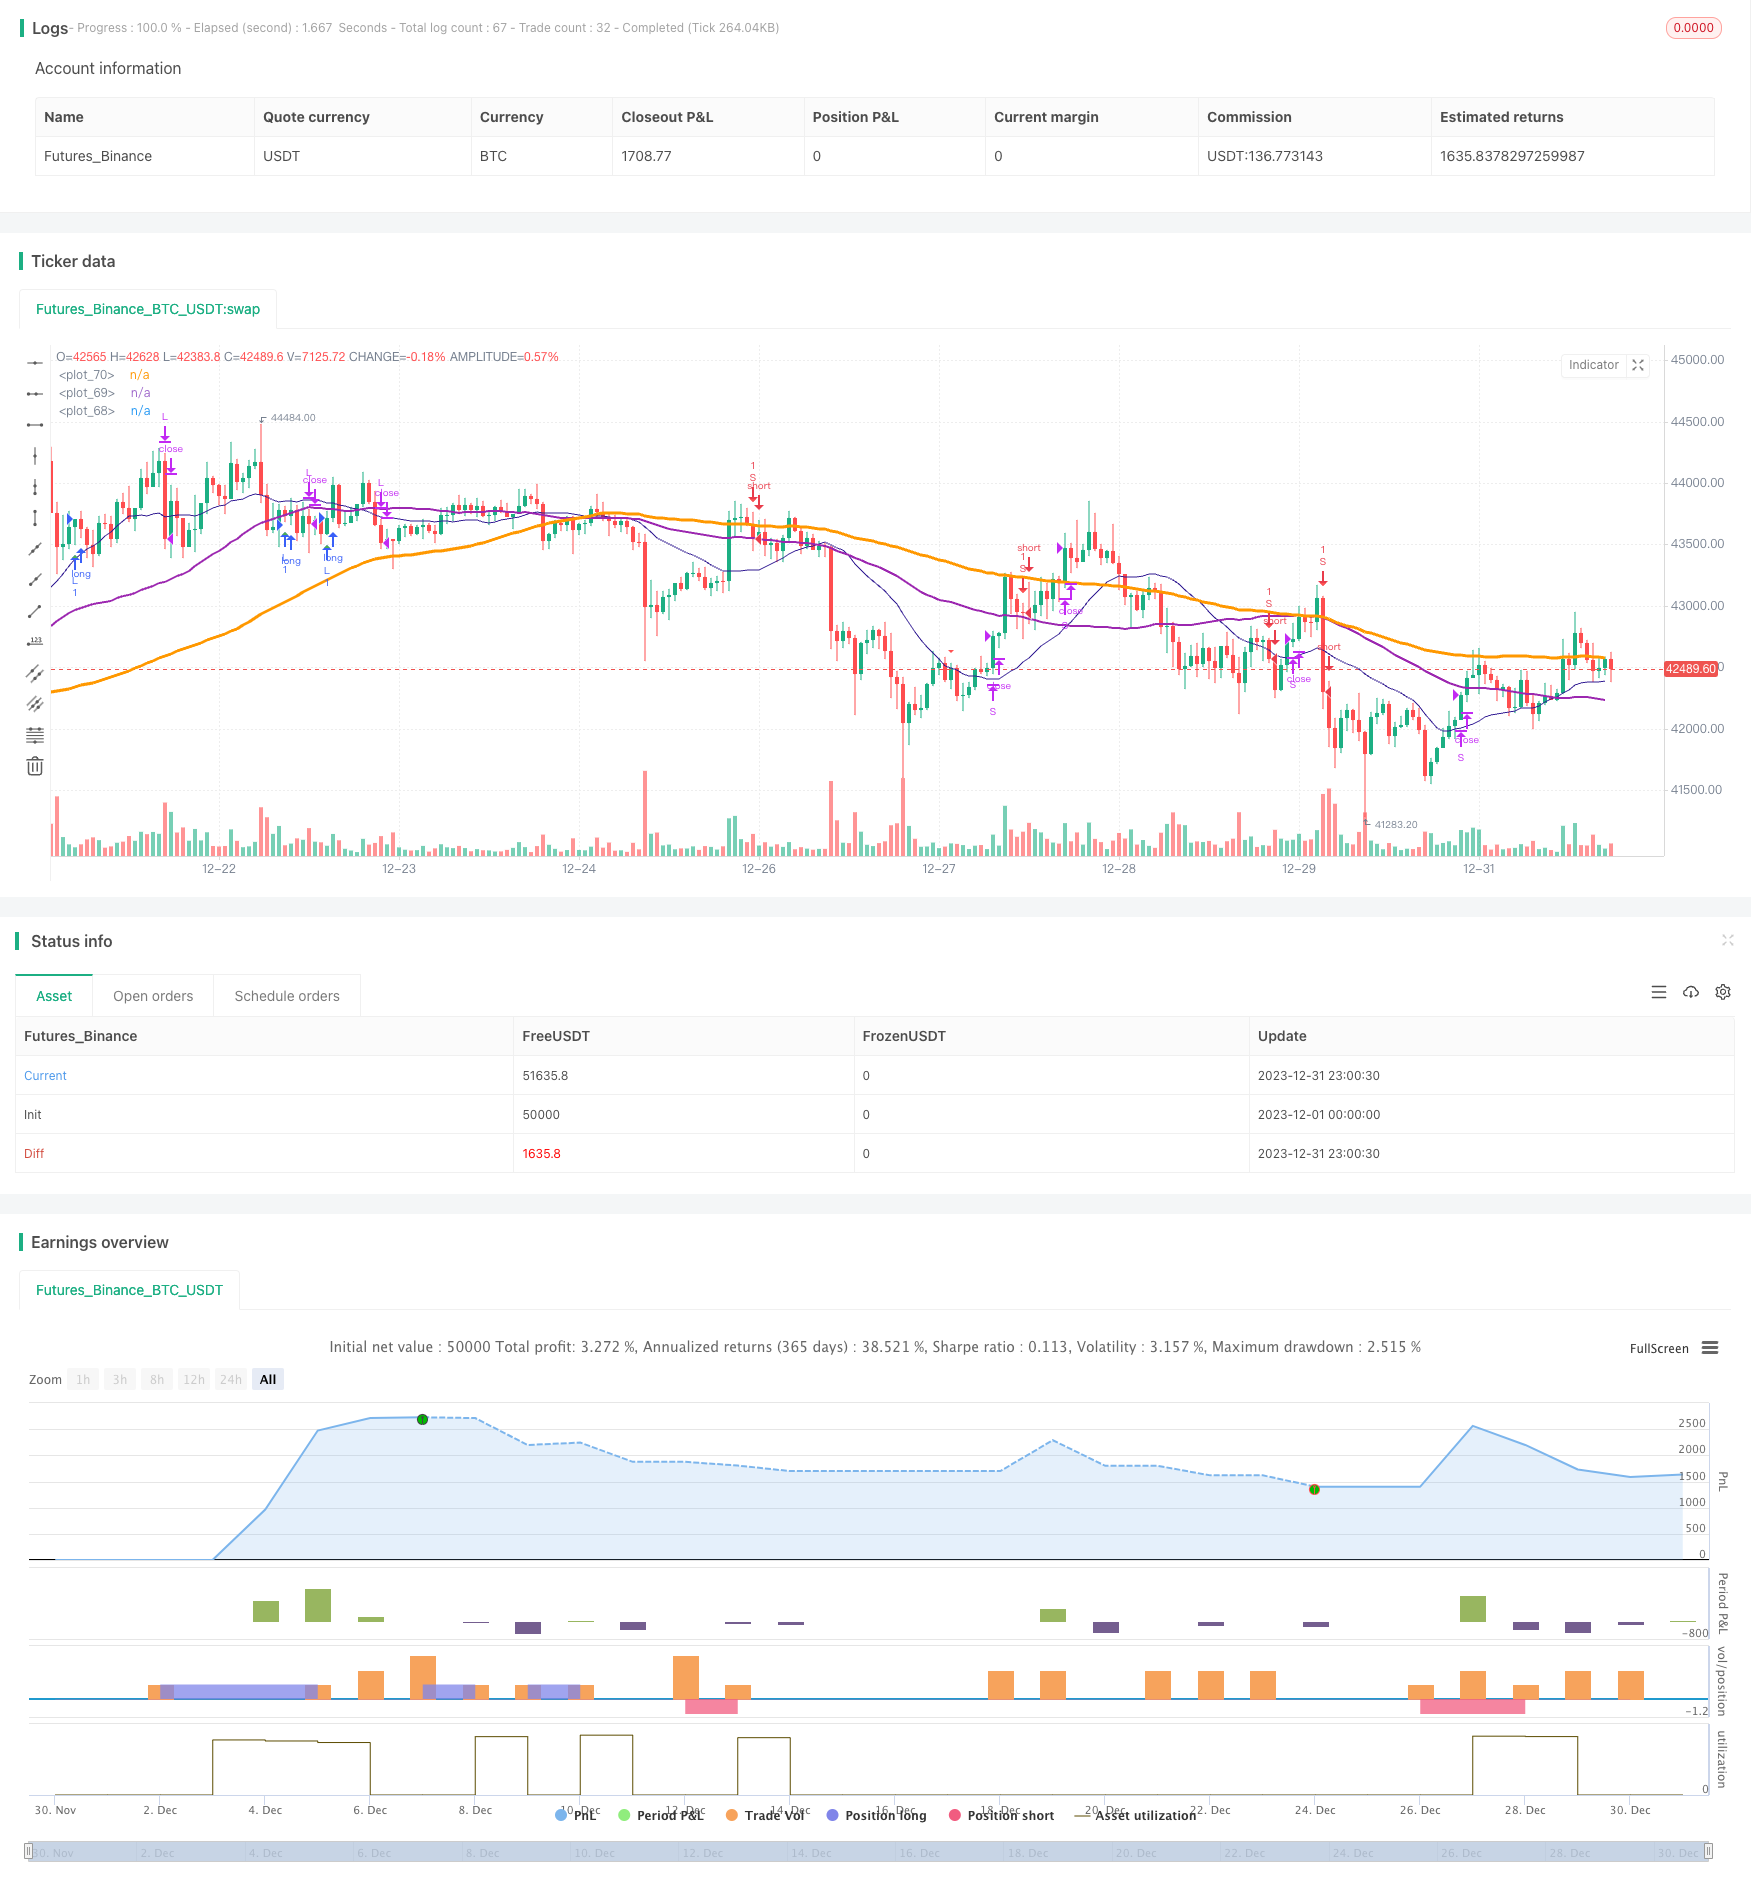
start: 2023-12-01 00:00:00
end: 2023-12-31 23:59:59
period: 1h
basePeriod: 15m
exchanges: [{"eid":"Futures_Binance","currency":"BTC_USDT"}]
*/
//@version=4
//study(title="@sentenzal strategy", shorttitle="@sentenzal strategy", overlay=true)
strategy(title="@sentenzal strategy", shorttitle="@sentenzal strategy", overlay=true )
smoothK = input(3, minval=1)
smoothD = input(3, minval=1)
lengthRSI = input(14, minval=1)
lengthStoch = input(14, minval=1)
overbought = input(80, minval=1)
oversold = input(20, minval=1)
smaLengh = input(100, minval=1)
smaLengh2 = input(50, minval=1)
smaLengh3 = input(20, minval=1)
src = input(close, title="RSI Source")
testStartYear = input(2017, "Backtest Start Year")
testStartMonth = input(1, "Backtest Start Month")
testStartDay = input(1, "Backtest Start Day")
testPeriodStart = timestamp(testStartYear,testStartMonth,testStartDay,0,0)
testPeriod() =>
time >= testPeriodStart ? true : false
rsi1 = rsi(src, lengthRSI)
k = sma(stoch(rsi1, rsi1, rsi1, lengthStoch), smoothK)
d = sma(k, smoothD)
crossBuy = crossover(k, d) and k < oversold
crossSell = crossunder(k, d) and k > overbought
dcLower = lowest(low, 10)
dcUpper = highest(high, 10)
heikinashi_close = security(heikinashi(syminfo.tickerid), timeframe.period, close)
heikinashi_open = security(heikinashi(syminfo.tickerid), timeframe.period, open)
heikinashi_low = security(heikinashi(syminfo.tickerid), timeframe.period, low)
heikinashi_high = security(heikinashi(syminfo.tickerid), timeframe.period, high)
heikinashiPositive = heikinashi_close >= heikinashi_open
heikinashiBuy = heikinashiPositive == true and heikinashiPositive[1] == false and heikinashiPositive[2] == false
heikinashiSell = heikinashiPositive == false and heikinashiPositive[1] == true and heikinashiPositive[2] == true
//plotshape(heikinashiBuy, style=shape.arrowup, color=green, location=location.belowbar, size=size.tiny)
//plotshape(heikinashiSell, style=shape.arrowdown, color=red, location=location.abovebar, size=size.tiny)
buy = (crossBuy == true or crossBuy[1] == true or crossBuy[2] == true) and (heikinashiBuy == true or heikinashiBuy[1] == true or heikinashiBuy[2] == true)
sell = (crossSell == true or crossSell[1] == true or crossSell[2] == true) and (heikinashiSell == true or heikinashiSell[1] == true or heikinashiSell[2] == true)
mult = timeframe.period == '15' ? 4 : 1
mult2 = timeframe.period == '240' ? 0.25 : mult
movingAverage = sma(close, round(smaLengh))
movingAverage2 = sma(close, round(smaLengh2))
movingAverage3 = sma(close, round(smaLengh3))
uptrend = movingAverage < movingAverage2 and movingAverage2 < movingAverage3 and close > movingAverage
downtrend = movingAverage > movingAverage2 and movingAverage2 > movingAverage3 and close < movingAverage
signalBuy = (buy[1] == false and buy[2] == false and buy == true) and uptrend
signalSell = (sell[1] == false and sell[2] == false and sell == true) and downtrend
takeProfitSell = (buy[1] == false and buy[2] == false and buy == true) and uptrend == false
takeProfitBuy = (sell[1] == false and sell[2] == false and sell == true) and uptrend
plotshape(signalBuy, style=shape.triangleup, color=green, location=location.belowbar, size=size.tiny)
plotshape(signalSell, style=shape.triangledown, color=red, location=location.abovebar, size=size.tiny)
plot(movingAverage, linewidth=3, color=orange, transp=0)
plot(movingAverage2, linewidth=2, color=purple, transp=0)
plot(movingAverage3, linewidth=1, color=navy, transp=0)
alertcondition(signalBuy, title='Signal Buy', message='Signal Buy')
alertcondition(signalSell, title='Signal Sell', message='Signal Sell')
strategy.close("L", when=dcLower[1] > low)
strategy.close("S", when=dcUpper[1] < high)
strategy.entry("L", strategy.long, 1, when = signalBuy and testPeriod() and uptrend)
strategy.entry("S", strategy.short, 1, when = signalSell and testPeriod() and uptrend ==false)
//strategy.exit("Exit Long", from_entry = "L", loss = 25000000, profit=25000000)
//strategy.exit("Exit Short", from_entry = "S", loss = 25000000, profit=25000000)