Strategi Trailing Breakout

Ringkasan
Strategi ini terutama menggunakan indikator Binary Options Binary Options Binary Options Binary Options Binary Options Binary Options Binary Options Binary Options Binary Options Binary Options Binary Options Binary Options Binary Options Binary Options Binary Options Binary Options Binary Options Binary Options Binary Options Binary Options Binary Options Binary Options Binary Options Binary Options Binary Options Binary Options Binary Options Binary Options Binary Options Binary Options Binary Options Binary Options Binary Options Binary Options Binary Options Binary Options Binary Options Binary Options Binary Options Binary Options Binary Options Binary Options Binary Options Binary Options Binary Options Binary Options Binary Options Binary Options Binary Options Binary Options Binary Options Binary Options Binary Options Binary Options Binary Options Binary Options Binary Options Binary Options Binary Options Binary Options Binary Options Binary Options Binary
Prinsip Strategi
-
Setting parameter untuk indikator channel channel channel, default period 20;
-
Setting EMA Smooth Moving Average, dengan siklus default 200;
-
Setel RRR, default 1.5;
-
Setting break-back parameter, masing-masing multihead dan headless;
-
Apakah tercatat sebagai titik tinggi atau titik rendah;
-
Sinyal multihead: menghasilkan sinyal multihead jika terobosan sebelumnya adalah titik rendah, dan harga lebih tinggi dari tren atas Dongguan dan lebih tinggi dari garis rata-rata EMA;
-
Sinyal kosong: menghasilkan sinyal kosong jika terobosan sebelumnya adalah titik tinggi dan harga berada di bawah rel bawah Dongguan dan di bawah garis rata-rata EMA;
-
Setelah masuk ke posisi multihead, set stop loss untuk mundur 5 poin ke bawah rel Dongjian, stop loss untuk rasio risiko keuntungan kali stop loss;
-
Setelah memasuki posisi kosong, set stop loss untuk Tang Chian naik rel mundur 5 poin, stop loss untuk risiko keuntungan rasio kali jarak stop loss.
Dengan cara ini, strategi yang menggabungkan penilaian tren dan operasi breakout, dapat secara berurutan, menangkap peluang periode yang lebih pendek dalam tren garis panjang. Sementara itu, pengaturan stop loss stop loss dapat mengontrol risiko keuntungan dari perdagangan tunggal.
Analisis Keunggulan
-
Mengikuti tren garis panjang dan menghindari perdagangan berlawanan arah.
-
Tangqian Channel sebagai indikator garis panjang, dikombinasikan dengan EMA linear filter, dapat lebih baik menilai arah tren.
-
Sistem Stop Loss Control mengontrol setiap risiko dan membatasi kemungkinan kerugian.
-
Mengoptimalkan rasio risiko-keuntungan, Anda dapat meningkatkan rasio kerugian, mengejar keuntungan ekstra.
-
Pengaturan parameter pengembalian yang fleksibel, dapat menyesuaikan kombinasi parameter terbaik untuk pasar yang berbeda.
Analisis risiko
-
Tangjian Channel dan EMA Linear digunakan sebagai indikator filter, dan mungkin akan memberikan sinyal yang salah.
-
"Breakthrough trading mudah dibodohkan, perlu identify dan jelaskan latar belakang tren".
-
Stop loss adalah jarak yang tetap dan tidak dapat disesuaikan dengan tingkat fluktuasi pasar.
-
Parameters Tidak ada ruang untuk mengoptimalkan, dan tidak ada jaminan bahwa itu akan berhasil.
-
Sistem perdagangan tidak dapat bertahan dengan terlalu banyak peristiwa acak, dan Black Swan dapat menyebabkan kerugian yang lebih besar.
Arah optimasi
-
Anda dapat mempertimbangkan untuk menambahkan lebih banyak indikator filter, seperti indikator getaran, untuk meningkatkan kualitas sinyal.
-
Anda dapat mengatur Stop Loss Smart Stop Loss yang dapat menyesuaikan posisi Anda berdasarkan volatilitas pasar dan dinamika indikator ATR.
-
Metode seperti pembelajaran mesin dapat digunakan untuk menguji dan mengoptimalkan parameter agar lebih dekat dengan pasar yang sebenarnya.
-
Anda dapat mengoptimalkan logika masuk dan mengatur indikator VOLUME atau volatilitas sebagai kondisi tambahan untuk menghindari jebakan.
-
Strategi ini dapat dipertimbangkan untuk dikombinasikan dengan strategi pelacakan tren atau pembelajaran mesin untuk membentuk strategi campuran dan meningkatkan stabilitas.
Meringkaskan
Strategi ini sebagai strategi pelacakan, ide utamanya adalah untuk mengetahui tren garis panjang, untuk melakukan operasi progresif dengan sinyal untuk menerobos, dan mengatur stop loss untuk mengendalikan risiko perdagangan tunggal. Strategi ini memiliki beberapa keuntungan, tetapi ada juga beberapa ruang untuk pengoptimalan. Secara keseluruhan, jika dapat menangani parameter yang baik, pengaturan pilihan waktu masuk, dan tambahan dengan teknologi lain, strategi ini dapat menjadi strategi pelacakan tren yang praktis.
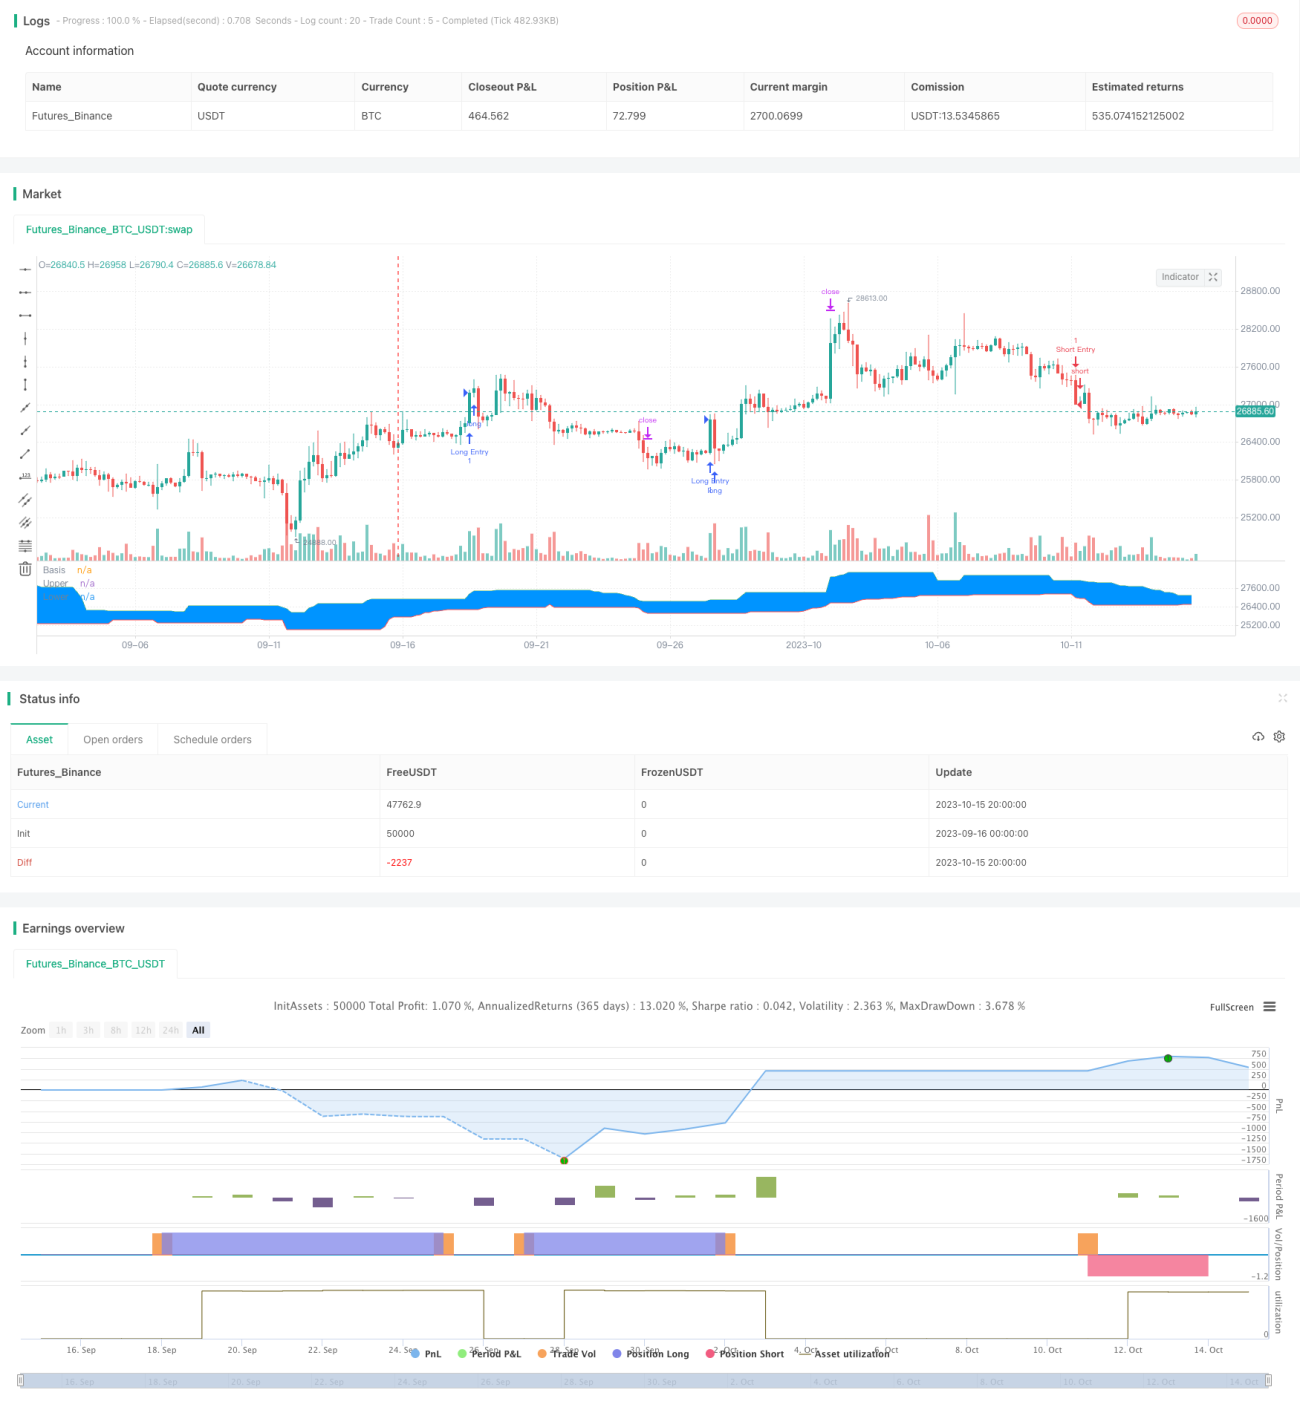
/*backtest
start: 2023-09-16 00:00:00
end: 2023-10-16 00:00:00
period: 4h
basePeriod: 15m
exchanges: [{"eid":"Futures_Binance","currency":"BTC_USDT"}]
*/

//@version=4
// Welcome to my second script on Tradingview with Pinescript
// First of, I'm sorry for the amount of comments on this script, this script was a challenge for me, fun one for sure, but I wanted to thoroughly go through every step before making the script public
// Glad I did so because I fixed some weird things and I ended up forgetting to add the EMA into the equation so our entry signals were a mess- 1