Strategi stop loss dua tahap

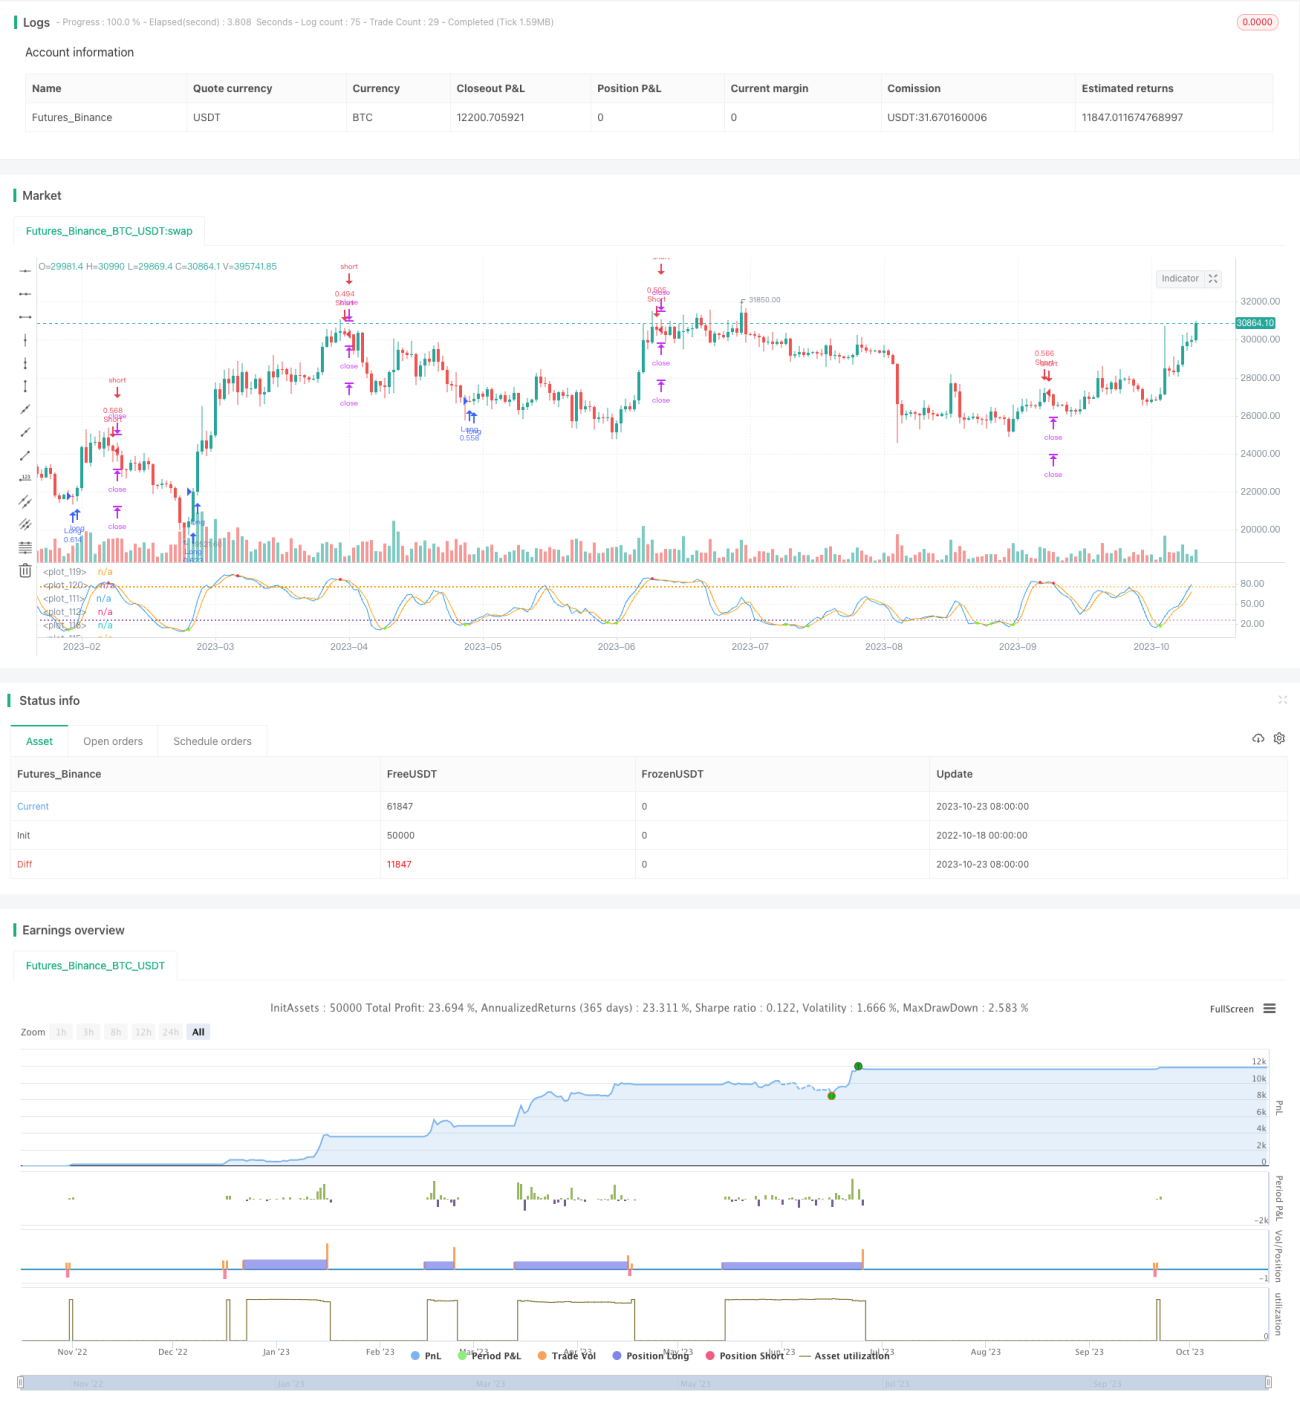
Ringkasan
Gagasan utama dari strategi ini adalah untuk mengatur dua stop loss, dan ketika stop loss pertama dipicu, stop loss akan dipindahkan ke harga masuk, untuk mencegah stop loss yang terhalang.
Prinsip Strategi
Strategi ini didasarkan pada Bollinger Bands dan Stochastic Indicator Entry. Berbelanjalah ketika harga melampaui Bollinger Bands dan berbelanjalah ketika Stochastic Indicator menunjukkan oversold.
Secara khusus, logika masuk dari strategi ini adalah:
-
Penutupan lebih besar ketika harga ditutup di bawah Brin dan Stochastic K di bawah garis D
-
Ketika harga penutupan lebih tinggi dari Brin berbaris, dan Stochastic K di garis D melewati garis kosong
Strategi ini menetapkan dua titik tolak, titik tolak pertama ditetapkan pada 200 dan titik tolak kedua ditetapkan pada 500.
Ketika stop loss pertama dalam pergerakan harga dipicu, strategi ini akan memindahkan stop loss ke harga masuk. Ini dapat mengunci keuntungan pada tahap pertama, sekaligus mencegah stop loss dari pergerakan harga.
Ketika stop loss kedua dipicu atau stop loss dipicu, strategi ini akan benar-benar kosong.
Keunggulan Strategis
Keuntungan terbesar dari strategi stop loss dua tahap ini adalah bahwa Anda dapat mengunci keuntungan dan mencegah stop loss di tepi fluktuasi harga. Dengan memindahkan titik stop loss ke harga masuk, Anda dapat mengurangi kemungkinan stop loss di tepi, melindungi keuntungan.
Keuntungan lain adalah bahwa strategi ini menggunakan kombinasi strategi Bollinger Bands dan Stochastic Indicators untuk menentukan kisaran pergerakan harga, yang saling melengkapi dan meningkatkan akurasi penarikan.
Risiko Strategis
Risiko utama dari strategi ini adalah bahwa kedua indikator Brin dan Stochastic dapat menghasilkan sinyal yang salah. Jika bandwidth Brin dihitung dengan salah, akan menyebabkan waktu masuk yang salah atau menghasilkan sinyal yang salah. Jika indikator Stochastic menghasilkan false breakout, juga akan menyebabkan masuk yang salah.
Selain itu, ada risiko bahwa stop loss yang bergerak ke harga masuk akan terbalik lagi. Jika terjadi pembalikan V, stop loss mungkin akan dipicu untuk kedua kalinya.
Untuk mengurangi risiko ini, Anda dapat menyesuaikan parameter Brin, mengoptimalkan kombinasi parameter indikator Stochastic, dan meningkatkan interval titik henti dengan tepat.
Arah optimasi strategi
Strategi stop loss dua tahap ini dapat dioptimalkan lebih lanjut:
-
Anda dapat menguji berbagai kombinasi parameter, mengoptimalkan parameter Brin dan Stochastic, dan menemukan kombinasi parameter yang optimal.
-
Anda dapat menguji pengaturan stop loss yang berbeda, mengoptimalkan ukuran stop loss, dan menemukan konfigurasi optimal.
-
Indikator lain, seperti moving average, dapat ditambahkan untuk membentuk strategi kombinasi multi-indikator dan meningkatkan akurasi masuk.
-
Logika pergerakan stop loss yang berbeda dapat dipelajari, misalnya bergerak di luar interval tertentu, bukan harga masuk.
-
Anda dapat meningkatkan jumlah gerakan titik stop loss, dan mengatur tiga atau lebih langkah stop loss.
Meringkaskan
Strategi ini menggunakan indikator Brin Belt dan indikator Stochastic untuk menentukan waktu masuk, mengatur dua titik berhenti, dan setelah titik berhenti pertama tercapai, pindah titik berhenti ke harga masuk, membentuk strategi stop loss dua tahap. Strategi ini dapat secara efektif mengunci keuntungan dan mencegah stop loss di tepi. Keunggulan strategi menonjol, tetapi ada juga ruang untuk perbaikan tertentu, strategi ini dapat lebih disempurnakan melalui pengoptimalan parameter, kombinasi multi-indikator, penyesuaian logika titik berhenti, dll.
- 1