Strategi take profit multi-kerangka waktu

Ringkasan
Strategi ini bertujuan untuk mencapai manajemen stop di beberapa frame waktu. Strategi ini menggunakan stop persentase dan stop area harga utama di atas frame waktu utama untuk mencapai manajemen stop yang lebih akurat dan lebih efektif.
Prinsip Strategi
Strategi ini pertama-tama memperkenalkan indikator tren gelombang, dengan masuknya beberapa sinyal berdasarkan indikator garpu emas.
Dalam hal pengelolaan hambatan, ada dua strategi untuk mencegah hambatan:
-
Persentase Stop: mengatur beberapa harga stop berdasarkan persentase tertentu dari harga tiket masuk.
-
Multi-frame time frame stop: Garis rata digambar pada garis harian dan garis 4 jam, dengan harga garis rata tersebut sebagai harga stop.
Untuk stop loss persentase, strategi menetapkan 4 harga stop loss persentase yang berbeda. Ketika harga menyentuh setiap harga stop loss, sebagian dari posisi akan ditutup dengan persentase yang ditetapkan.
Untuk multi-frame time frame stop, strategi adalah menggambar 100 hari rata-rata dan 200 hari rata-rata pada garis harian dan 4 jam masing-masing. Mengambil harga rata-rata ini sebagai harga stop, dan melonggarkan posisi ketika harga mencapai.
Selain itu, strategi juga menetapkan harga stop loss. Jika harga di bawah harga stop loss, semua posisi kosong.
Seluruh strategi ini memungkinkan manajemen stop yang lebih komprehensif dan lebih halus dengan menggunakan kombinasi stop persentase dan multi-frame stop.
Keunggulan Strategis
-
Penggunaan persen stoples, stoples berdasarkan proporsi tetap, untuk menghindari stoples prematur atau stoples kurang.
-
Dengan analisis multi-frame, harga stop-loss lebih tepat dan pilihan stop-loss lebih baik.
-
Di Indonesia, banyak orang yang mengkonsumsi obat-obatan herbal untuk mencegah terjadinya kanker.
-
Menetapkan harga stop loss untuk mengontrol risiko penurunan.
-
Kombinasi penggunaan persenjataan dan multi-frame stop, stop lebih komprehensif dan lebih halus.
Analisis risiko
-
Persentase stop tergantung pada pengaturan parameter, jika parameter tidak diatur dengan benar, akan menyebabkan stop terlalu dini atau terlalu terlambat.
-
Analisis multi-frame time frame bergantung pada indikator garis rata-rata, garis rata-rata memiliki keterbelakangan tertentu, mungkin terjadi deviasi.
-
Stop loss yang tidak tepat dapat menyebabkan stop loss yang tidak perlu.
-
Parameter harus dioptimalkan dengan tepat untuk mencapai kecocokan yang optimal antara persen stop dan multi-frame stop.
Arah optimasi
-
Anda dapat menguji lebih banyak indikator rata-rata dan memilih rata-rata yang lebih baik sebagai harga stop-loss utama.
-
Anda dapat mencoba metode prediksi model yang memprediksi area harga kritis sebagai harga stop-loss.
-
Lebih banyak aturan penghentian dapat diperkenalkan, seperti proporsi penghentian yang diharapkan, penghentian bergerak, dan sebagainya, untuk membuat penghentian lebih komprehensif.
-
Parameter stop-loss persentase optimal dapat diuji untuk periode kepemilikan yang berbeda.
-
Hal ini dapat dioptimalkan parameter hambatan dengan feedback, sehingga risiko-penghasilan keseluruhan lebih baik.
Meringkaskan
Strategi ini memungkinkan manajemen stop yang fleksibel dan akurat dengan kombinasi stop persentase dan multi-frame stop. Strategi ini memiliki kelebihan seperti pilihan stop point yang lebih baik, stop yang lebih komprehensif. Ada juga masalah seperti pengaturan parameter, posisi stop loss.
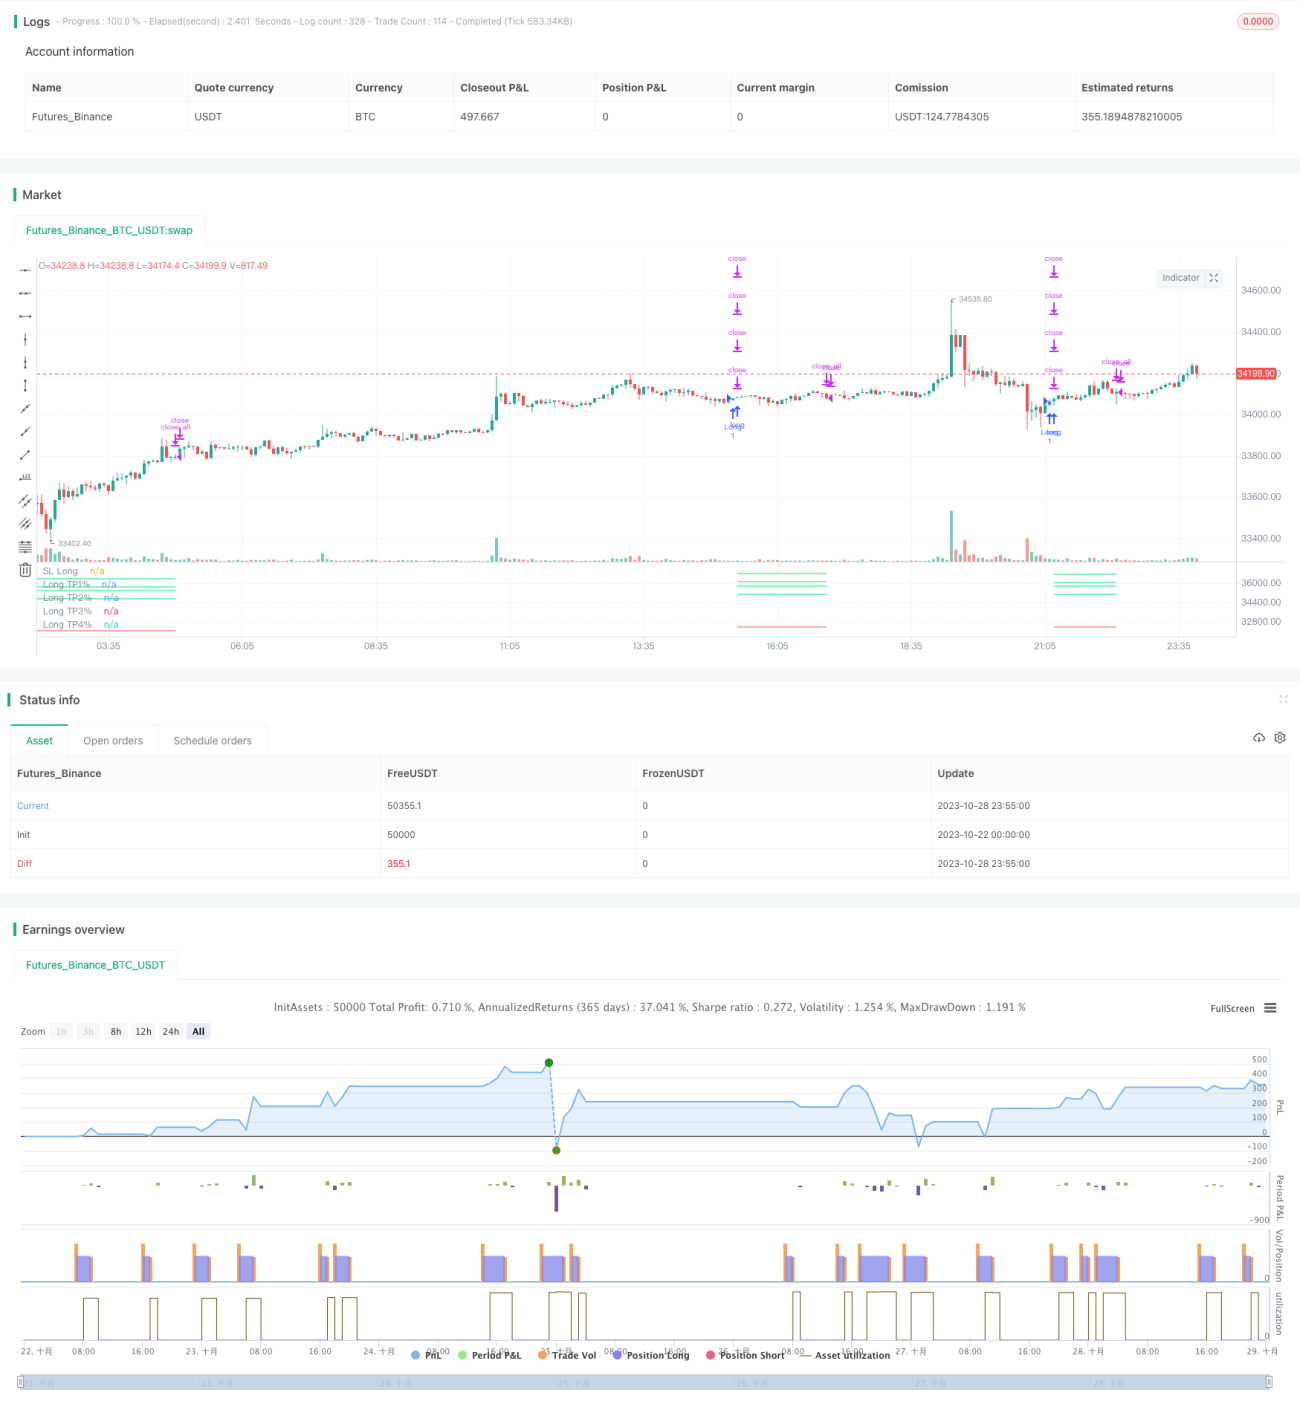
/*backtest
start: 2023-10-22 00:00:00
end: 2023-10-29 00:00:00
period: 5m
basePeriod: 1m
exchanges: [{"eid":"Futures_Binance","currency":"BTC_USDT"}]
*/

// This source code is subject to the terms of the Mozilla Public License 2.0 at https://mozilla.org/MPL/2.0/
// © TrendCrypto2022
//@version=5
// strategy("Take profit Multi timeframe", overlay=true, margin_long=100, margin_short=100)- 1