
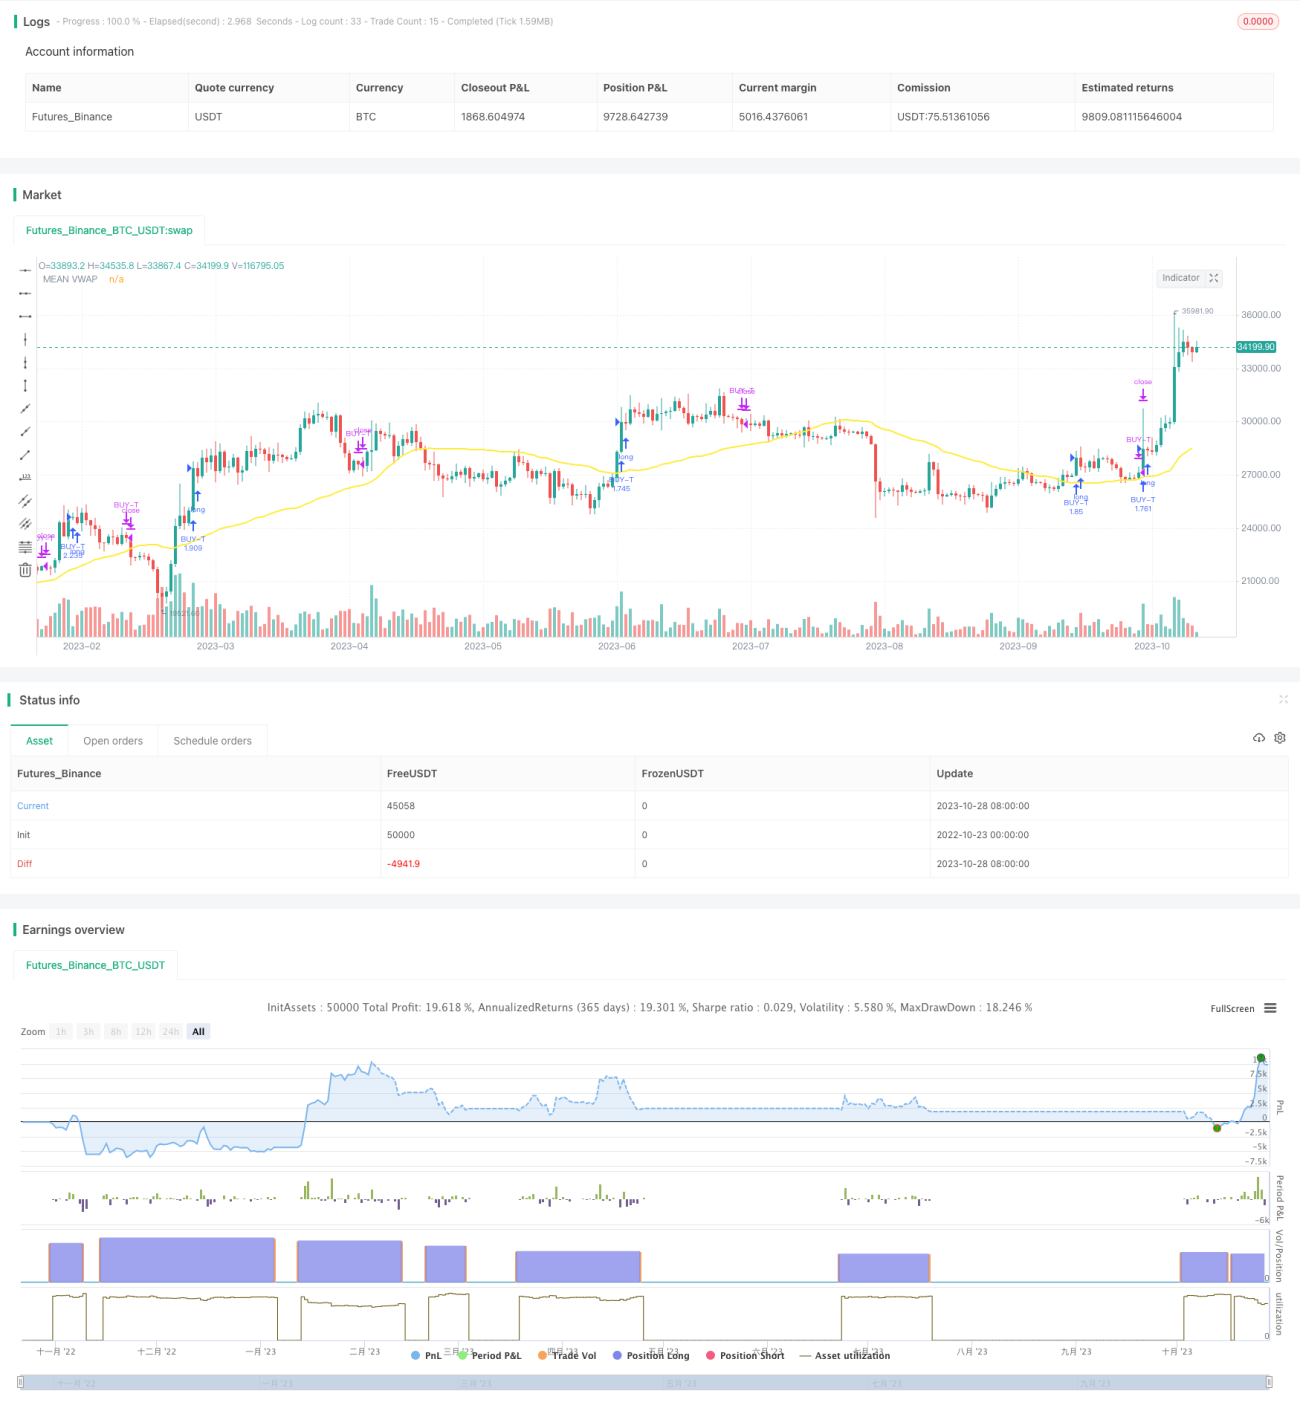
Strategi ini terutama menggunakan prinsip persilangan rata-rata, yang dikombinasikan dengan sinyal reversal indikator RSI, dan algoritma pelacakan dua baris yang disesuaikan untuk melakukan perdagangan persilangan rata-rata. Strategi ini melacak persilangan rata-rata dua periode yang berbeda, satu persilangan rata-rata cepat yang melacak tren jangka pendek, yang lain persilangan rata-rata lambat yang melacak tren jangka panjang.
Perhitungan rata-rata VWAP dari dua set parameter yang berbeda, yang mewakili tren jangka panjang dan tren jangka pendek
Ambil rata-rata dari dua set garis langit-langit dan garis acuan sebagai rata-rata lambat dan rata-rata cepat
Perhitungan indikator Brin Belt untuk menilai konsolidasi dan terobosan
Perhitungan indikator TSV untuk menentukan energi volume transaksi
Perhitungan RSI untuk menilai overbought dan oversold
Syarat masuk:
Kondisi untuk bermain:
Dengan menggunakan sistem dua baris, tren jangka pendek dan panjang dapat ditangkap secara bersamaan.
Indeks RSI menghindari zona overbought dan zona oversold
Indeks TSV memastikan ada cukup volume transaksi untuk mendukung tren
Terobosan Penting dalam Pengukuran Brin Belt
Kombinasi berbagai indikator yang efektif untuk memfilter terobosan palsu
Sistem linear mudah menghasilkan sinyal yang salah dan membutuhkan penyaringan indikator tambahan
Parameter RSI perlu dioptimalkan, atau mungkin akan kehilangan titik jual beli
Indikator TSV juga sensitif terhadap parameter dan perlu diuji dengan cermat.
Penembusan Brin di Jalur Kereta Bisa Jadi Penembusan Palsu, Perlu Diverifikasi
Kombinasi multi-indikator, parameter yang sulit dioptimalkan, mudah dioptimalkan
Data pelatihan dan pengujian yang tidak memadai dapat menyebabkan kecocokan kurva
Uji lebih banyak parameter periodik untuk menemukan kombinasi optimal
Cobalah indikator lain seperti MACD, KD alternatif atau kombinasi RSI
Optimasi parameter untuk memanfaatkan analisis walk forward
Meningkatkan strategi stop loss untuk mengendalikan kerugian tunggal
Pertimbangkan untuk memasukkan penilaian sinyal bantu dalam model pembelajaran mesin
Jangan terlalu bergantung pada kombinasi parameter tunggal untuk menyesuaikan parameter untuk pasar yang berbeda
Strategi ini menangkap tren jangka pendek panjang melalui sistem dua garis sejajar, dan menggunakan berbagai indikator filter sinyal seperti RSI, TSV, dan Brin. Keuntungan dari strategi ini adalah dapat secara berurutan, menangkap gelombang kenaikan jangka panjang. Namun, ada juga risiko sinyal palsu tertentu, perlu mengoptimalkan parameter lebih lanjut dan mengendalikan stop loss untuk mengurangi risiko. Secara keseluruhan, strategi ini menggabungkan pelacakan tren dan indikator reversal, lebih efektif di pasar yang naik di garis panjang, tetapi perlu melakukan penyesuaian parameter untuk pasar yang berbeda.
/*backtest
start: 2022-10-23 00:00:00
end: 2023-10-29 00:00:00
period: 1d
basePeriod: 1h
exchanges: [{"eid":"Futures_Binance","currency":"BTC_USDT"}]
*/
// @version=4
// Credits
// "Vwap with period" code which used in this strategy to calculate the leadLine was written by "neolao" active on https://tr.tradingview.com/u/neolao/
// "TSV" code which used in this strategy was written by "liw0" active on https://www.tradingview.com/u/liw0. The code is corrected by "vitelot" December 2018.
// "Vidya" code which used in this strategy was written by "everget" active on https://tr.tradingview.com/u/everget/
strategy("HYE Combo Market [Strategy] (Vwap Mean Reversion + Trend Hunter)", overlay = true, initial_capital = 1000, default_qty_value = 100, default_qty_type = strategy.percent_of_equity, commission_value = 0.025)
//Strategy inputs
source = input(title = "Source", defval = close, group = "Mean Reversion Strategy Inputs")
smallcumulativePeriod = input(title = "Small VWAP", defval = 8, group = "Mean Reversion Strategy Inputs")
bigcumulativePeriod = input(title = "Big VWAP", defval = 10, group = "Mean Reversion Strategy Inputs")
meancumulativePeriod = input(title = "Mean VWAP", defval = 50, group = "Mean Reversion Strategy Inputs")
percentBelowToBuy = input(title = "Percent below to buy %", defval = 2, group = "Mean Reversion Strategy Inputs")
rsiPeriod = input(title = "Rsi Period", defval = 2, group = "Mean Reversion Strategy Inputs")
rsiEmaPeriod = input(title = "Rsi Ema Period", defval = 5, group = "Mean Reversion Strategy Inputs")
rsiLevelforBuy = input(title = "Maximum Rsi Level for Buy", defval = 30, group = "Mean Reversion Strategy Inputs")
slowtenkansenPeriod = input(9, minval=1, title="Slow Tenkan Sen VWAP Line Length", group = "Trend Hunter Strategy Inputs")
slowkijunsenPeriod = input(13, minval=1, title="Slow Kijun Sen VWAP Line Length", group = "Trend Hunter Strategy Inputs")
fasttenkansenPeriod = input(3, minval=1, title="Fast Tenkan Sen VWAP Line Length", group = "Trend Hunter Strategy Inputs")
fastkijunsenPeriod = input(7, minval=1, title="Fast Kijun Sen VWAP Line Length", group = "Trend Hunter Strategy Inputs")
BBlength = input(20, minval=1, title= "Bollinger Band Length", group = "Trend Hunter Strategy Inputs")
BBmult = input(2.0, minval=0.001, maxval=50, title="Bollinger Band StdDev", group = "Trend Hunter Strategy Inputs")
tsvlength = input(20, minval=1, title="TSV Length", group = "Trend Hunter Strategy Inputs")
tsvemaperiod = input(7, minval=1, title="TSV Ema Length", group = "Trend Hunter Strategy Inputs")
length = input(title="Vidya Length", type=input.integer, defval=20, group = "Trend Hunter Strategy Inputs")
src = input(title="Vidya Source", type=input.source, defval= hl2 , group = "Trend Hunter Strategy Inputs")
// Vidya Calculation
getCMO(src, length) =>
mom = change(src)
upSum = sum(max(mom, 0), length)
downSum = sum(-min(mom, 0), length)
out = (upSum - downSum) / (upSum + downSum)
out
cmo = abs(getCMO(src, length))
alpha = 2 / (length + 1)
vidya = 0.0
vidya := src * alpha * cmo + nz(vidya[1]) * (1 - alpha * cmo)
// Make input options that configure backtest date range
startDate = input(title="Start Date", type=input.integer,
defval=1, minval=1, maxval=31, group = "Strategy Date Range")
startMonth = input(title="Start Month", type=input.integer,
defval=1, minval=1, maxval=12, group = "Strategy Date Range")
startYear = input(title="Start Year", type=input.integer,
defval=2000, minval=1800, maxval=2100, group = "Strategy Date Range")
endDate = input(title="End Date", type=input.integer,
defval=31, minval=1, maxval=31, group = "Strategy Date Range")
endMonth = input(title="End Month", type=input.integer,
defval=12, minval=1, maxval=12, group = "Strategy Date Range")
endYear = input(title="End Year", type=input.integer,
defval=2021, minval=1800, maxval=2100, group = "Strategy Date Range")
inDateRange = true
// Mean Reversion Strategy Calculation
typicalPriceS = (high + low + close) / 3
typicalPriceVolumeS = typicalPriceS * volume
cumulativeTypicalPriceVolumeS = sum(typicalPriceVolumeS, smallcumulativePeriod)
cumulativeVolumeS = sum(volume, smallcumulativePeriod)
smallvwapValue = cumulativeTypicalPriceVolumeS / cumulativeVolumeS
typicalPriceB = (high + low + close) / 3
typicalPriceVolumeB = typicalPriceB * volume
cumulativeTypicalPriceVolumeB = sum(typicalPriceVolumeB, bigcumulativePeriod)
cumulativeVolumeB = sum(volume, bigcumulativePeriod)
bigvwapValue = cumulativeTypicalPriceVolumeB / cumulativeVolumeB
typicalPriceM = (high + low + close) / 3
typicalPriceVolumeM = typicalPriceM * volume
cumulativeTypicalPriceVolumeM = sum(typicalPriceVolumeM, meancumulativePeriod)
cumulativeVolumeM = sum(volume, meancumulativePeriod)
meanvwapValue = cumulativeTypicalPriceVolumeM / cumulativeVolumeM
rsiValue = rsi(source, rsiPeriod)
rsiEMA = ema(rsiValue, rsiEmaPeriod)
buyMA = ((100 - percentBelowToBuy) / 100) * bigvwapValue[0]
inTrade = strategy.position_size > 0
notInTrade = strategy.position_size <= 0
if(crossunder(smallvwapValue, buyMA) and rsiEMA < rsiLevelforBuy and close < meanvwapValue and inDateRange and notInTrade)
strategy.entry("BUY-M", strategy.long)
if(close > meanvwapValue or not inDateRange)
strategy.close("BUY-M")
// Trend Hunter Strategy Calculation
// Slow Tenkan Sen Calculation
typicalPriceTS = (high + low + close) / 3
typicalPriceVolumeTS = typicalPriceTS * volume
cumulativeTypicalPriceVolumeTS = sum(typicalPriceVolumeTS, slowtenkansenPeriod)
cumulativeVolumeTS = sum(volume, slowtenkansenPeriod)
slowtenkansenvwapValue = cumulativeTypicalPriceVolumeTS / cumulativeVolumeTS
// Slow Kijun Sen Calculation
typicalPriceKS = (high + low + close) / 3
typicalPriceVolumeKS = typicalPriceKS * volume
cumulativeTypicalPriceVolumeKS = sum(typicalPriceVolumeKS, slowkijunsenPeriod)
cumulativeVolumeKS = sum(volume, slowkijunsenPeriod)
slowkijunsenvwapValue = cumulativeTypicalPriceVolumeKS / cumulativeVolumeKS
// Fast Tenkan Sen Calculation
typicalPriceTF = (high + low + close) / 3
typicalPriceVolumeTF = typicalPriceTF * volume
cumulativeTypicalPriceVolumeTF = sum(typicalPriceVolumeTF, fasttenkansenPeriod)
cumulativeVolumeTF = sum(volume, fasttenkansenPeriod)
fasttenkansenvwapValue = cumulativeTypicalPriceVolumeTF / cumulativeVolumeTF
// Fast Kijun Sen Calculation
typicalPriceKF = (high + low + close) / 3
typicalPriceVolumeKF = typicalPriceKS * volume
cumulativeTypicalPriceVolumeKF = sum(typicalPriceVolumeKF, fastkijunsenPeriod)
cumulativeVolumeKF = sum(volume, fastkijunsenPeriod)
fastkijunsenvwapValue = cumulativeTypicalPriceVolumeKF / cumulativeVolumeKF
// Slow LeadLine Calculation
lowesttenkansen_s = lowest(slowtenkansenvwapValue, slowtenkansenPeriod)
highesttenkansen_s = highest(slowtenkansenvwapValue, slowtenkansenPeriod)
lowestkijunsen_s = lowest(slowkijunsenvwapValue, slowkijunsenPeriod)
highestkijunsen_s = highest(slowkijunsenvwapValue, slowkijunsenPeriod)
slowtenkansen = avg(lowesttenkansen_s, highesttenkansen_s)
slowkijunsen = avg(lowestkijunsen_s, highestkijunsen_s)
slowleadLine = avg(slowtenkansen, slowkijunsen)
// Fast LeadLine Calculation
lowesttenkansen_f = lowest(fasttenkansenvwapValue, fasttenkansenPeriod)
highesttenkansen_f = highest(fasttenkansenvwapValue, fasttenkansenPeriod)
lowestkijunsen_f = lowest(fastkijunsenvwapValue, fastkijunsenPeriod)
highestkijunsen_f = highest(fastkijunsenvwapValue, fastkijunsenPeriod)
fasttenkansen = avg(lowesttenkansen_f, highesttenkansen_f)
fastkijunsen = avg(lowestkijunsen_f, highestkijunsen_f)
fastleadLine = avg(fasttenkansen, fastkijunsen)
// BBleadLine Calculation
BBleadLine = avg(fastleadLine, slowleadLine)
// Bollinger Band Calculation
basis = sma(BBleadLine, BBlength)
dev = BBmult * stdev(BBleadLine, BBlength)
upper = basis + dev
lower = basis - dev
// TSV Calculation
tsv = sum(close>close[1]?volume*(close-close[1]):close<close[1]?volume*(close-close[1]):0,tsvlength)
tsvema = ema(tsv, tsvemaperiod)
// Rules for Entry & Exit
if(fastleadLine > fastleadLine[1] and slowleadLine > slowleadLine[1] and tsv > 0 and tsv > tsvema and close > upper and close > vidya and inDateRange and notInTrade)
strategy.entry("BUY-T", strategy.long)
if((fastleadLine < fastleadLine[1] and slowleadLine < slowleadLine[1]) or not inDateRange)
strategy.close("BUY-T")
// Plots
plot(meanvwapValue, title="MEAN VWAP", linewidth=2, color=color.yellow)
//plot(vidya, title="VIDYA", linewidth=2, color=color.green)
//colorsettingS = input(title="Solid Color Slow Leadline", defval=false, type=input.bool)
//plot(slowleadLine, title = "Slow LeadLine", color = colorsettingS ? color.aqua : slowleadLine > slowleadLine[1] ? color.green : color.red, linewidth=3)
//colorsettingF = input(title="Solid Color Fast Leadline", defval=false, type=input.bool)
//plot(fastleadLine, title = "Fast LeadLine", color = colorsettingF ? color.orange : fastleadLine > fastleadLine[1] ? color.green : color.red, linewidth=3)
//p1 = plot(upper, "Upper BB", color=#2962FF)
//p2 = plot(lower, "Lower BB", color=#2962FF)
//fill(p1, p2, title = "Background", color=color.blue)
//plot(smallvwapValue, color=#13C425, linewidth=2)
//plot(bigvwapValue, color=#CA1435, linewidth=2)