Strategi Perdagangan Rata-rata Bergerak Tiga

Penulis:ChaoZhang, Tanggal: 2023-11-02 14:47:45
Tag:

img

Gambaran umum

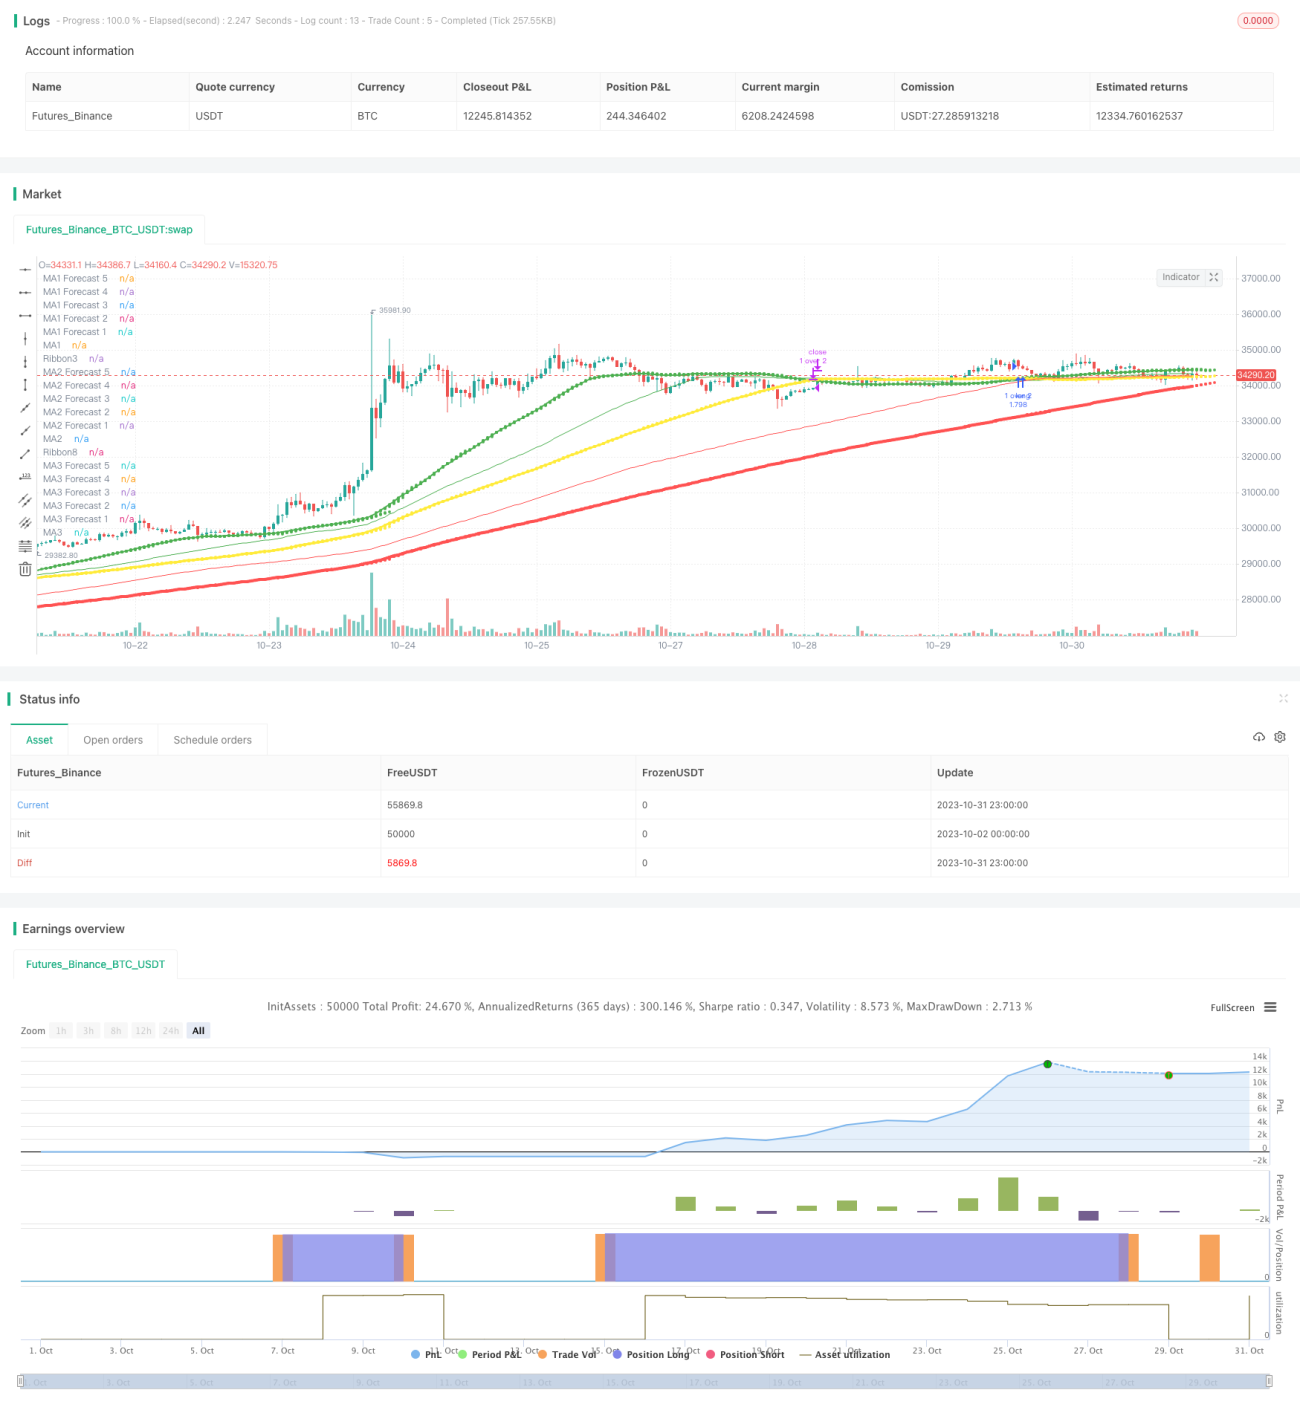
Strategi ini adalah strategi perdagangan trend-mengikuti berdasarkan tiga rata-rata bergerak. Ini menggunakan tiga rata-rata bergerak dengan periode yang berbeda untuk keputusan panjang dan pendek, yang merupakan strategi pelacakan tren khas.

Logika Strategi

  1. Strategi ini menggunakan 3 rata-rata bergerak: MA1, MA2 dan MA3. Periode dari 3 rata-rata bergerak ditetapkan oleh pengguna, umumnya MA1 < MA2 < MA3, misalnya, MA1 adalah 50 periode, MA2 adalah 100 periode, dan MA3 adalah 200 periode.

  2. Strategi ini terutama merujuk pada MA1 untuk keputusan perdagangan. Ketika periode pendek MA1 melintasi periode panjang MA2 atau MA3, pergi panjang; ketika MA1 melintasi di bawah MA2 atau MA3, pergi pendek.

  3. Strategi dapat memilih untuk hanya memperdagangkan persilangan MA1 dan MA2, atau hanya persilangan MA1 dan MA3, atau memperdagangkan kedua persilangan.

  4. Ketika sinyal crossover terjadi, buka posisi menggunakan pesanan pasar. Take profit dan stop loss ditetapkan sebagai persentase tertentu dari harga penutupan, seperti 30% take profit dan 15% stop loss.

  5. Untuk optimasi, periode garis MA dapat disesuaikan, persentase mengambil keuntungan dan stop loss dapat disetel, indikator lain dapat ditambahkan untuk menyaring sinyal, dll.

Analisis Keuntungan

  1. Menggunakan beberapa rata-rata bergerak untuk pengambilan keputusan dapat secara efektif menyaring kebocoran palsu.

  2. Mengadopsi kombinasi MA dengan periode yang berbeda dapat menyesuaikan posisi secara dinamis dalam tren dan mencapai pelacakan tren.

  3. Ini fleksibel untuk hanya perdagangan Golden Cross, atau hanya Death Cross, atau keduanya, dengan berbagai metode perdagangan.

  4. Mekanisme stop loss dapat secara efektif mengendalikan kerugian tunggal.

Analisis Risiko

  1. Sebagai strategi pelacakan tren, cenderung untuk menghentikan kerugian di pasar yang terikat rentang.

  2. Jika periode MA tidak ditetapkan dengan benar, hal itu dapat menyebabkan perdagangan yang sering dan tingkat kemenangan yang lebih rendah.

  3. Jika gagal untuk memotong kerugian pada waktu setelah gagal breakout, itu dapat menyebabkan kerugian besar.

  4. Jika pengaturan mengambil keuntungan dan stop loss terlalu longgar, keuntungan atau kerugian tunggal mungkin terlalu besar.

Arahan Optimasi

  1. Optimalkan parameter MA untuk menemukan kombinasi parameter terbaik.

  2. Tambahkan indikator lain untuk menyaring waktu masuk, seperti MACD, KDJ dll.

  3. Mengoptimalkan titik mengambil keuntungan dan stop loss untuk meningkatkan rasio profit-risk dari strategi.

  4. Tambahkan ukuran posisi seperti jumlah tetap per pesanan atau manajemen uang.

  5. Tambahkan stop loss offset untuk breakout untuk mengoptimalkan strategi stop loss.

Ringkasan

Secara umum ini adalah strategi trend-mengikuti khas dengan menilai persilangan dari beberapa garis MA. Ini adalah strategi pelacakan tren yang relatif stabil. Perbaikan lebih lanjut dapat dilakukan melalui penyesuaian parameter, penyaringan indikator, ukuran posisi dll. Tetapi ide inti sederhana dan jelas, cocok untuk pemula untuk belajar dan berlatih. Jika parameter dioptimalkan dengan benar, dapat mencapai keuntungan yang stabil di pasar tren yang kuat.


/*backtest
start: 2023-10-02 00:00:00
end: 2023-11-01 00:00:00
period: 1h
basePeriod: 15m
exchanges: [{"eid":"Futures_Binance","currency":"BTC_USDT"}]
*/

//@version=4

//
// Pine Script v4
// @author BigBitsIO
// Script Library: https://www.tradingview.com/u/BigBitsIO/#published-scripts
//

// study(title, shorttitle, overlay, format, precision)
// https://www.tradingview.com/pine-script-reference/#fun_strategy  
strategy(shorttitle = "TManyMA Strategy - STA - Stops", title="Triple Many Moving Averages", overlay=true, pyramiding=1, default_qty_type=strategy.percent_of_equity, default_qty_value=100)

// MA#Period is a variable used to store the indicator lookback period.  In this case, from the input.
// input - https://www.tradingview.com/pine-script-docs/en/v4/annotations/Script_inputs.html
MA1Period = input(50, title="MA1 Period", minval=1, step=1)
MA1Type = input(title="MA1 Type", defval="SMA", options=["RMA", "SMA", "EMA", "WMA", "HMA", "DEMA", "TEMA", "VWMA"])
MA1Source = input(title="MA1 Source", type=input.source, defval=close)
MA1Resolution = input(title="MA1 Resolution", defval="00 Current", options=["00 Current", "01 1m", "02 3m", "03 5m", "04 15m", "05 30m", "06 45m", "07 1h", "08 2h", "09 3h", "10 4h", "11 1D", "12 1W", "13 1M"])
MA1Visible = input(title="MA1 Visible", type=input.bool, defval=true) // Will automatically hide crossBovers containing this MA

MA2Period = input(100, title="MA2 Period", minval=1, step=1)
MA2Type = input(title="MA2 Type", defval="SMA", options=["RMA", "SMA", "EMA", "WMA", "HMA", "DEMA", "TEMA", "VWMA"])
MA2Source = input(title="MA2 Source", type=input.source, defval=close)
MA2Resolution = input(title="MA2 Resolution", defval="00 Current", options=["00 Current", "01 1m", "02 3m", "03 5m", "04 15m", "05 30m", "06 45m", "07 1h", "08 2h", "09 3h", "10 4h", "11 1D", "12 1W", "13 1M"])
MA2Visible = input(title="MA2 Visible", type=input.bool, defval=true) // Will automatically hide crossovers containing this MA

MA3Period = input(200, title="MA3 Period", minval=1, step=1)
MA3Type = input(title="MA3 Type", defval="SMA", options=["RMA", "SMA", "EMA", "WMA", "HMA", "DEMA", "TEMA", "VWMA"])
MA3Source = input(title="MA3 Source", type=input.source, defval=close)
MA3Resolution = input(title="MA3 Resolution", defval="00 Current", options=["00 Current", "01 1m", "02 3m", "03 5m", "04 15m", "05 30m", "06 45m", "07 1h", "08 2h", "09 3h", "10 4h", "11 1D", "12 1W", "13 1M"])
MA3Visible = input(title="MA3 Visible", type=input.bool, defval=true) // Will automatically hide crossovers containing this MA

ShowCrosses = input(title="Show Crosses", type=input.bool, defval=false)

ForecastBias = input(title="Forecast Bias", defval="Neutral", options=["Neutral", "Bullish", "Bearish"])
ForecastBiasPeriod = input(14, title="Forecast Bias Period")
ForecastBiasMagnitude = input(1, title="Forecast Bias Magnitude", minval=0.25, maxval=20, step=0.25)
ShowForecasts = input(title="Show Forecasts", type=input.bool, defval=true)

ShowRibbons = input(title="Show Ribbons", type=input.bool, defval=true)

TradeMA12Crosses = input(title="Trade MA 1-2 Crosses", type=input.bool, defval=true)
TradeMA13Crosses = input(title="Trade MA 1-3 Crosses", type=input.bool, defval=true)
TradeMA23Crosses = input(title="Trade MA 2-3 Crosses", type=input.bool, defval=true)

TakeProfitPercent = input(30, title="Take Profit Percent", minval=0.01, step=0.5)
StopLossPercent = input(15, title="Stop Loss Percent", minval=0.01, step=0.5)


// MA# is a variable used to store the actual moving average value.
// if statements - https://www.tradingview.com/pine-script-reference/#op_if
// MA functions - https://www.tradingview.com/pine-script-reference/ (must search for appropriate MA)
// custom functions in  pine - https://www.tradingview.com/wiki/Declaring_Functions
ma(MAType, MASource, MAPeriod) =>
    if MAType == "SMA"
        sma(MASource, MAPeriod)
    else
        if MAType == "EMA"
            ema(MASource, MAPeriod)
        else
            if MAType == "WMA"
                wma(MASource, MAPeriod)
            else
                if MAType == "RMA"
                    rma(MASource, MAPeriod)
                else
                    if MAType == "HMA"
                        wma(2*wma(MASource, MAPeriod/2)-wma(MASource, MAPeriod), round(sqrt(MAPeriod)))
                    else
                        if MAType == "DEMA"
                            e = ema(MASource, MAPeriod)
                            2 * e - ema(e, MAPeriod)
                        else
                            if MAType == "TEMA"
                                e = ema(MASource, MAPeriod)
                                3 * (e - ema(e, MAPeriod)) + ema(ema(e, MAPeriod), MAPeriod)
                            else
                                if MAType == "VWMA"
                                    vwma(MASource, MAPeriod)
                                
res(MAResolution) =>
    if MAResolution == "00 Current"
        timeframe.period
    else
        if MAResolution == "01 1m"
            "1"
        else
            if MAResolution == "02 3m"
                "3"
            else
                if MAResolution == "03 5m"
                    "5"
                else
                    if MAResolution == "04 15m"
                        "15"
                    else
                        if MAResolution == "05 30m"
                            "30"
                        else
                            if MAResolution == "06 45m"
                                "45"
                            else
                                if MAResolution == "07 1h"
                                    "60"
                                else
                                    if MAResolution == "08 2h"
                                        "120"
                                    else
                                        if MAResolution == "09 3h"
                                            "180"
                                        else
                                            if MAResolution == "10 4h"
                                                "240"
                                            else
                                                if MAResolution == "11 1D"
                                                    "1D"
                                                else
                                                    if MAResolution == "12 1W"
                                                        "1W"
                                                    else
                                                        if MAResolution == "13 1M"
                                                            "1M"

// https://www.tradingview.com/pine-script-reference/#fun_request.security
MA1 = request.security(syminfo.tickerid, res(MA1Resolution), ma(MA1Type, MA1Source, MA1Period))     
MA2 = request.security(syminfo.tickerid, res(MA2Resolution), ma(MA2Type, MA2Source, MA2Period))
MA3 = request.security(syminfo.tickerid, res(MA3Resolution), ma(MA3Type, MA3Source, MA3Period))   
                    
// Plotting crossover/unders for all combinations of crosses
// Crossovers no longer detected in label code, they need to be re-used for strategy - crosses and visibility must be set
MA12Crossover = MA1Visible and MA2Visible and crossover(MA1, MA2)
MA12Crossunder = MA1Visible and MA2Visible and crossunder(MA1, MA2)
MA13Crossover = MA1Visible and MA3Visible and crossover(MA1, MA3)
MA13Crossunder = MA1Visible and MA3Visible and crossunder(MA1, MA3)
MA23Crossover = MA2Visible and MA3Visible and crossover(MA2, MA3)
MA23Crossunder = MA2Visible and MA3Visible and crossunder(MA2, MA3)

// https://www.tradingview.com/pine-script-reference/v4/#fun_label%7Bdot%7Dnew
if ShowCrosses and MA12Crossunder
    lun1 = label.new(bar_index, na, tostring(MA1Period)+' '+MA1Type+' crossed under '+tostring(MA2Period)+' '+MA2Type, 
      color=color.red, 
      textcolor=color.red,
      style=label.style_xcross, size=size.small)
    label.set_y(lun1, MA1)
if ShowCrosses and MA12Crossover
    lup1 = label.new(bar_index, na, tostring(MA1Period)+' '+MA1Type+' crossed over '+tostring(MA2Period)+' '+MA2Type, 
      color=color.green, 
      textcolor=color.green,
      style=label.style_xcross, size=size.small)
    label.set_y(lup1, MA1)
if ShowCrosses and MA13Crossunder
    lun2 = label.new(bar_index, na, tostring(MA1Period)+' '+MA1Type+' crossed under '+tostring(MA3Period)+' '+MA3Type, 
      color=color.red, 
      textcolor=color.red,
      style=label.style_xcross, size=size.small)
    label.set_y(lun2, MA1)
if ShowCrosses and MA13Crossover
    lup2 = label.new(bar_index, na, tostring(MA1Period)+' '+MA1Type+' crossed over '+tostring(MA3Period)+' '+MA3Type, 
      color=color.green, 
      textcolor=color.green,
      style=label.style_xcross, size=size.small)
    label.set_y(lup2, MA1)
if ShowCrosses and MA23Crossunder
    lun3 = label.new(bar_index, na, tostring(MA2Period)+' '+MA2Type+' crossed under '+tostring(MA3Period)+' '+MA3Type, 
      color=color.red, 
      textcolor=color.red,
      style=label.style_xcross, size=size.small)
    label.set_y(lun3, MA2)
if ShowCrosses and MA23Crossover
    lup3 = label.new(bar_index, na, tostring(MA2Period)+' '+MA2Type+' crossed over '+tostring(MA3Period)+' '+MA3Type, 
      color=color.green, 
      textcolor=color.green,
      style=label.style_xcross, size=size.small)
    label.set_y(lup3, MA2) 

// plot - This will draw the information on the chart
// plot - https://www.tradingview.com/pine-script-docs/en/v4/annotations/plot_annotation.html
plot(MA1Visible ? MA1 : na, color=color.green, linewidth=2, title="MA1")
plot(MA2Visible ? MA2 : na, color=color.yellow, linewidth=3, title="MA2")
plot(MA3Visible ? MA3 : na, color=color.red, linewidth=4, title="MA3")


// Forecasting - forcasted prices are calculated using our MAType and MASource for the MAPeriod - the last X candles.
//              it essentially replaces the oldest X candles, with the selected source * X candles
// Bias - We'll add an "adjustment" for each additional candle being forecasted based on ATR of the previous X candles
// custom functions in  pine - https://www.tradingview.com/wiki/Declaring_Functions
bias(Bias, BiasPeriod) =>
    if Bias == "Neutral"
        0
    else
        if Bias == "Bullish"
            (atr(BiasPeriod) * ForecastBiasMagnitude)
        else
            if Bias == "Bearish"
                ((atr(BiasPeriod)  * ForecastBiasMagnitude) * -1) // multiplying by -1 to make it a negative, bearish bias


// Note - Can not show forecasts on different resolutions at the moment, x-axis is an issue
Bias = bias(ForecastBias, ForecastBiasPeriod) // 14 is default atr period
MA1Forecast1 = (request.security(syminfo.tickerid, res(MA1Resolution), ma(MA1Type, MA1Source, MA1Period - 1)) * (MA1Period - 1) + ((MA1Source * 1) + (Bias * 1))) / MA1Period 
MA1Forecast2 = (request.security(syminfo.tickerid, res(MA1Resolution), ma(MA1Type, MA1Source, MA1Period - 2)) * (MA1Period - 2) + ((MA1Source * 2) + (Bias * 2))) / MA1Period
MA1Forecast3 = (request.security(syminfo.tickerid, res(MA1Resolution), ma(MA1Type, MA1Source, MA1Period - 3)) * (MA1Period - 3) + ((MA1Source * 3) + (Bias * 3))) / MA1Period
MA1Forecast4 = (request.security(syminfo.tickerid, res(MA1Resolution), ma(MA1Type, MA1Source, MA1Period - 4)) * (MA1Period - 4) + ((MA1Source * 4) + (Bias * 4))) / MA1Period
MA1Forecast5 = (request.security(syminfo.tickerid, res(MA1Resolution), ma(MA1Type, MA1Source, MA1Period - 5)) * (MA1Period - 5) + ((MA1Source * 5) + (Bias * 5))) / MA1Period


plot(MA1Resolution == "00 Current" and ShowForecasts and MA1Visible ? MA1Forecast1 : na, color=color.green, linewidth=1, style=plot.style_circles, title="MA1 Forecast 1", offset=1, show_last=1)
plot(MA1Resolution == "00 Current" and ShowForecasts and MA1Visible ? MA1Forecast2 : na, color=color.green, linewidth=1, style=plot.style_circles, title="MA1 Forecast 2", offset=2, show_last=1)
plot(MA1Resolution == "00 Current" and ShowForecasts and MA1Visible ? MA1Forecast3 : na, color=color.green, linewidth=1, style=plot.style_circles, title="MA1 Forecast 3", offset=3, show_last=1)
plot(MA1Resolution == "00 Current" and ShowForecasts and MA1Visible ? MA1Forecast4 : na, color=color.green, linewidth=1, style=plot.style_circles, title="MA1 Forecast 4", offset=4, show_last=1)
plot(MA1Resolution == "00 Current" and ShowForecasts and MA1Visible ? MA1Forecast5 : na, color=color.green, linewidth=1, style=plot.style_circles, title="MA1 Forecast 5", offset=5, show_last=1)


MA2Forecast1 = (request.security(syminfo.tickerid, res(MA2Resolution), ma(MA2Type, MA2Source, MA2Period - 1)) * (MA2Period - 1) + ((MA1Source * 1) + (Bias * 1))) / MA2Period
MA2Forecast2 = (request.security(syminfo.tickerid, res(MA2Resolution), ma(MA2Type, MA2Source, MA2Period - 2)) * (MA2Period - 2) + ((MA1Source * 2) + (Bias * 2))) / MA2Period
MA2Forecast3 = (request.security(syminfo.tickerid, res(MA2Resolution), ma(MA2Type, MA2Source, MA2Period - 3)) * (MA2Period - 3) + ((MA1Source * 3) + (Bias * 3))) / MA2Period
MA2Forecast4 = (request.security(syminfo.tickerid, res(MA2Resolution), ma(MA2Type, MA2Source, MA2Period - 4)) * (MA2Period - 4) + ((MA1Source * 4) + (Bias * 4))) / MA2Period
MA2Forecast5 = (request.security(syminfo.tickerid, res(MA2Resolution), ma(MA2Type, MA2Source, MA2Period - 5)) * (MA2Period - 5) + ((MA1Source * 5) + (Bias * 5))) / MA2Period

plot(MA2Resolution == "00 Current" and ShowForecasts and MA2Visible ? MA2Forecast1 : na, color=color.yellow, linewidth=1, style=plot.style_circles, title="MA2 Forecast 1", offset=1, show_last=1)
plot(MA2Resolution == "00 Current" and ShowForecasts and MA2Visible ? MA2Forecast2 : na, color=color.yellow, linewidth=1, style=plot.style_circles, title="MA2 Forecast 2", offset=2, show_last=1)
plot(MA2Resolution == "00 Current" and ShowForecasts and MA2Visible ? MA2Forecast3 : na, color=color.yellow, linewidth=1, style=plot.style_circles, title="MA2 Forecast 3", offset=3, show_last=1)
plot(MA2Resolution == "00 Current" and ShowForecasts and MA2Visible ? MA2Forecast4 : na, color=color.yellow, linewidth=1, style=plot.style_circles, title="MA2 Forecast 4", offset=4, show_last=1)
plot(MA2Resolution == "00 Current" and ShowForecasts and MA2Visible ? MA2Forecast5 : na, color=color.yellow, linewidth=1, style=plot.style_circles, title="MA2 Forecast 5", offset=5, show_last=1)


MA3Forecast1 = (request.security(syminfo.tickerid, res(MA3Resolution), ma(MA3Type, MA3Source, MA3Period - 1)) * (MA3Period - 1) + ((MA1Source * 1) + (Bias * 1))) / MA3Period
MA3Forecast2 = (request.security(syminfo.tickerid, res(MA3Resolution), ma(MA3Type, MA3Source, MA3Period - 2)) * (MA3Period - 2) + ((MA1Source * 2) + (Bias * 2))) / MA3Period
MA3Forecast3 = (request.security(syminfo.tickerid, res(MA3Resolution), ma(MA3Type, MA3Source, MA3Period - 3)) * (MA3Period - 3) + ((MA1Source * 3) + (Bias * 3))) / MA3Period
MA3Forecast4 = (request.security(syminfo.tickerid, res(MA3Resolution), ma(MA3Type, MA3Source, MA3Period - 4)) * (MA3Period - 4) + ((MA1Source * 4) + (Bias * 4))) / MA3Period
MA3Forecast5 = (request.security(syminfo.tickerid, res(MA3Resolution), ma(MA3Type, MA3Source, MA3Period - 5)) * (MA3Period - 5) + ((MA1Source * 5) + (Bias * 5))) / MA3Period

plot(MA3Resolution == "00 Current" and ShowForecasts and MA3Visible ? MA3Forecast1 : na, color=color.red, linewidth=1, style=plot.style_circles, title="MA3 Forecast 1", offset=1, show_last=1)
plot(MA3Resolution == "00 Current" and ShowForecasts and MA3Visible ? MA3Forecast2 : na, color=color.red, linewidth=1, style=plot.style_circles, title="MA3 Forecast 2", offset=2, show_last=1)
plot(MA3Resolution == "00 Current" and ShowForecasts and MA3Visible ? MA3Forecast3 : na, color=color.red, linewidth=1, style=plot.style_circles, title="MA3 Forecast 3", offset=3, show_last=1)
plot(MA3Resolution == "00 Current" and ShowForecasts and MA3Visible ? MA3Forecast4 : na, color=color.red, linewidth=1, style=plot.style_circles, title="MA3 Forecast 4", offset=4, show_last=1)
plot(MA3Resolution == "00 Current" and ShowForecasts and MA3Visible ? MA3Forecast5 : na, color=color.red, linewidth=1, style=plot.style_circles, title="MA3 Forecast 5", offset=5, show_last=1)


// Ribbon related code
// For Ribbons to work - they must use the same MAType, MAResolution and MASource.  This is to ensure the ribbons are fair between one to the other.
// Ribbons also will usually look better if MA1Period < MA2Period and MA2Period < MA3Period

// custom functions in  pine - https://www.tradingview.com/wiki/Declaring_Functions
// This function is used to calculate the period to be used on a ribbon based on existing MAs
rperiod(P1, P2, Step, Ribbons) =>
    ((abs(P1 - P2)) / (Ribbons + 1) * Step) + min(P1, P2)
    // divide by +1 so that 5 lines can show.  Divide by 5 and one line shows up on another MA

// MA1-MA2
Ribbon1 = request.security(syminfo.tickerid, res(MA1Resolution), ma(MA1Type, MA1Source, rperiod(MA1Period, MA2Period, 1, 5)))
Ribbon2 = request.security(syminfo.tickerid, res(MA1Resolution), ma(MA1Type, MA1Source, rperiod(MA1Period, MA2Period, 2, 5)))
Ribbon3 = request.security(syminfo.tickerid, res(MA1Resolution), ma(MA1Type, MA1Source, rperiod(MA1Period, MA2Period, 3, 5)))
Ribbon4 = request.security(syminfo.tickerid, res(MA1Resolution), ma(MA1Type, MA1Source, rperiod(MA1Period, MA2Period, 4, 5)))
Ribbon5 = request.security(syminfo.tickerid, res(MA1Resolution), ma(MA1Type, MA1Source, rperiod(MA1Period, MA2Period, 5, 5)))

plot(ShowRibbons and MA1Type == MA2Type and MA1Resolution == MA2Resolution and MA1Source == MA2Source ? Ribbon1 : na, color=color.green, linewidth=1, style=plot.style_line, title="Ribbon1", transp=90)
plot(ShowRibbons and MA1Type == MA2Type and MA1Resolution == MA2Resolution and MA1Source == MA2Source ? Ribbon2 : na, color=color.green, linewidth=1, style=plot.style_line, title="Ribbon2", transp=85)
plot(ShowRibbons and MA1Type == MA2Type and MA1Resolution == MA2Resolution and MA1Source == MA2Source ? Ribbon3 : na, color=color.green, linewidth=1, style=plot.style_line, title="Ribbon3", transp=80)
plot(ShowRibbons and MA1Type == MA2Type and MA1Resolution == MA2Resolution and MA1Source == MA2Source ? Ribbon4 : na, color=color.yellow, linewidth=1, style=plot.style_line, title="Ribbon4", transp=75)
plot(ShowRibbons and MA1Type == MA2Type and MA1Resolution == MA2Resolution and MA1Source == MA2Source ? Ribbon5 : na, color=color.yellow, linewidth=1, style=plot.style_line, title="Ribbon5", transp=70)

// MA2-MA3
Ribbon6 = request.security(syminfo.tickerid, res(MA2Resolution), ma(MA2Type, MA2Source, rperiod(MA2Period, MA3Period, 1, 5)))
Ribbon7 = request.security(syminfo.tickerid, res(MA2Resolution), ma(MA2Type, MA2Source, rperiod(MA2Period, MA3Period, 2, 5)))
Ribbon8 = request.security(syminfo.tickerid, res(MA2Resolution), ma(MA2Type, MA2Source, rperiod(MA2Period, MA3Period, 3, 5)))
Ribbon9 = request.security(syminfo.tickerid, res(MA2Resolution), ma(MA2Type, MA2Source, rperiod(MA2Period, MA3Period, 4, 5)))
Ribbon10 = request.security(syminfo.tickerid, res(MA2Resolution), ma(MA2Type, MA2Source, rperiod(MA2Period, MA3Period, 5, 5)))
        
plot(ShowRibbons and MA2Type == MA3Type and MA2Resolution == MA3Resolution and MA2Source == MA3Source ? Ribbon6 : na, color=color.yellow, linewidth=1, style=plot.style_line, title="Ribbon6", transp=70)
plot(ShowRibbons and MA2Type == MA3Type and MA2Resolution == MA3Resolution and MA2Source == MA3Source ? Ribbon7 : na, color=color.yellow, linewidth=1, style=plot.style_line, title="Ribbon7", transp=75)
plot(ShowRibbons and MA2Type == MA3Type and MA2Resolution == MA3Resolution and MA2Source == MA3Source ? Ribbon8 : na, color=color.red, linewidth=1, style=plot.style_line, title="Ribbon8", transp=80)
plot(ShowRibbons and MA2Type == MA3Type and MA2Resolution == MA3Resolution and MA2Source == MA3Source ? Ribbon9 : na, color=color.red, linewidth=1, style=plot.style_line, title="Ribbon9", transp=85)
plot(ShowRibbons and MA2Type == MA3Type and MA2Resolution == MA3Resolution and MA2Source == MA3Source ? Ribbon10 : na, color=color.red, linewidth=1, style=plot.style_line, title="Ribbon10", transp=90)

// Strategy Specific
ProfitTarget = (close * (TakeProfitPercent / 100)) / syminfo.mintick
LossTarget = (close * (StopLossPercent / 100)) / syminfo.mintick

if MA12Crossover and TradeMA12Crosses
    //https://www.tradingview.com/pine-script-reference/#fun_strategy{dot}entry
    strategy.entry("1 over 2", true) // buy by market
    strategy.exit("profit or loss", "1 over 2", profit = ProfitTarget, loss = LossTarget)
if MA12Crossunder and TradeMA12Crosses
    //https://www.tradingview.com/pine-script-reference/#fun_strategy{dot}close
    strategy.close("1 over 2") // sell by market
    
if MA13Crossover and TradeMA13Crosses
    //https://www.tradingview.com/pine-script-reference/#fun_strategy{dot}entry
    strategy.entry("1 over 3", true) // buy by market
    strategy.exit("profit or loss", "1 over 3", profit = ProfitTarget, loss = LossTarget)
if MA13Crossunder and TradeMA13Crosses
    //https://www.tradingview.com/pine-script-reference/#fun_strategy{dot}close
    strategy.close("1 over 3") // sell by market
    
if MA23Crossover and TradeMA23Crosses
    //https://www.tradingview.com/pine-script-reference/#fun_strategy{dot}entry
    strategy.entry("2 over 3", true) // buy by market
    strategy.exit("profit or loss", "2 over 3", profit = ProfitTarget, loss = LossTarget)
if MA23Crossunder and TradeMA23Crosses
    //https://www.tradingview.com/pine-script-reference/#fun_strategy{dot}close
    strategy.close("2 over 3") // sell by market
    

Lebih banyak