Rata-rata Pergerakan Golden Cross Menembus Strategi Bollinger Band
Ringkasan
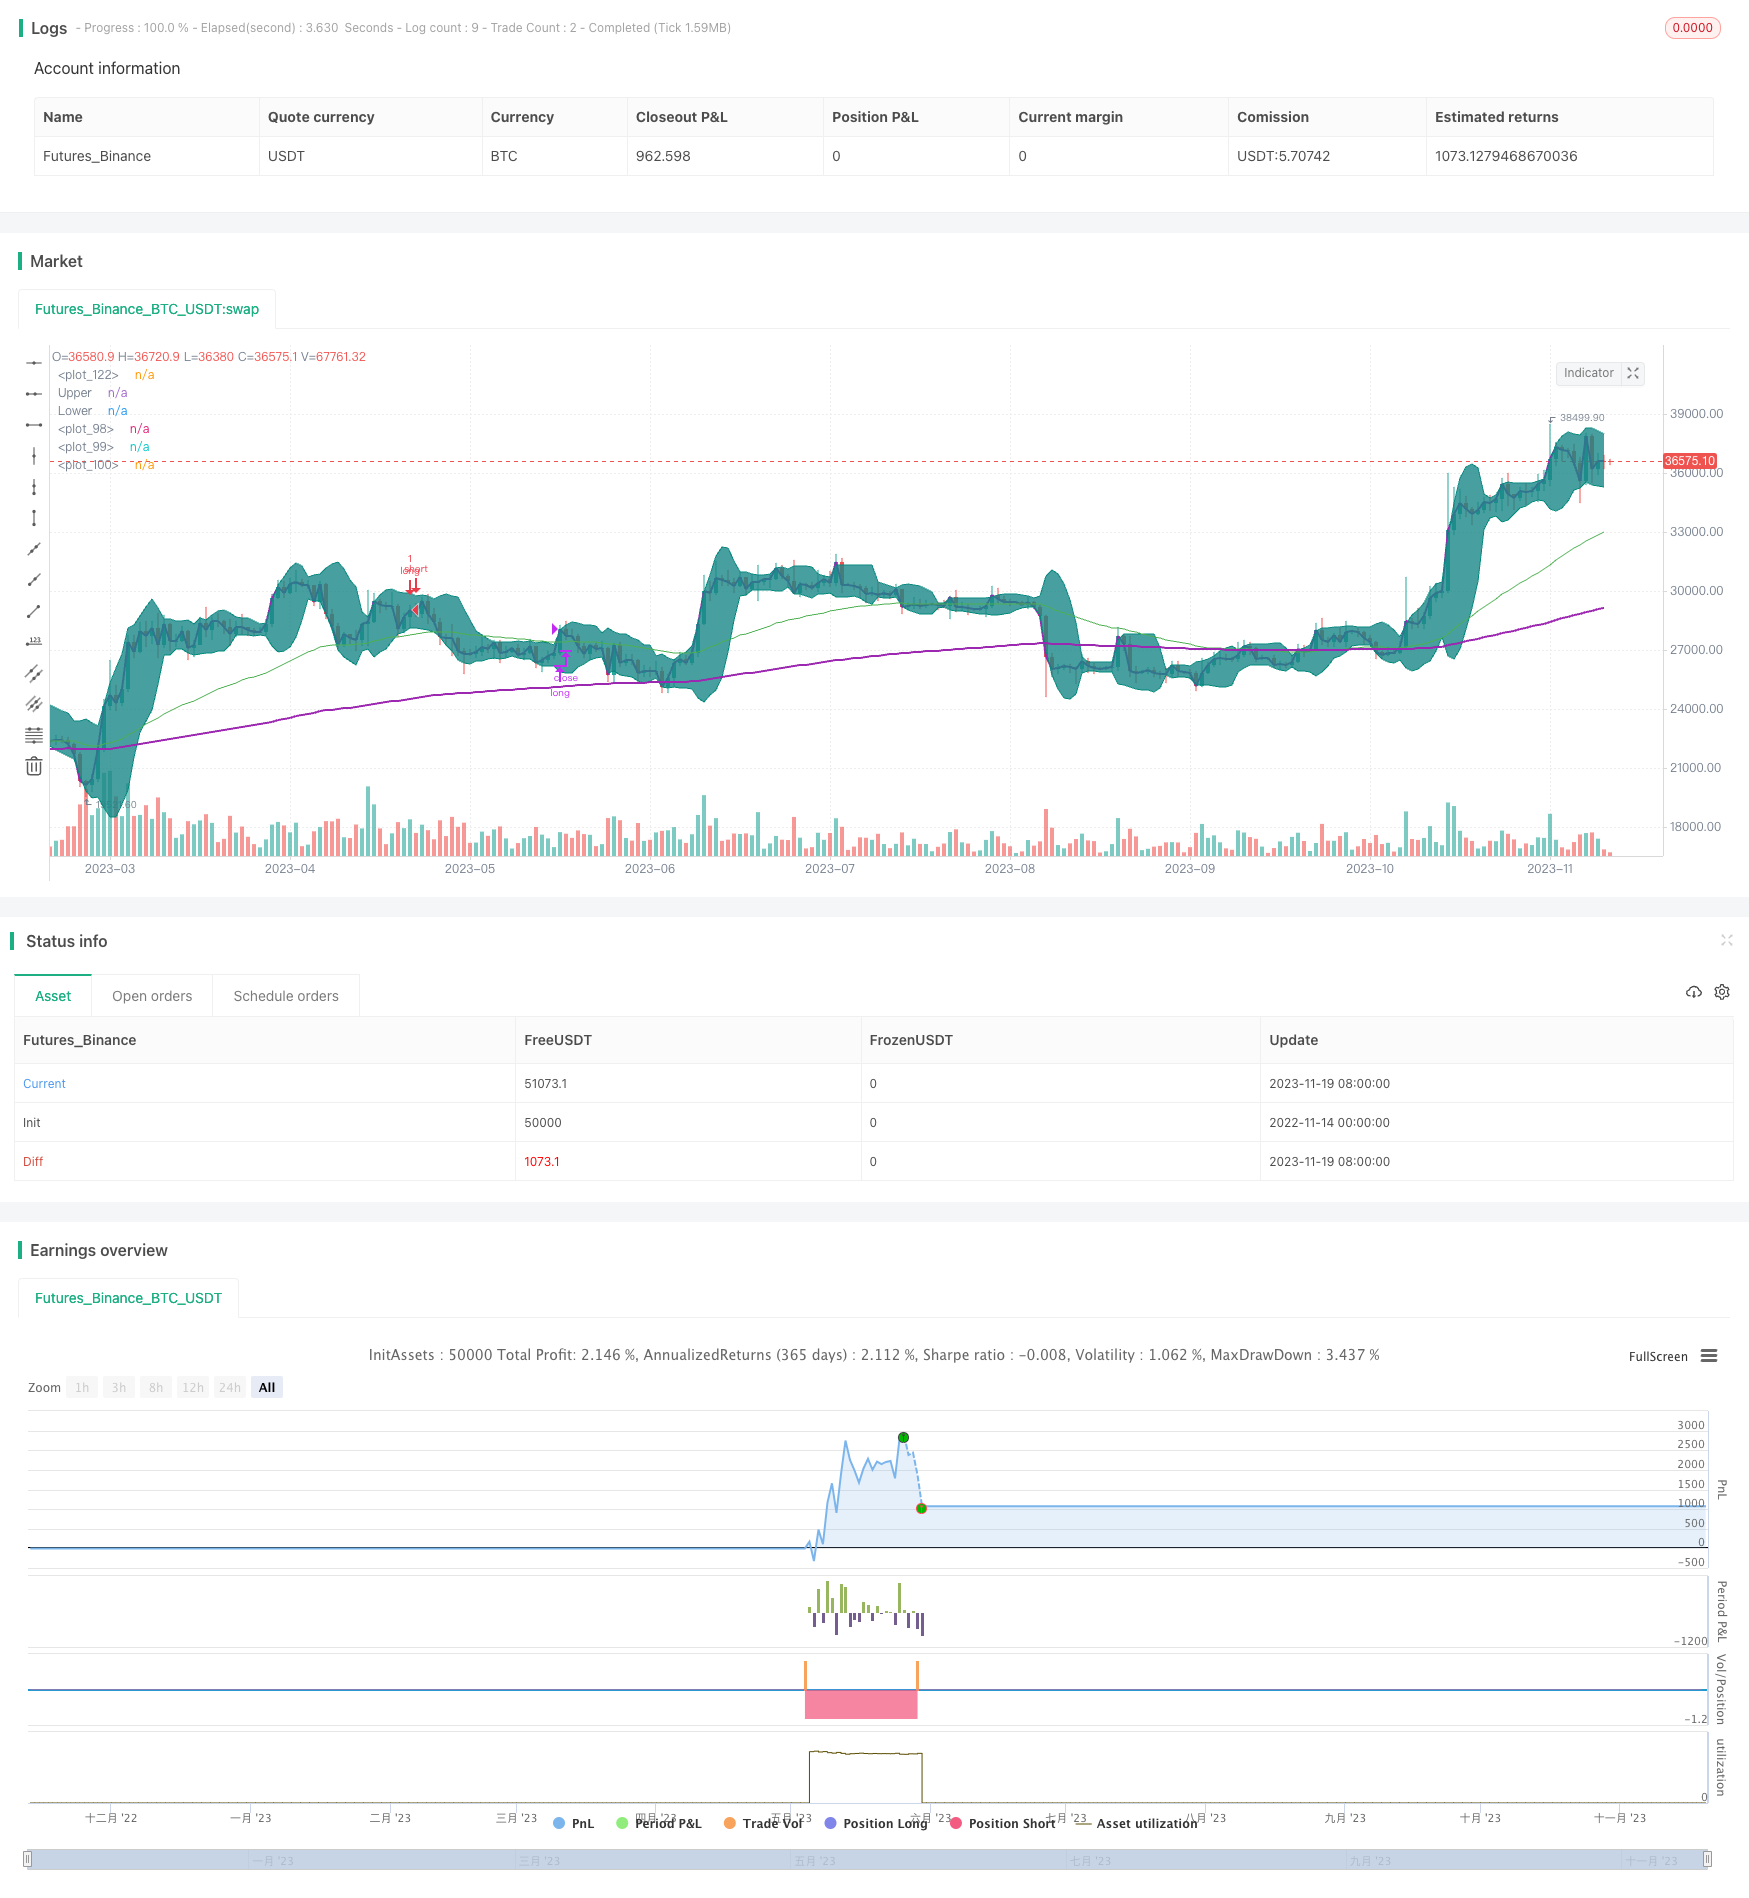
Strategi ini menggabungkan indikator rata-rata bergerak, indikator pita Brin dan indikator harga rata-rata tertimbang volume transaksi, untuk menilai masuk dalam kondisi pembentukan garpu emas, garis rata-rata pendek yang melintasi garis rata-rata panjang. Strategi ini juga menggunakan saluran pita Brin, hanya mempertimbangkan masuk ketika harga menyentuh jalur bawah pita Brin, sehingga menghindari sering masuk dalam pergerakan pasar.
Prinsip Strategi
Strategi ini terutama menggunakan indikator rata-rata untuk menentukan arah tren, dan menggunakan Brin untuk menentukan posisi yang akan dibeli. Secara khusus, strategi ini mencakup beberapa aturan kunci berikut:
Menggunakan 50 hari EMA dan 200 hari EMA untuk membangun sistem penilaian garpu emas, yang dianggap berada dalam tren naik multi-kepala ketika melewati rata-rata bergerak lambat di atas rata-rata bergerak cepat;
Jika harga lebih besar dari VWAP, maka Anda akan berpikir bahwa Anda berada di fase kenaikan harga dan itu akan membantu Anda untuk melakukan lebih banyak saham.
Harga baru saja menyentuh atau menembus Bollinger Bands, yang menunjukkan bahwa harga saham mungkin berada di dekat titik rebound dan memiliki peluang yang lebih baik;
Setelah masuk ke posisi multi-head, harga melebihi Brin yang naik ke jalur dan berhenti tepat waktu untuk keluar.
Kombinasi dari beberapa aturan ini memungkinkan strategi ini untuk memilih tempat pembelian yang tepat dalam situasi pasar banteng, dan mengatur stop loss stop loss untuk memastikan keuntungan.
Keunggulan Strategis
Menggunakan sistem penilaian garpu emas untuk menentukan arah tren besar dan menghindari win-win dalam situasi yang bergejolak;
Indikator VWAP dapat menentukan arah pergerakan harga, sehingga pilihan tempat pembelian lebih akurat;
Indikator Brin-Band menilai titik beli untuk membuat strategi lebih tangguh, sambil mengatur stop loss stop loss untuk mengunci keuntungan;
Beberapa indikator saling diverifikasi untuk membuat penilaian strategi lebih akurat dan lebih dapat diandalkan.
Risiko Strategis dan Solusi
Sistem penilaian garpu emas dapat mengirimkan sinyal palsu, dan harus mengurangi panjang siklus rata-rata dengan tepat, dan bekerja sama dengan validasi indikator lainnya;
Setelan parameter Brinband yang tidak tepat juga dapat membuat strategi tidak efektif, dan harus disesuaikan dengan siklus Brinband dan parameter standar deviasi;
Stop loss setting terlalu longgar dan tidak dapat mengontrol kerugian secara efektif.
Arah optimasi strategi
mengoptimalkan kombinasi garis rata-rata garpu emas, menguji parameter garis rata yang berbeda, dan menemukan parameter optimal;
menguji parameter pita Brin dengan periode yang berbeda untuk menemukan kombinasi parameter terbaik untuk amplitudo dan dispersi;
Uji coba dan optimalisasi jangkauan stop loss agar dapat mengontrol risiko secara efektif dan tidak terlalu mudah dipicu.
Meringkaskan
Strategi ini menggunakan sistem linier, Brinband, dan indikator VWAP untuk menentukan waktu masuk, dengan keseimbangan antara peluang penemuan dan risiko pengendalian. Dengan optimasi parameter berikutnya dan modifikasi peraturan, diharapkan untuk mengunci peluang berkelanjutan di industri dan pasar.
/*backtest
start: 2022-11-14 00:00:00
end: 2023-11-20 00:00:00
period: 1d
basePeriod: 1h
exchanges: [{"eid":"Futures_Binance","currency":"BTC_USDT"}]
*/

// This source code is subject to the terms of the Mozilla Public License 2.0 at https://mozilla.org/MPL/2.0/
// © mohanee

//@version=4
strategy(title="VWAP and BB strategy [$$]", overlay=true,pyramiding=2, default_qty_value=1, default_qty_type=strategy.fixed,    initial_capital=10000, currency=currency.USD)


fromDay = input(defval = 1, title = "From Day", minval = 1, maxval = 31)
fromMonth = input(defval = 6, title = "From Month", minval = 1, maxval = 12)
fromYear = input(defval = 2020, title = "From Year", minval = 1970)

// To Date Inputs
toDay = input(defval = 1, title = "To Day", minval = 1, maxval = 31)
toMonth = input(defval = 8, title = "To Month", minval = 1, maxval = 12)
toYear = input(defval = 2020, title = "To Year", minval = 1970)

// Calculate start/end date and time condition
DST = 1 //day light saving for usa
//--- Europe
London = iff(DST==0,"0000-0900","0100-1000")
//--- America
NewYork = iff(DST==0,"0400-1300","0500-1400")
//--- Pacific
Sydney = iff(DST==0,"1300-2200","1400-2300")
//--- Asia
Tokyo = iff(DST==0,"1500-2400","1600-0100")

//-- Time In Range
timeinrange(res, sess) => time(res, sess) != 0

london = timeinrange(timeframe.period, London)
newyork = timeinrange(timeframe.period, NewYork)

startDate = timestamp(fromYear, fromMonth, fromDay, 00, 00)
finishDate = timestamp(toYear, toMonth, toDay, 00, 00)
time_cond = time >= startDate and time <= finishDate


is_price_dipped_bb(pds,source1) =>
    t_bbDipped=false
    for i=1 to pds
        t_bbDipped:=  (t_bbDipped   or  close[i]<source1) ? true : false
        if t_bbDipped==true
            break
        else
            continue

    t_bbDipped


is_bb_per_dipped(pds,bbrSrc) =>
    t_bbDipped=false
    for i=1 to pds
        t_bbDipped:=  (t_bbDipped   or  bbrSrc[i]<=0) ? true : false
        if t_bbDipped==true
            break
        else
            continue

    t_bbDipped


// variables  BEGIN
shortEMA = input(50, title="fast EMA", minval=1)
longEMA = input(200, title="slow EMA", minval=1)

//BB

smaLength = input(7, title="BB SMA Length", minval=1)
bbsrc = input(close, title="BB Source")

strategyCalcOption = input(title="strategy to use", type=input.string, options=["BB", "BB_percentageB"],      defval="BB")


//addOnDivergence = input(true,title="Add to existing on Divergence")
//exitOption = input(title="exit on RSI or BB", type=input.string, options=["RSI", "BB"],      defval="BB")

//bbSource = input(title="BB  source", type=input.string, options=["close", "vwap"],      defval="close")

//vwap_res = input(title="VWAP Resolution", type=input.resolution, defval="session")
stopLoss = input(title="Stop Loss%", defval=1, minval=1)

//variables  END

longEMAval= ema(close, longEMA)
shortEMAval= ema(close, shortEMA)
ema200val = ema(close, 200)


vwapVal=vwap(close)


// Drawings

//plot emas
plot(shortEMAval, color = color.green, linewidth = 1, transp=0)
plot(longEMAval, color = color.orange, linewidth = 1, transp=0)
plot(ema200val, color = color.purple, linewidth = 2, style=plot.style_line ,transp=0)


//bollinger calculation
mult = input(2.0, minval=0.001, maxval=50, title="StdDev")
basis = sma(bbsrc, smaLength)
dev = mult * stdev(bbsrc, smaLength)
upperBand = basis + dev
lowerBand = basis - dev
offset = input(0, "Offset", type = input.integer, minval = -500, maxval = 500)

bbr = (bbsrc - lowerBand)/(upperBand - lowerBand)
//bollinger calculation

//plot bb
//plot(basis, "Basis", color=#872323, offset = offset)
p1 = plot(upperBand, "Upper", color=color.teal, offset = offset)
p2 = plot(lowerBand, "Lower", color=color.teal, offset = offset)
fill(p1, p2, title = "Background", color=#198787, transp=95)


plot(vwapVal, color = color.purple, linewidth = 2, transp=0)


// Colour background

//barcolor(shortEMAval>longEMAval and close<=lowerBand ? color.yellow: na)


//longCondition=  shortEMAval > longEMAval and  close>open and  close>vwapVal
longCondition=  ( shortEMAval > longEMAval  and close>open and close>vwapVal and close<upperBand ) //and time_cond //     and  close>=vwapVal


//Entry
strategy.entry(id="long", comment="VB LE" , long=true,  when= longCondition and ( strategyCalcOption=="BB"? is_price_dipped_bb(10,lowerBand) : is_bb_per_dipped(10,bbr)  )   and strategy.position_size<1 )   //is_price_dipped_bb(10,lowerBand))  //and strategy.position_size<1       is_bb_per_dipped(15,bbr)


//add to the existing position
strategy.entry(id="long", comment="Add" , long=true,  when=strategy.position_size>=1 and close<strategy.position_avg_price and close>vwapVal) //and time_cond)

barcolor(strategy.position_size>=1  ? color.blue: na)


strategy.close(id="long", comment="TP Exit",   when=crossover(close,upperBand) )

//stoploss
stopLossVal =   strategy.position_avg_price * (1-(stopLoss*0.01) )
//strategy.close(id="long", comment="SL Exit",   when= close < stopLossVal)

//strategy.risk.max_intraday_loss(stopLoss, strategy.percent_of_equity)