Strategi pelacakan tren jangka pendek berbasis Bollinger Bands


Tanggal Pembuatan: 2023-11-23 17:01:12 Akhirnya memodifikasi: 2023-11-23 17:01:12
menyalin: 0 Jumlah klik: 706
1
fokus pada
1617
Pengikut

Strategi pelacakan tren jangka pendek berbasis Bollinger Bands

Ringkasan

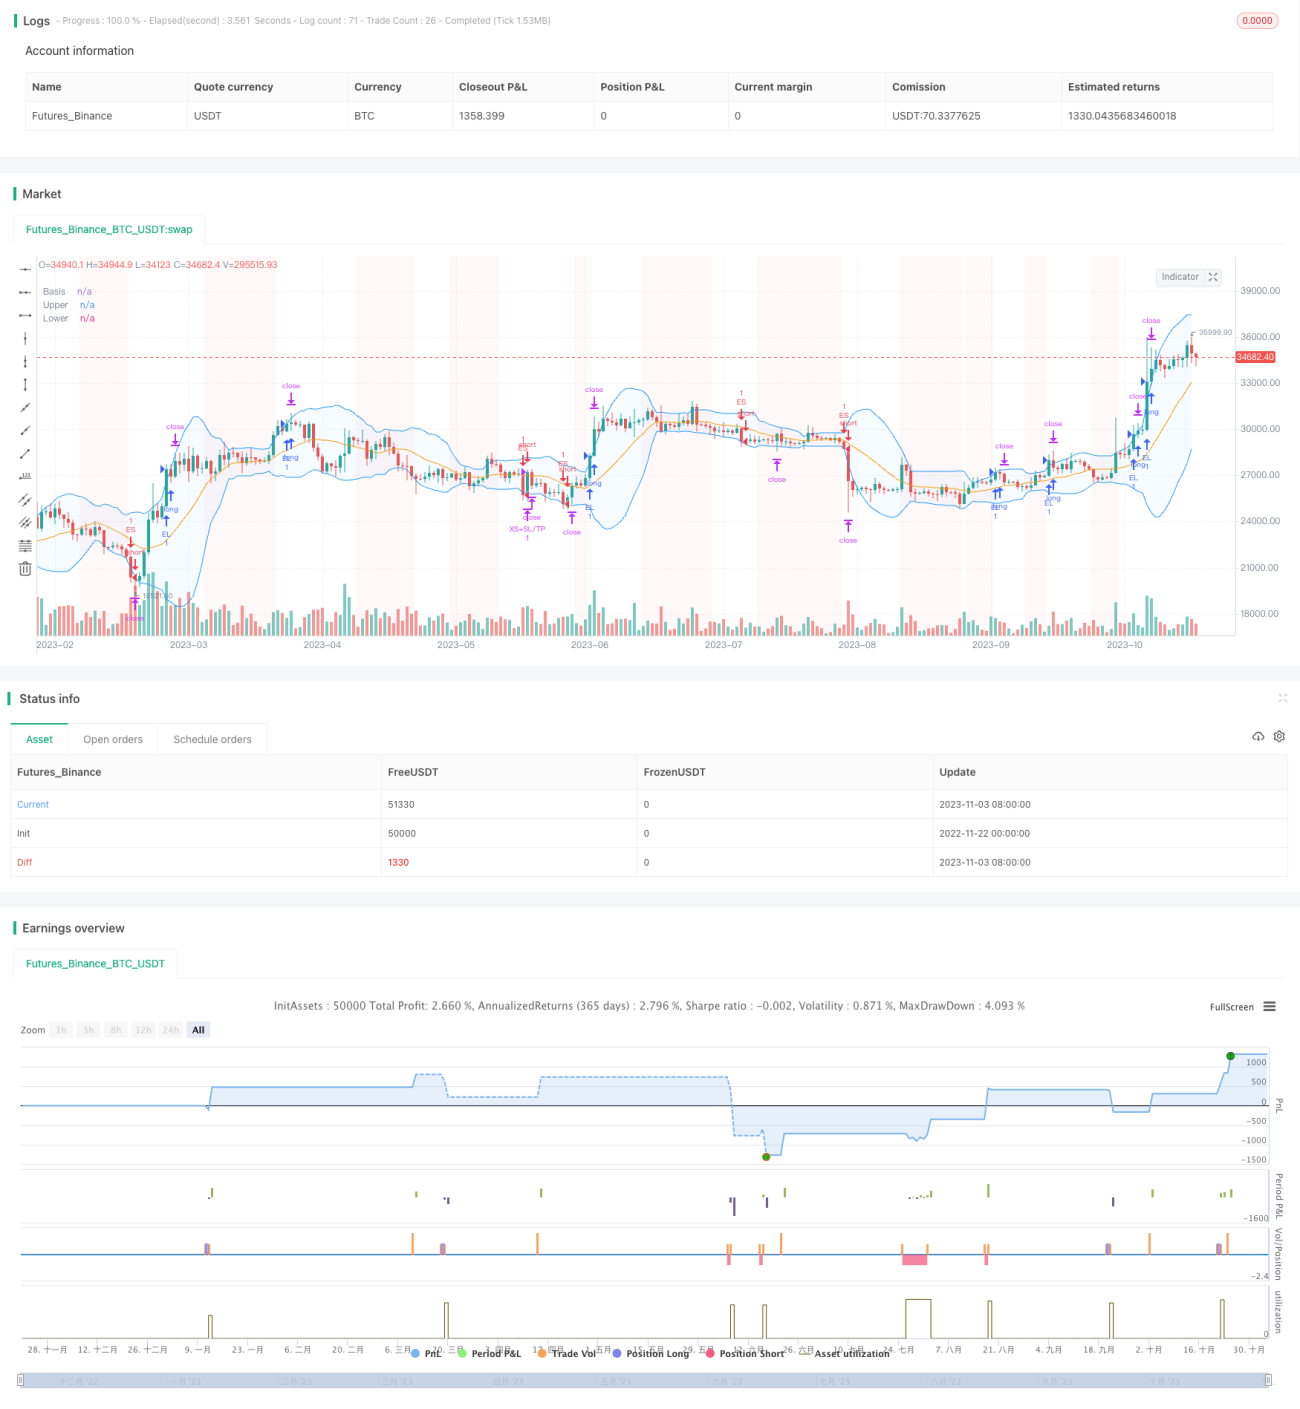
Strategi Brin Belt Breakthrough adalah strategi jangka pendek yang mengikuti tren berdasarkan indikator Brin Belt. Strategi ini dapat melakukan operasi di kedua arah head and shoulders, berlaku untuk kontrak spot dan perpetual, terutama untuk tren.

Strategi ini memiliki konfigurasi yang sangat tinggi, memungkinkan pengguna untuk mengatur periode dan deviasi parameter Brinbelt, filter tren, filter volatilitas, filter arah perdagangan, filter tingkat perubahan, dan filter tanggal. Selain itu, ia juga mengatur stop loss, stop loss, dan tracking stop loss untuk posisi multihead dan kosong, memastikan metode manajemen risiko yang komprehensif.

Prinsip Strategi

Indikator utama dari strategi ini adalah Bollinger Bands. Bollinger Bands terdiri dari tiga garis tengah, atas, dan bawah, yang mewakili garis rata-rata harga, batas atas fluktuasi, dan batas bawah fluktuasi.

Selain itu, ada beberapa filter tambahan yang digunakan untuk menghindari Noise trading. Filter-filter ini meliputi:

  1. Filter tren: harga di atas rata-rata bergerak dan harga di bawah rata-rata bergerak;

  2. Filter volatilitas: hanya berdagang saat volatilitas meningkat;

  3. Filter arah perdagangan: pilih hanya melakukan lebih, hanya melakukan lebih atau perdagangan dua arah sesuai dengan atribut indikator;

  4. Filter tingkat perubahan: harga hanya masuk ketika tingkat perubahan terhadap harga penutupan hari perdagangan sebelumnya mencapai tingkat tertentu;

  5. Filter tanggal: pengaturan interval waktu untuk pengukuran ulang.

Sinyal perdagangan dihasilkan ketika semua kondisi filter terpenuhi. Stop loss dan tracking stop loss memastikan pengelolaan risiko. Selain itu, pengaturan kerugian maksimum dalam satu hari mencegah penarikan besar dalam satu hari.

Analisis Keunggulan

Strategi ini memiliki keuntungan sebagai berikut:

  1. Dengan menggunakan indikator BRI sebagai sinyal perdagangan inti, reliabilitas yang tinggi;

  2. Desain multi-filter menghindari kesalahan transaksi, konfigurasi yang kuat;

  3. Stop Loss, Stop Loss, dan Trace Stop Loss adalah komprehensif dan fleksibel.

  4. Setel kerugian maksimum dalam satu hari untuk pengendalian efektif penarikan dalam satu hari.

  5. Ini cocok untuk pasar yang sedang tren, dengan potensi keuntungan yang besar.

Analisis risiko

Strategi ini juga memiliki beberapa risiko:

  1. Brin-belt rupture mudah terbentuk di bagian kepala dan bagian bawah, yang dapat menyebabkan kerusakan.

  2. Di pasar yang tidak stabil, filter bisa terlalu ketat dan melewatkan peluang perdagangan.

  3. Jembatan ini juga bisa digunakan untuk menopang jalan raya, jalan tol, dan jalan raya.

  4. Dalam kasus ekstrim, kerugian besar tidak dapat dihindari sepenuhnya.

Untuk menghadapi risiko di atas, kondisi penyaringan dapat dilepaskan secara tepat, atau intervensi buatan untuk menutup sebagian posisi, mengurangi jarak stop loss, dll.

Arah optimasi

Strategi ini dapat dipertimbangkan untuk dioptimalkan dari beberapa aspek berikut:

  1. Mencoba kombinasi parameter yang berbeda untuk menemukan interval parameter yang optimal;

  2. Menambahkan model pembelajaran mesin untuk mengoptimalkan parameter secara dinamis;

  3. Mencari cara yang lebih efektif untuk menghentikan kerugian, seperti menghentikan waktu, menghentikan amplitudo, dll.

  4. Menggunakan indikator emosi untuk mengintervensi secara proaktif dalam situasi ekstrem;

  5. Dalam kombinasi dengan produk yang relevan, untuk melakukan arbitrage statistik.

Meringkaskan

Strategi Brin Belt Breakout adalah strategi mengikuti tren garis pendek yang terbukti andal. Ini menggunakan indikator Brin Belt sebagai sinyal dan mengatur beberapa filter untuk memastikan keandalan sinyal. Sementara itu, mekanisme penghentian kerugian dan pengendalian risiko yang komprehensif mengendalikan risiko.

Kode Sumber Strategi
/*backtest
start: 2022-11-22 00:00:00
end: 2023-11-04 05:20:00
period: 1d
basePeriod: 1h
exchanges: [{"eid":"Futures_Binance","currency":"BTC_USDT"}]
*/


//@version=5
strategy("Bollinger Bands - Breakout Strategy",overlay=true
         )


// Define the length of the Bollinger Bands
bbLengthInput = input.int (15,title="Length", group="Bollinger Bands", inline="BB")
bbDevInput = input.float (2.0,title="StdDev", group="Bollinger Bands", inline="BB")

// Define the settings for the Trend Filter
trendFilterInput = input.bool(false, title="Above/Below", group = "Trend Filter", inline="Trend")
trendFilterPeriodInput = input(223,title="", group = "Trend Filter", inline="Trend")
trendFilterType = input.string (title="", defval="EMA",options=["EMA","SMA","RMA", "WMA"], group = "Trend Filter", inline="Trend")

volatilityFilterInput = input.bool(true,title="StdDev", group = "Volatility Filter", inline="Vol")
volatilityFilterStDevLength = input(15,title="",group = "Volatility Filter", inline="Vol")
volatilityStDevMaLength = input(15,title=">MA",group = "Volatility Filter", inline="Vol")

// ROC Filter

// f_security function by LucF for PineCoders available here: https://www.tradingview.com/script/cyPWY96u-How-to-avoid-repainting-when-using-security-PineCoders-FAQ/
f_security(_sym, _res, _src, _rep) => request.security(_sym, _res, _src[not _rep and barstate.isrealtime ? 1 : 0])[_rep or barstate.isrealtime ? 0 : 1]
high_daily = f_security(syminfo.tickerid, "D", high, false)

roc_enable = input.bool(false, "", group="ROC Filter from CloseD", inline="roc")
roc_threshold = input.float(1, "Treshold", step=0.5, group="ROC Filter from CloseD", inline="roc")

closed = f_security(syminfo.tickerid,"1D",close, false)
roc_filter= roc_enable ? (close-closed)/closed*100  > roc_threshold : true

// Trade Direction Filter

// tradeDirectionInput = input.string("Auto",options=["Auto", "Long&Short","Long Only", "Short Only"], title="Trade", group="Direction Filter", tooltip="Auto: if a PERP is detected (in the symbol description), trade long and short\n Otherwise as per user-input")

// tradeDirection = switch tradeDirectionInput
// 	"Auto" => str.contains(str.lower(syminfo.description), "perp") or str.contains(str.lower(syminfo.description), ".p") ? strategy.direction.all : strategy.direction.long
// 	"Long&Short" => strategy.direction.all
// 	"Long Only" => strategy.direction.long
//     "Short Only" => strategy.direction.short
// 	=> strategy.direction.all

// strategy.risk.allow_entry_in(tradeDirection)


// Calculate and plot the Bollinger Bands
[bbMiddle, bbUpper, bbLower] = ta.bb (close, bbLengthInput, bbDevInput)

plot(bbMiddle, "Basis", color=color.orange)
bbUpperPlot = plot(bbUpper, "Upper", color=color.blue)
bbLowerrPlot = plot(bbLower, "Lower", color=color.blue)
fill(bbUpperPlot, bbLowerrPlot, title = "Background", color=color.new(color.blue, 95))


// Calculate and view Trend Filter

float tradeConditionMa = switch trendFilterType
	"EMA" => ta.ema(close, trendFilterPeriodInput)
	"SMA" => ta.sma(close, trendFilterPeriodInput)
	"RMA" => ta.rma(close, trendFilterPeriodInput)
    "WMA" => ta.wma(close, trendFilterPeriodInput)
	// Default used when the three first cases do not match.
	=> ta.wma(close, trendFilterPeriodInput)


trendConditionLong  = trendFilterInput ? close > tradeConditionMa : true
trendConditionShort = trendFilterInput ? close < tradeConditionMa : true
plot(trendFilterInput ? tradeConditionMa : na, color=color.yellow)

// Calculate and view Volatility Filter

stdDevClose = ta.stdev(close,volatilityFilterStDevLength)
volatilityCondition = volatilityFilterInput ? stdDevClose > ta.sma(stdDevClose,volatilityStDevMaLength) : true

bbLowerCrossUnder =  ta.crossunder(close, bbLower)
bbUpperCrossOver =  ta.crossover(close, bbUpper)

bgcolor(volatilityCondition ? na : color.new(color.red, 95))


// Date Filter

start = input(timestamp("2017-01-01"), "Start", group="Date Filter")
finish = input(timestamp("2050-01-01"), "End", group="Date Filter")

date_filter = true

// Entry and Exit Conditions

entryLongCondition = bbUpperCrossOver and trendConditionLong and volatilityCondition and date_filter and roc_filter
entryShortCondition = bbLowerCrossUnder and trendConditionShort and volatilityCondition and date_filter and roc_filter

exitLongCondition = bbLowerCrossUnder
exitShortCondition = bbUpperCrossOver

// Orders

if entryLongCondition
    strategy.entry("EL", strategy.long)

if entryShortCondition
    strategy.entry("ES", strategy.short)

if exitLongCondition
    strategy.close("EL")

if exitShortCondition
    strategy.close("ES")


// Long SL/TP/TS

xl_ts_percent      = input.float(2,step=0.5, title= "TS", group="Exit Long", inline="LTS", tooltip="Trailing Treshold %")
xl_to_percent      = input.float(0.5, step=0.5, title= "TO", group="Exit Long", inline="LTS", tooltip="Trailing Offset %")

xl_ts_tick = xl_ts_percent * close/syminfo.mintick/100
xl_to_tick = xl_to_percent * close/syminfo.mintick/100

xl_sl_percent      = input.float (2, step=0.5, title="SL",group="Exit Long", inline="LSLTP") 
xl_tp_percent      = input.float(9, step=0.5, title="TP",group="Exit Long", inline="LSLTP")

xl_sl_price = strategy.position_avg_price * (1-xl_sl_percent/100)
xl_tp_price = strategy.position_avg_price * (1+xl_tp_percent/100)

strategy.exit("XL+SL/TP", "EL", stop=xl_sl_price, limit=xl_tp_price, trail_points=xl_ts_tick, trail_offset=xl_to_tick,comment_loss= "XL-SL", comment_profit = "XL-TP",comment_trailing = "XL-TS")

// Short SL/TP/TS
xs_ts_percent      = input.float(2,step=0.5, title= "TS",group="Exit Short", inline ="STS", tooltip="Trailing Treshold %")
xs_to_percent      = input.float(0.5, step=0.5, title= "TO",group="Exit Short", inline ="STS", tooltip="Trailing Offset %")

xs_ts_tick = xs_ts_percent * close/syminfo.mintick/100
xs_to_tick = xs_to_percent * close/syminfo.mintick/100

xs_sl_percent      = input.float (2, step=0.5, title="SL",group="Exit Short", inline="ESSLTP", tooltip="Stop Loss %") 
xs_tp_percent      = input.float(9, step=0.5, title="TP",group="Exit Short",  inline="ESSLTP", tooltip="Take Profit %")

xs_sl_price = strategy.position_avg_price * (1+xs_sl_percent/100)
xs_tp_price = strategy.position_avg_price * (1-xs_tp_percent/100)

strategy.exit("XS+SL/TP", "ES", stop=xs_sl_price, limit=xs_tp_price, trail_points=xs_ts_tick, trail_offset=xs_to_tick,comment_loss= "XS-SL", comment_profit = "XS-TP",comment_trailing = "XS-TS")


max_intraday_loss = input.int(10, title="Max Intraday Loss (Percent)", group="Risk Management")

//strategy.risk.max_intraday_loss(max_intraday_loss, strategy.percent_of_equity)

// Monthly Returns table, modified from QuantNomad. Please put calc_on_every_tick = true to plot it. 

monthly_table(int results_prec, bool results_dark) =>
    new_month = month(time) != month(time[1])
    new_year  = year(time)  != year(time[1])
    
    eq = strategy.equity
    
    bar_pnl = eq / eq[1] - 1
    
    cur_month_pnl = 0.0
    cur_year_pnl  = 0.0
    
    // Current Monthly P&L
    cur_month_pnl := new_month ? 0.0 : 
                     (1 + cur_month_pnl[1]) * (1 + bar_pnl) - 1 
    
    // Current Yearly P&L
    cur_year_pnl := new_year ? 0.0 : 
                     (1 + cur_year_pnl[1]) * (1 + bar_pnl) - 1  
    
    // Arrays to store Yearly and Monthly P&Ls
    var month_pnl  = array.new_float(0)
    var month_time = array.new_int(0)
    
    var year_pnl  = array.new_float(0)
    var year_time = array.new_int(0)
    
    last_computed = false
    
    if (not na(cur_month_pnl[1]) and (new_month or barstate.islast))
        if (last_computed[1])
            array.pop(month_pnl)
            array.pop(month_time)
            
        array.push(month_pnl , cur_month_pnl[1])
        array.push(month_time, time[1])
    
    if (not na(cur_year_pnl[1]) and (new_year or barstate.islast))
        if (last_computed[1])
            array.pop(year_pnl)
            array.pop(year_time)
            
        array.push(year_pnl , cur_year_pnl[1])
        array.push(year_time, time[1])
    
    last_computed := barstate.islast ? true : nz(last_computed[1])
    
    // Monthly P&L Table    
    var monthly_table = table(na)
    
    cell_hr_bg_color = results_dark ? #0F0F0F : #F5F5F5
    cell_hr_text_color = results_dark ? #D3D3D3 : #555555
    cell_border_color = results_dark ? #000000 : #FFFFFF

    // ell_hr_bg_color = results_dark ? #0F0F0F : #F5F5F5
    // cell_hr_text_color = results_dark ? #D3D3D3 : #555555
    // cell_border_color = results_dark ? #000000 : #FFFFFF
    if (barstate.islast)
        monthly_table := table.new(position.bottom_right, columns = 14, rows = array.size(year_pnl) + 1, bgcolor=cell_hr_bg_color,border_width=1,border_color=cell_border_color)
    
        table.cell(monthly_table, 0,  0, syminfo.tickerid + " " + timeframe.period,     text_color=cell_hr_text_color, bgcolor=cell_hr_bg_color)
        table.cell(monthly_table, 1,  0, "Jan",  text_color=cell_hr_text_color, bgcolor=cell_hr_bg_color)
        table.cell(monthly_table, 2,  0, "Feb",  text_color=cell_hr_text_color, bgcolor=cell_hr_bg_color)
        table.cell(monthly_table, 3,  0, "Mar",  text_color=cell_hr_text_color, bgcolor=cell_hr_bg_color)
        table.cell(monthly_table, 4,  0, "Apr",  text_color=cell_hr_text_color, bgcolor=cell_hr_bg_color)
        table.cell(monthly_table, 5,  0, "May",  text_color=cell_hr_text_color, bgcolor=cell_hr_bg_color)
        table.cell(monthly_table, 6,  0, "Jun",  text_color=cell_hr_text_color, bgcolor=cell_hr_bg_color)
        table.cell(monthly_table, 7,  0, "Jul",  text_color=cell_hr_text_color, bgcolor=cell_hr_bg_color)
        table.cell(monthly_table, 8,  0, "Aug",  text_color=cell_hr_text_color, bgcolor=cell_hr_bg_color)
        table.cell(monthly_table, 9,  0, "Sep",  text_color=cell_hr_text_color, bgcolor=cell_hr_bg_color)
        table.cell(monthly_table, 10, 0, "Oct",  text_color=cell_hr_text_color, bgcolor=cell_hr_bg_color)
        table.cell(monthly_table, 11, 0, "Nov",  text_color=cell_hr_text_color, bgcolor=cell_hr_bg_color)
        table.cell(monthly_table, 12, 0, "Dec",  text_color=cell_hr_text_color, bgcolor=cell_hr_bg_color)
        table.cell(monthly_table, 13, 0, "Year", text_color=cell_hr_text_color, bgcolor=cell_hr_bg_color)
    
        for yi = 0 to array.size(year_pnl) - 1
            table.cell(monthly_table, 0,  yi + 1, str.tostring(year(array.get(year_time, yi))), text_color=cell_hr_text_color, bgcolor=cell_hr_bg_color)
            
            y_color = array.get(year_pnl, yi) > 0 ? color.lime :  array.get(year_pnl, yi) < 0 ? color.red : color.gray
            table.cell(monthly_table, 13, yi + 1, str.tostring(math.round(array.get(year_pnl, yi) * 100, results_prec)), bgcolor = y_color)
            
        for mi = 0 to array.size(month_time) - 1
            m_row   = year(array.get(month_time, mi))  - year(array.get(year_time, 0)) + 1
            m_col   = month(array.get(month_time, mi)) 
            m_color = array.get(month_pnl, mi) > 0 ? color.lime : array.get(month_pnl, mi) < 0 ? color.red : color.gray
            
            table.cell(monthly_table, m_col, m_row, str.tostring(math.round(array.get(month_pnl, mi) * 100, results_prec)), bgcolor = m_color)

results_prec = input(2, title = "Precision", group="Results Table")
results_dark = input.bool(defval=true, title="Dark Mode", group="Results Table")
monthly_table(results_prec, results_dark)