Strategi akumulasi rebound rata-rata bergerak
Ringkasan
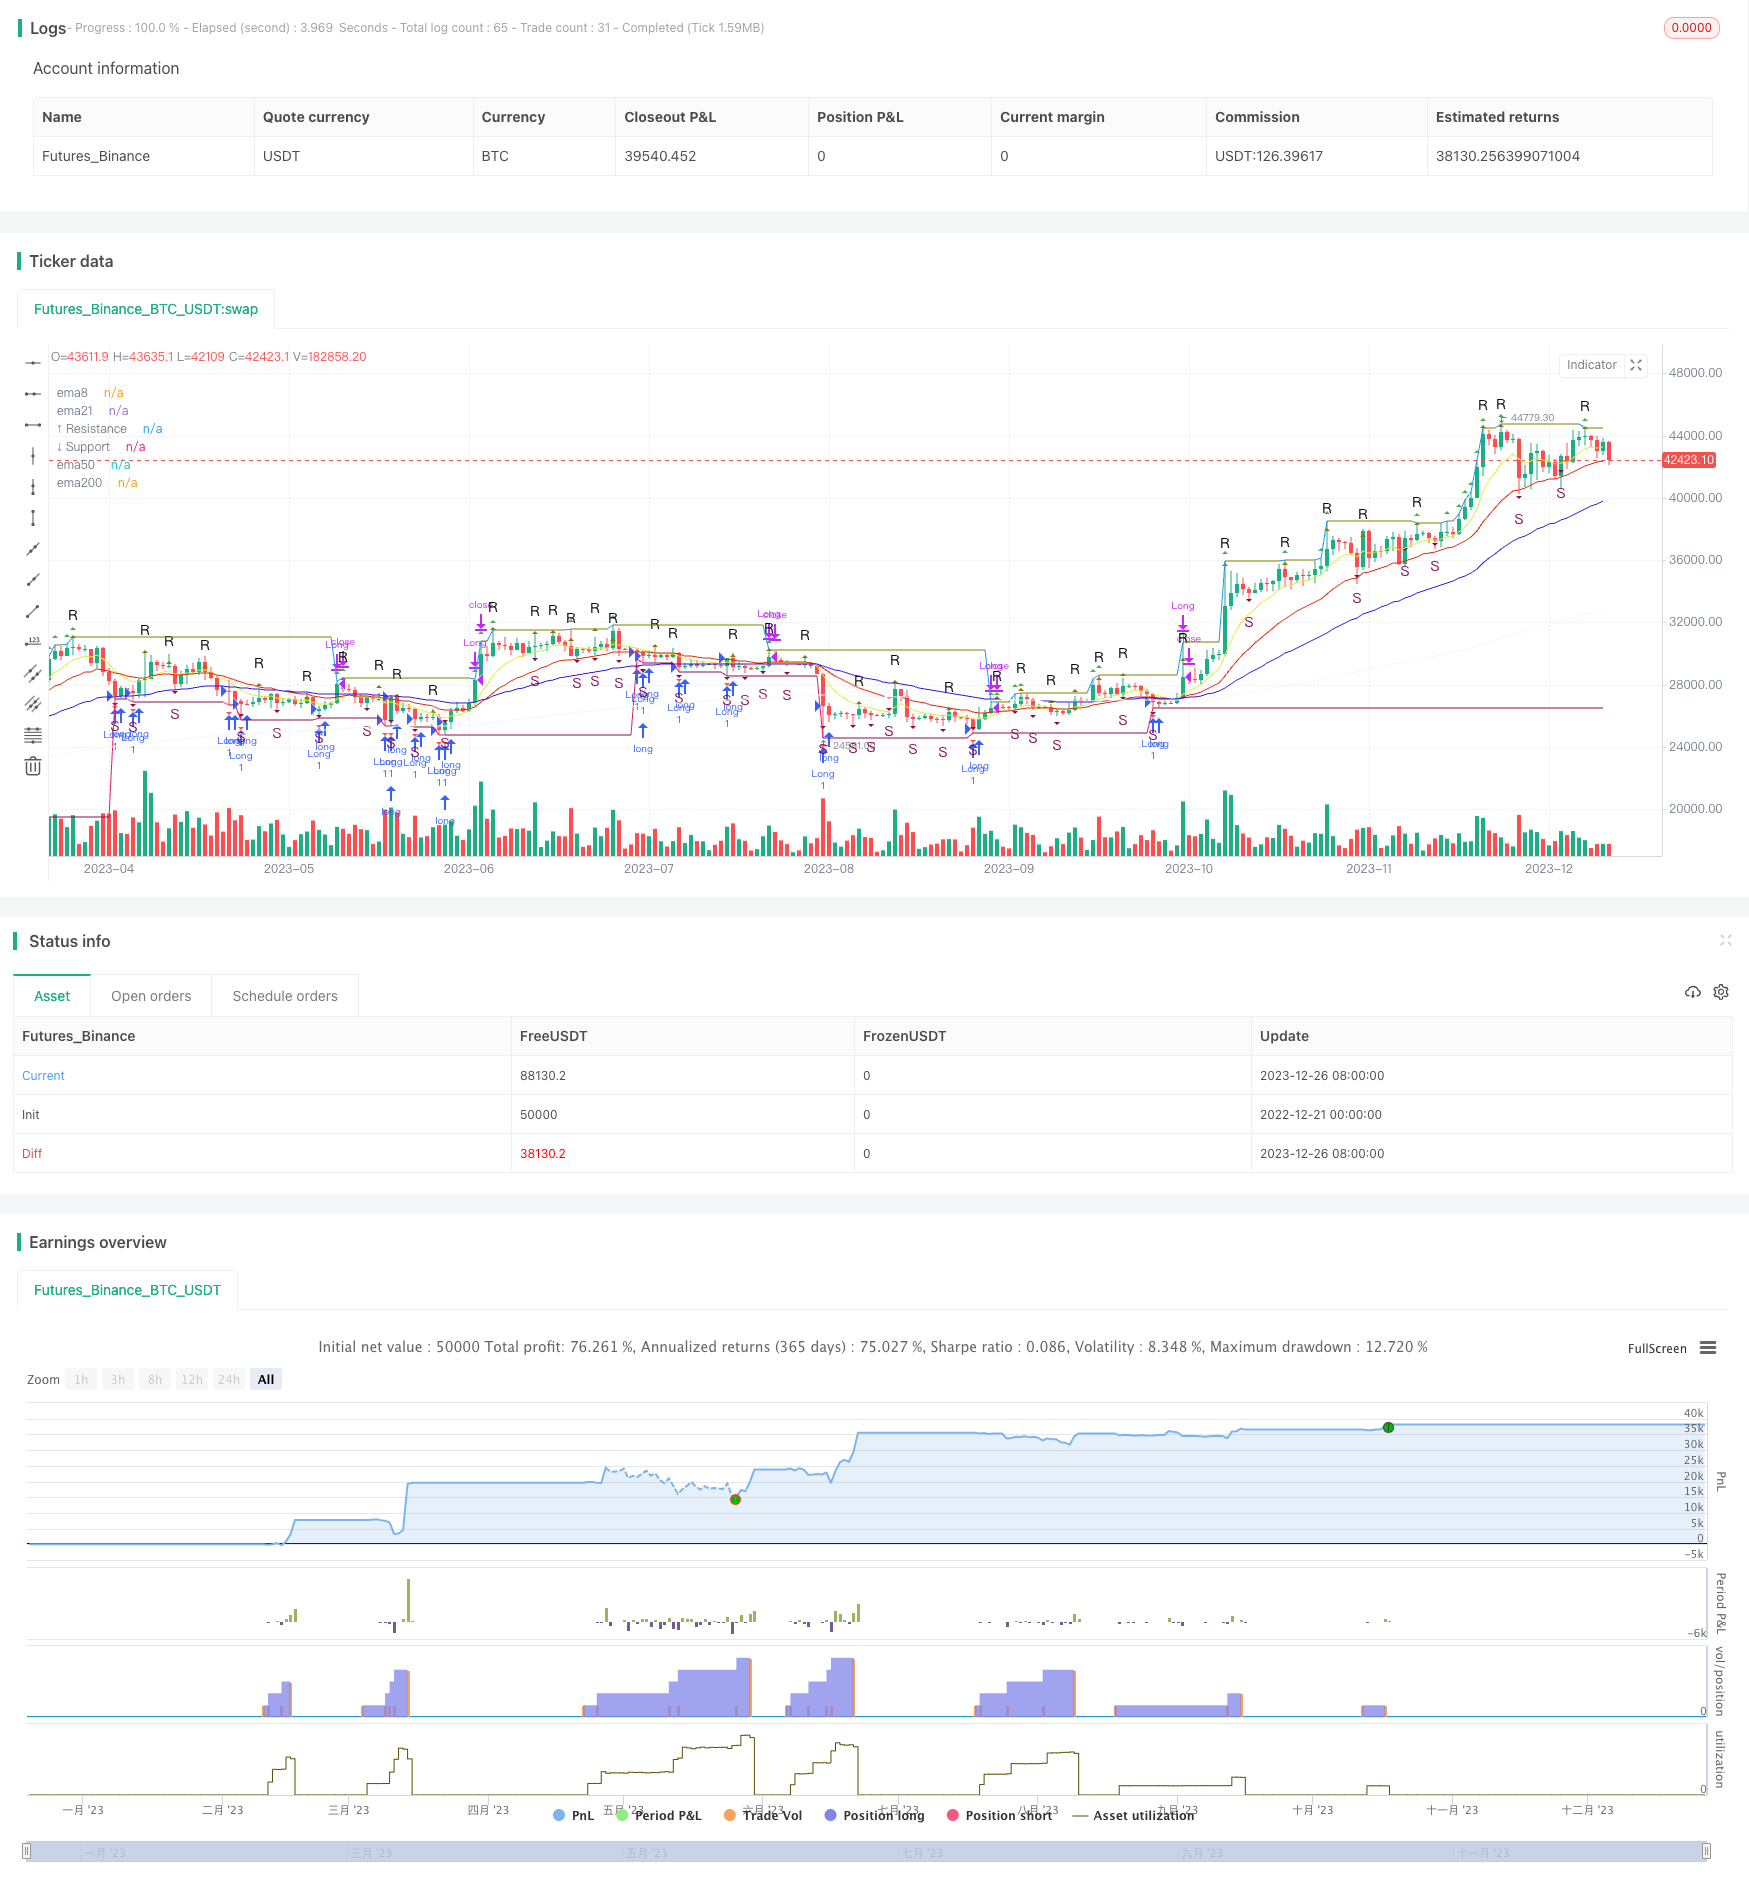
Strategi ini menggunakan indikator garis rata untuk mengidentifikasi arah tren pasar, menggunakan indikator bentuk berdasarkan nilai harga yang sangat tinggi untuk membantu menentukan titik balik, menggabungkan posisi tinggi dan rendah di masa lalu untuk menentukan posisi dukungan dan resistensi yang penting, melakukan operasi terbalik di titik-titik ini, dan merupakan strategi terbalik yang khas.
Prinsip Strategi
Strategi ini didasarkan pada beberapa langkah:
Menggunakan indikator Alligator Trivalen untuk menentukan arah tren. Ketika garis harga menembus Lip Lines dari indikator, dianggap ada sinyal penembusan yang kuat.
Indikator menggunakan model Peak-Trough untuk mengidentifikasi saat harga berbalik di area overbought dan oversold. Penembusan titik ekstrim di satu arah Peak-Trough dianggap sebagai sinyal pembalikan yang mungkin.
Kombinasi dukungan dan resistensi menentukan titik masuk spesifik untuk operasi reversal. Bila harga mendekati dukungan atau resistensi di periode sebelumnya, maka lebih banyak melakukan shorting.
Menggunakan indikator EMA rata-rata untuk membantu menentukan arah tren jangka panjang. Misalnya, dalam situasi yang bergolak, operasi jangka pendek dipengaruhi oleh pembalikan melompat, dan dalam situasi yang sedang tren dipengaruhi oleh gerakan yang baik.
Menggunakan Stop Loss Mobile untuk mengendalikan kerugian tunggal.
Keunggulan Strategis
Strategi ini memiliki beberapa keuntungan:
Selain itu, pengukuran ini juga bisa dilakukan dengan menggunakan berbagai indikator sinyal untuk meningkatkan akurasi penilaian.
Pengembalian menggunakan resistansi dukungan kunci adalah operasi dengan probabilitas tinggi.
Menggunakan Stop Loss Mobile, Anda dapat membatasi kerugian tunggal.
Risiko Strategis
Strategi ini juga memiliki risiko sebagai berikut:
Dalam penilaian portofolio multi-indikator, frekuensi operasi mungkin lebih tinggi dan perlu memperhatikan pengendalian biaya transaksi.
Kegagalan titik kunci adalah risiko terbesar, dan kerugian bisa lebih besar jika harga tidak berbalik di dekat titik dukungan atau resistensi yang diharapkan.
Stop loss yang bergerak dapat ditembus pada saat pasar bergejolak dan menyebabkan kerugian yang lebih besar.
Arah optimasi strategi
Strategi ini dapat dioptimalkan dalam beberapa hal:
Untuk melakukan penyesuaian optimum terhadap bobot multi-indikator untuk menemukan kombinasi parameter yang optimal.
Meningkatkan algoritma pembelajaran mesin untuk membantu menilai tingkat keberhasilan dari titik-titik penting.
Menambahkan indikator volume transaksi untuk menghindari volatilitas harga yang drastis tetapi volume transaksi yang tidak cukup.
Mengoptimalkan model stop loss mobile, dengan memastikan efektivitas stop loss, dan meminimalkan probabilitas stop loss yang tidak perlu.
Meringkaskan
Singkatnya, strategi rebound capture rasio rasio ini adalah strategi teknis yang khas. Ini memiliki keunggulan akurasi penilaian yang tinggi, operasi probabilitas yang tinggi, tetapi juga perlu memperhatikan risiko kegagalan posisi kunci dan penembusan stop loss yang terobosan.
/*backtest
start: 2022-12-21 00:00:00
end: 2023-12-27 00:00:00
period: 1d
basePeriod: 1h
exchanges: [{"eid":"Futures_Binance","currency":"BTC_USDT"}]
*/

// This source code is subject to the terms of the Mozilla Public License 2.0 at https://mozilla.org/MPL/2.0/
// © vhurtadocos


//@version=5
strategy('Estrategia EMA Resistencia Soporte', shorttitle='Estrategia EMA RESISTENCIA Y SOPORTE', overlay=true, margin_long=100, margin_short=100, pyramiding = 10 )

//INICIO DE CONDICIONES BASICAS
/// Alligator
smma(src, length) =>
    smma = 0.0
    sma_1 = ta.sma(src, length)
    smma := na(smma[1]) ? sma_1 : (smma[1] * (length - 1) + src) / length
    smma
lipsLength = input(title='🐲 Lips Length', defval=5)
teethLength = input(title='🐲 Teeth Length', defval=8)
jawLength = input(title='🐲 Jaw Length', defval=13)
lipsOffset = input(title='🐲 Lips Offset', defval=3)
teethOffset = input(title='🐲 Teeth Offset', defval=5)
jawOffset = input(title='🐲 Jaw Offset', defval=8)
lips = smma(hl2, lipsLength)
teeth = smma(hl2, teethLength)
jaw = smma(hl2, jawLength)


// Fractals
n = input.int(title='📌 Period', defval=2, minval=2)
upFractal = high[n + 2] < high[n] and high[n + 1] < high[n] and high[n - 1] < high[n] and high[n - 2] < high[n] or high[n + 3] < high[n] and high[n + 2] < high[n] and high[n + 1] == high[n] and high[n - 1] < high[n] and high[n - 2] < high[n] or high[n + 4] < high[n] and high[n + 3] < high[n] and high[n + 2] == high[n] and high[n + 1] <= high[n] and high[n - 1] < high[n] and high[n - 2] < high[n] or high[n + 5] < high[n] and high[n + 4] < high[n] and high[n + 3] == high[n] and high[n + 2] == high[n] and high[n + 1] <= high[n] and high[n - 1] < high[n] and high[n - 2] < high[n] or high[n + 6] < high[n] and high[n + 5] < high[n] and high[n + 4] == high[n] and high[n + 3] <= high[n] and high[n + 2] == high[n] and high[n + 1] <= high[n] and high[n - 1] < high[n] and high[n - 2] < high[n]
dnFractal = low[n + 2] > low[n] and low[n + 1] > low[n] and low[n - 1] > low[n] and low[n - 2] > low[n] or low[n + 3] > low[n] and low[n + 2] > low[n] and low[n + 1] == low[n] and low[n - 1] > low[n] and low[n - 2] > low[n] or low[n + 4] > low[n] and low[n + 3] > low[n] and low[n + 2] == low[n] and low[n + 1] >= low[n] and low[n - 1] > low[n] and low[n - 2] > low[n] or low[n + 5] > low[n] and low[n + 4] > low[n] and low[n + 3] == low[n] and low[n + 2] == low[n] and low[n + 1] >= low[n] and low[n - 1] > low[n] and low[n - 2] > low[n] or low[n + 6] > low[n] and low[n + 5] > low[n] and low[n + 4] == low[n] and low[n + 3] >= low[n] and low[n + 2] == low[n] and low[n + 1] >= low[n] and low[n - 1] > low[n] and low[n - 2] > low[n]
plotshape(title='📌 Up-Fractal', series=upFractal, style=shape.triangleup, location=location.abovebar, offset=-2, color=color.new(color.olive, 0), text="R")
plotshape(title='📌 Down-Fractal', series=dnFractal, style=shape.triangledown, location=location.belowbar, offset=-2, color=color.new(color.maroon, 0), text="S", textcolor = color.new(color.maroon,0))

// Resistance, Support
showRS = input(title='⤒⤓ Show Res-Sup', defval=true)
lengthRS = input(title='⤒⤓ Res-Sup Length', defval=13)
highRS = ta.valuewhen(high >= ta.highest(high, lengthRS), high, 0)
lowRS = ta.valuewhen(low <= ta.lowest(low, lengthRS), low, 0)
plot(title='⤒ Resistance', series=showRS and highRS ? highRS : na, color=highRS != highRS[1] ? na : color.olive, linewidth=1, offset=0)
plot(title='⤓ Support', series=showRS and lowRS ? lowRS : na, color=lowRS != lowRS[1] ? na : color.maroon, linewidth=1, offset=0)


// EMA de 8 períodos
ema8 = ta.ema(close, 8)
plot(title='ema8', series=ema8, color=color.new(#dbef41, 0), offset=0)

// EMA de 21 períodos
ema21 = ta.ema(close, 21)
plot(title='ema21', series=ema21, color=color.new(#e12c0c, 0), offset=0)

// EMA de 50 períodos
ema50 = ta.ema(close, 50)
plot(title='ema50', series=ema50, color=color.new(#3419de, 0), offset=0)

// EMA de 200 períodos
ema200 = ta.ema(close, 200)
plot(title='ema200', series=ema200, color=color.new(#f6f6f4, 0), offset=0)


// Definiciones originales...
// ... (incluyendo tus definiciones de Alligator, Fractals, etc.)

// Guardamos el último soporte y resistencia
var float lastSupport = na
var float lastResistance = na

// Detectando un nuevo soporte y resistencia
newSupportDetected = low == lowRS


if newSupportDetected
    lastSupport := low

// Lógica de entrada y salida

// Condiciones de entrada basadas en soportes recién formados
longCondition = low == lowRS
if longCondition
    strategy.entry("Long", strategy.long)

// Salida (take profit) cuando detectamos una nueva resistencia después de entrar en una posición long
newResistanceDetected = high == highRS
if newResistanceDetected and strategy.position_size > 0
    strategy.close("Long")

// Agregar una condición para el stop loss
longStopLossPrice = close * 0.95
if strategy.position_size > 0 and close <= longStopLossPrice
    strategy.close("Long")

// Pintamos los soportes y resistencias
plotshape(longCondition, style=shape.triangledown, location=location.belowbar, color=color.red)
plotshape(newResistanceDetected, style=shape.triangleup, location=location.abovebar, color=color.green)

// Resto del código para plotear las EMAs y fractales
// ...