Menggabungkan strategi perdagangan kuantitatif tren dan volatilitas
Ringkasan
Sebuah strategi perdagangan kuantitatif yang menggabungkan tren dan getaran. Ini menggunakan kombinasi dari dua indikator untuk mengidentifikasi arah dan kekuatan tren, dan mencari waktu masuk yang lebih baik ketika tren bergoyang.
Prinsip Strategi
Strategi ini terutama menggunakan dua indikator publik: Trend Surfers dan Mawreez’s Trend Oscillator.
Trend Surfers adalah indikator stop loss yang melacak tren. Dengan menghitung harga tertinggi dan terendah dalam periode tertentu, ia menilai pergerakan harga dan memberikan posisi stop loss yang disarankan. Misalnya, ketika harga menembus harga tertinggi dari garis 168 K terbaru, itu adalah sinyal bullish; ketika harga jatuh dari harga terendah dari garis 168 K terbaru, itu adalah sinyal bullish.
Mawreez’s Trend Oscillator adalah indikator oscillasi dua garis. Ini mirip dengan MACD, yang menilai arah dan kekuatan tren melalui perbedaan nilai DI.
Aturan trading untuk strategi ini adalah:
Masuk dengan banyak kepala: Trend Surfers menembus garis tertinggi dan indikator Mawirez’s Trend Oscillator membeli saat bullish Investasi kosong: Trend Surfers terjual saat turun di bawah garis bawah dan indikator Mawreez’s Trend Oscillator turun
Stop loss adalah stop loss yang mengikuti tren ditambah stop loss tetap.
Analisis Keunggulan
Strategi ini menggabungkan indikator tren dan getaran, yang dapat menangkap tren dan mencari harga yang lebih baik untuk masuk dalam getaran, dengan keuntungan sebagai berikut:
- Filter ganda indikator yang efektif untuk mencegah penembusan palsu
- Kombinasi tren dan getaran, mudah untuk menangkap harga di dalam zona getaran dengan penargetan rendah atau penargetan ringan tinggi
- Menggunakan Multiple Stop Loss, Mengendalikan Risiko dengan Baik
Analisis risiko
Strategi ini juga memiliki beberapa risiko:
- Komposisi indeks ganda, mudah dilewatkan
- Indikator tren dan indikator getaran mungkin memberi sinyal konflik
- Stop loss tetap bisa berakhir prematur
Untuk menghindari risiko ini, langkah-langkah berikut dapat diambil:
- Parameter indikator relaksasi yang tepat untuk mengurangi fluktuasi
- Menambahkan aturan penilaian tren untuk menghindari konflik indikator
- Dinamiskan posisi stop loss
Arah optimasi
Strategi ini masih bisa dioptimalkan lebih jauh:
- Uji kombinasi parameter yang berbeda dan parameter periodik untuk mencari parameter yang optimal
- Peningkatan volatilitas, volume transaksi, dan lain-lain.
- Indikator dan parameter optimasi dinamis dengan teknologi pembelajaran mesin
Meringkaskan
Keuntungan dari penggunaan komprehensif dari trend tracking dan indikator getaran dalam strategi getaran dua arah, baik untuk mengidentifikasi arah tren, tetapi juga untuk memanfaatkan peluang getaran, dengan parameter dan optimasi aturan, dapat meningkatkan profitabilitas strategi lebih lanjut. Strategi ini memiliki prospek pengembangan yang baik.
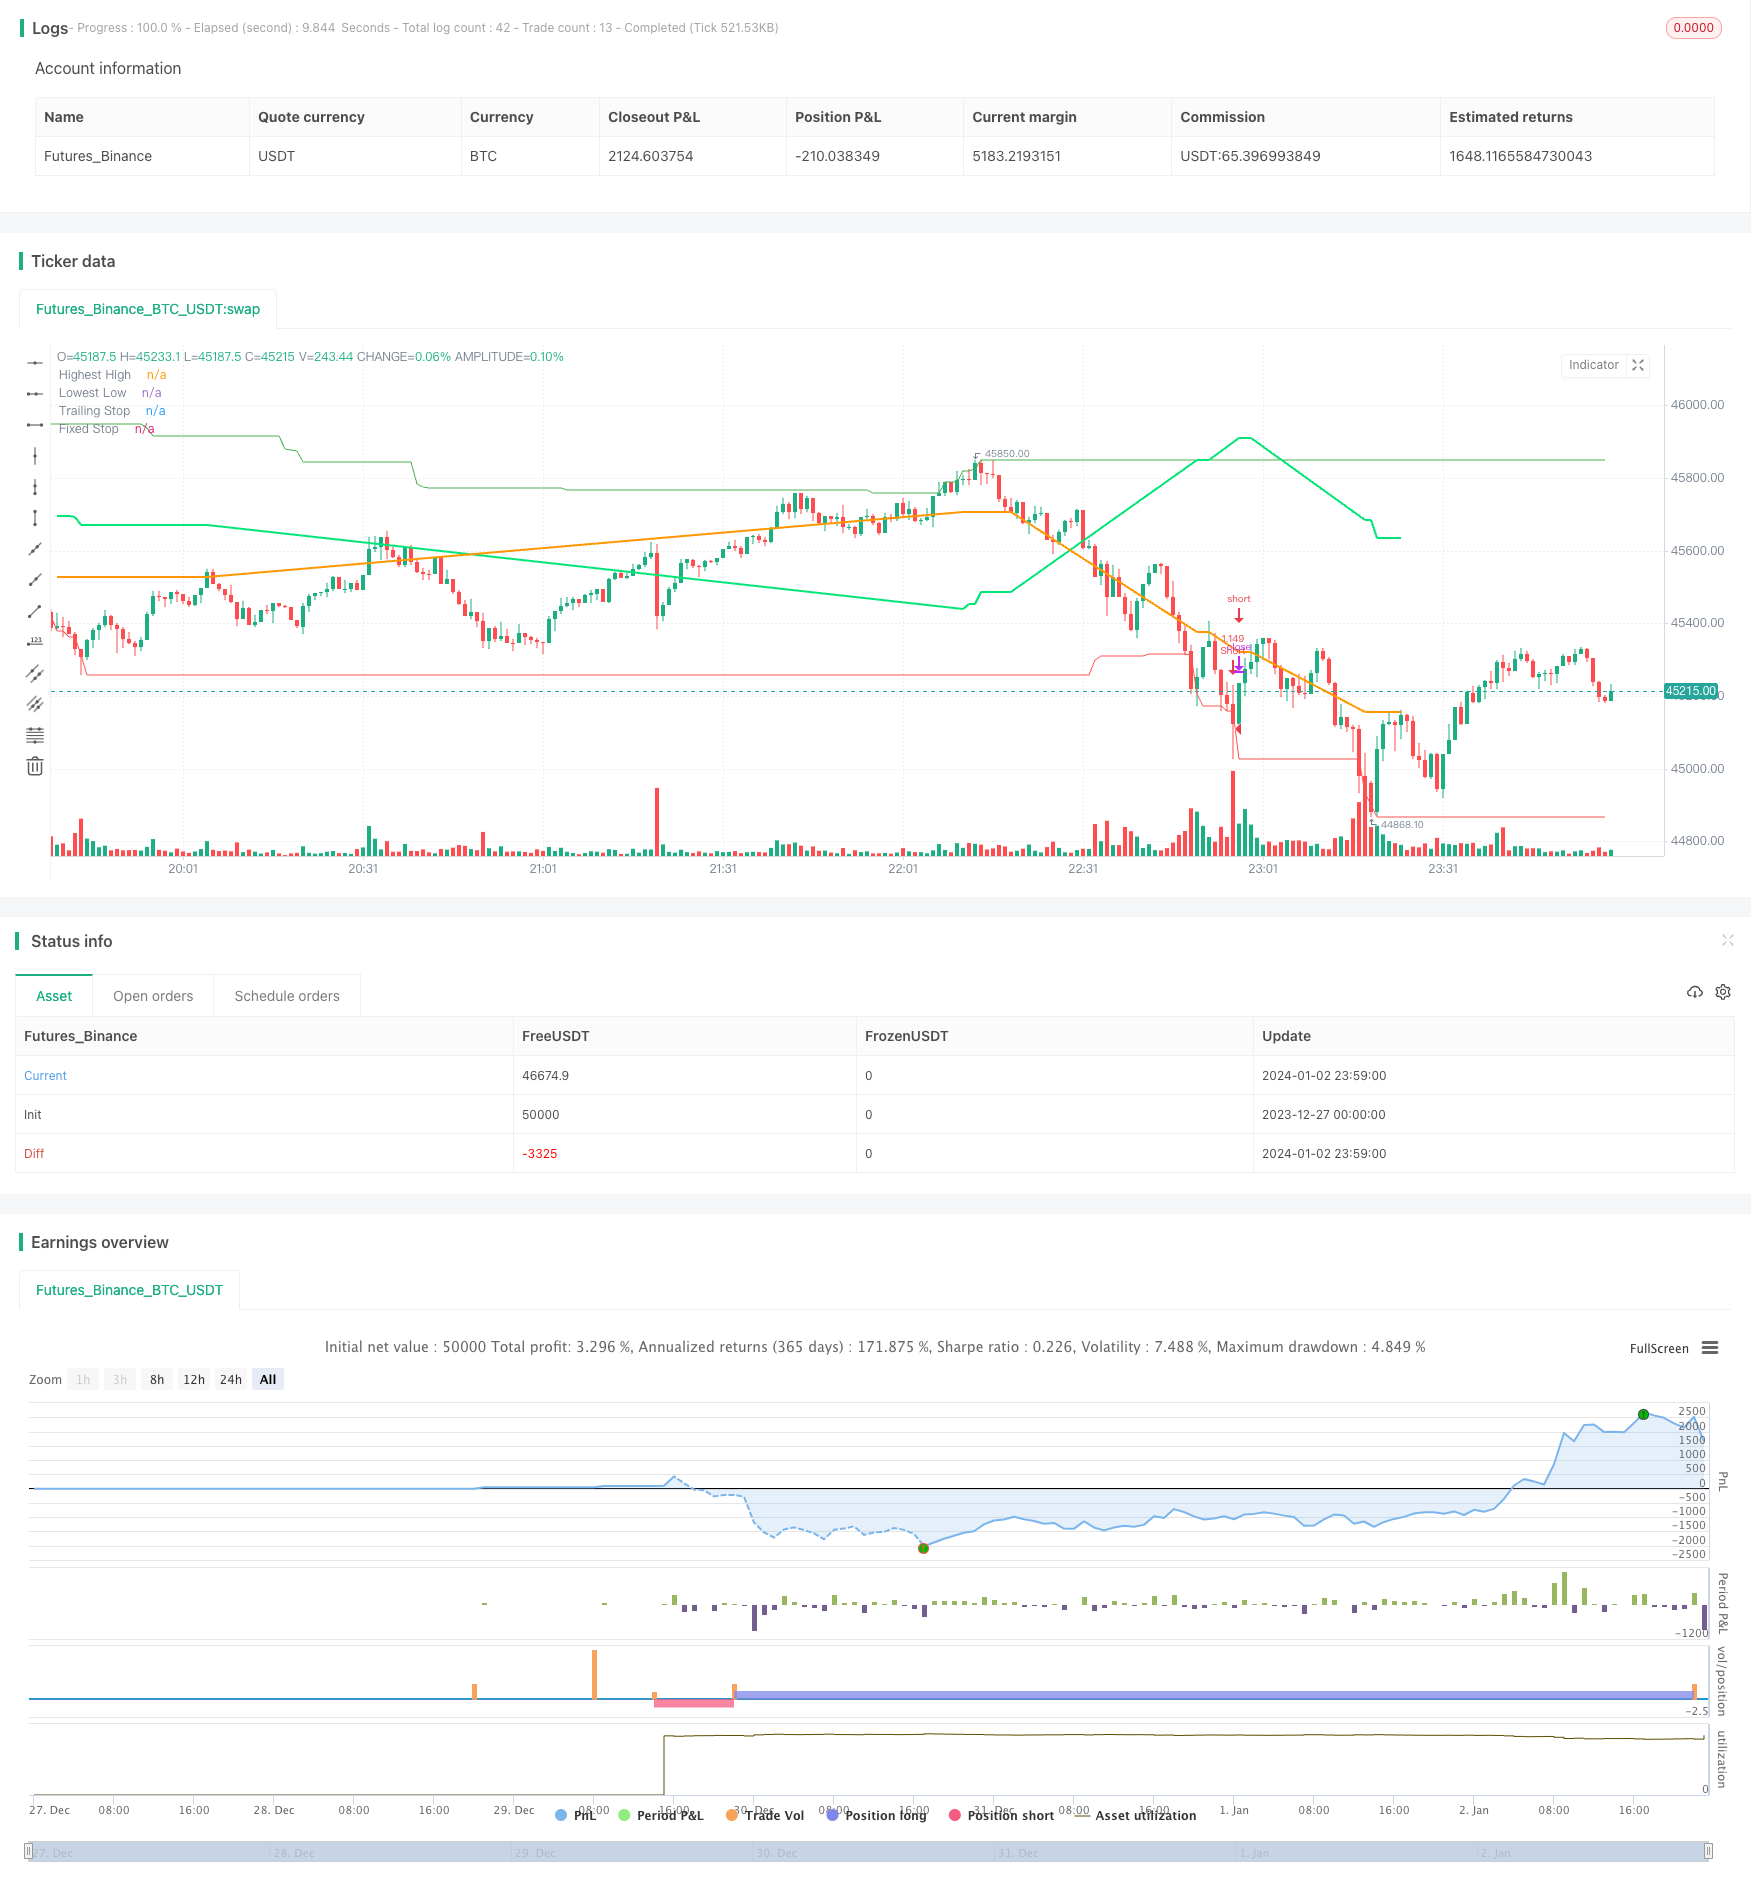
/*backtest
start: 2023-12-27 00:00:00
end: 2024-01-03 00:00:00
period: 1m
basePeriod: 1m
exchanges: [{"eid":"Futures_Binance","currency":"BTC_USDT"}]
*/

// This source code is subject to the terms of the Mozilla Public License 2.0 at https://mozilla.org/MPL/2.0/
// © myn

//@version=5
strategy('Strategy Myth-Busting #8 - TrendSurfers+TrendOsc - [MYN]', max_bars_back=5000, overlay=true, pyramiding=0, initial_capital=20000, currency='USD', default_qty_type=strategy.percent_of_equity, default_qty_value=100.0, commission_value=0.075, use_bar_magnifier = false)

/////////////////////////////////////
//* Put your strategy logic below *//
/////////////////////////////////////
//cAe9It4ynO4


// Strategies
// Trend Surfers - Premium Indicator
// Mawreez' Trend Oscillator Indicator

// Trading Setup / Rules


// Long Condition
// Trend Surfers Trailing stop line goes below (Crosses) lowest low
// Bullish Candle (red)
// Mawreeze Trend Oscilator Indicator is green


// Short Condition

// Trend Surfers Trailing stop line goes above (Crosses) highest high
// Bearish Candle (red)
// Mawreeze Trend Oscilator Indicator is red

// Stop loss middle between high and low Risk 1:2


//@version=5
//strategy(shorttitle='Trend Surfers - Breakout', title='Trend Surfers - Premium Breakout', overlay=true, calc_on_every_tick=false, initial_capital=100000, default_qty_type=strategy.percent_of_equity, default_qty_value=100, commission_type='percent', commission_value=0.04)

// Risk for position and pyramid
maxriskval = input.float(2, 'Max % risk', tooltip='Risk % over total equity / Position', group='Risk Management')
pairnumber = input.int(title='How many pairs', defval=1, tooltip='How many pairs are you trading with the strategy?', group='Risk Management')

// Emtry Exit
highPeriod = input.int(title='Highest High Period', defval=168, tooltip='Highest High of X bars - This will trigger a Long Entry when close is above. (Thin Green Line)', group='Entry Condition')
lowPeriod = input.int(title='Lowest Low Period', defval=168, tooltip='Lowest low of X bars - This will trigger a Short Entry when close is under. (Thin Red Line)', group='Entry Condition')
// Stoploss
trailingAtrPeriod = input.int(title='Trailing ATR Pediod', defval=10, tooltip='Average True Range for the Trailing Stop. (Thick Green Line) ', group='Exit Condition')
trailingAtrMultiplier = input.float(title='Trailing ATR Multiplier', defval=8, group='Exit Condition')
fixAtrPeriod = input.int(title='Fix ATR Pediod', defval=10, tooltip='Average True Range for the Fix Stoloss. (Thick Yellow Line)', group='Exit Condition')
fixAtrMultiplier = input.float(title='Fix ATR Multiplier', defval=2, group='Exit Condition')
// Pair info
pair = syminfo.basecurrency + syminfo.currency

// High Low Variable
highestHigh = ta.highest(high, highPeriod)[1]
lowestLow = ta.lowest(low, lowPeriod)[1]
trailingAtr = ta.atr(trailingAtrPeriod) * trailingAtrMultiplier

// Trade Condition
longConditionTrendSurfers = ta.crossover(close, highestHigh)
shortConditionTrendSurfers = ta.crossunder(close, lowestLow)

// Risk Variable
fixAtr = ta.atr(fixAtrPeriod) * fixAtrMultiplier
stopvaluelong = close[1] - fixAtr[1]
stopvalueshort = close[1] + fixAtr[1]

// Position size Long
maxpossize = strategy.equity / close
positionsizelong = maxriskval / 100 * strategy.equity / (close - stopvaluelong)
stopperclong = (close - stopvaluelong) / close * 100
leveragelong = math.max(1, math.ceil(positionsizelong / maxpossize)) * 2
posperclong = positionsizelong * close / strategy.equity * 100 / leveragelong / pairnumber
realposlong = posperclong / 100 * strategy.equity * leveragelong / close

// Position size Short
positionsizeshort = maxriskval / 100 * strategy.equity / (stopvalueshort - close)
stoppercshort = (close - stopvalueshort) / close * 100
leverageshort = math.max(1, math.ceil(positionsizeshort / maxpossize)) * 2
pospercshort = positionsizeshort * close / strategy.equity * 100 / leverageshort / pairnumber
realposshort = pospercshort / 100 * strategy.equity * leverageshort / close

// Alert Message
entry_long_message = '\nGo Long for ' + pair + 'NOW!' + '\nPosition Size % =' + str.tostring(posperclong) + '\nLeverage' + str.tostring(leveragelong) + '\nStoploss Price =' + str.tostring(stopvaluelong) + '\nClose any Short position that are open for ' + pair + '!' + '\n\nVisit TrendSurfersSignals.com' + '\nFor automated premium signals (FREE)'

entry_short_message = '\nGo Short for ' + pair + 'NOW!' + '\nPosition Size % =' + str.tostring(pospercshort) + '\nLeverage' + str.tostring(leverageshort) + '\nStoploss Price =' + str.tostring(stopvalueshort) + '\nClose any Long position that are open for ' + pair + '!' + '\n\nVisit TrendSurfersSignals.com' + '\nFor automated premium signals (FREE)'

exit_short_message = '\nExit Short for ' + pair + 'NOW!' + '\n\nVisit TrendSurfersSignals.com' + '\nFor automated premium signals (FREE)'

exit_long_message = '\nExit Long for ' + pair + 'NOW!' + '\n\nVisit TrendSurfersSignals.com' + '\nFor automated premium signals (FREE)'
// Order
// if longCondition
//     strategy.entry('Long', strategy.long, stop=highestHigh, comment='Long', qty=realposlong, alert_message=entry_long_message)
// if shortCondition
//     strategy.entry('Short', strategy.short, stop=lowestLow, comment='Short', qty=realposshort, alert_message=entry_short_message)

// Stoploss Trailing
longTrailing = close - trailingAtr
shortTrailing = close + trailingAtr

var longTrailingStop = 0.0
var shortTrailingStop = 999999.9

trailingStopLine = 0.0
trailingStopLine := na
fixedStopLine = 0.0
fixedStopLine := na
var inTrade = 0
if longConditionTrendSurfers or shortConditionTrendSurfers
    if 0 == inTrade
        if longConditionTrendSurfers
            inTrade := 1
            inTrade
        else
            inTrade := -1
            inTrade
if 1 == inTrade and (shortConditionTrendSurfers or low <= math.max(fixedStopLine[1], longTrailingStop))
    inTrade := 0
    inTrade
if -1 == inTrade and (longConditionTrendSurfers or high >= math.min(fixedStopLine[1], shortTrailingStop))
    inTrade := 0
    inTrade

longTrailingStop := if 1 == inTrade
    stopValue = longTrailing
    math.max(stopValue, longTrailingStop[1])
else
    0

shortTrailingStop := if -1 == inTrade
    stopValue = shortTrailing
    math.min(stopValue, shortTrailingStop[1])
else
    999999

// Fix Stoploss
firstPrice = 0.0
firstFixAtr = 0.0
firstPrice := na
firstFixAtr := na
if 0 != inTrade
    firstPrice := ta.valuewhen(inTrade != inTrade[1] and 0 != inTrade, close, 0)
    firstFixAtr := ta.valuewhen(inTrade != inTrade[1] and 0 != inTrade, fixAtr, 0)
    if 1 == inTrade
        fixedStopLine := firstPrice - firstFixAtr
        trailingStopLine := longTrailingStop
        trailingStopLine
    else
        fixedStopLine := firstPrice + firstFixAtr
        trailingStopLine := shortTrailingStop
        trailingStopLine

// if strategy.position_size > 0
//     strategy.exit(id='L Stop', stop=math.max(fixedStopLine, longTrailingStop), alert_message=exit_long_message)

// if strategy.position_size < 0
//     strategy.exit(id='S Stop', stop=math.min(fixedStopLine, shortTrailingStop), alert_message=exit_short_message)


// Plot
plot(highestHigh, color=color.new(color.green, 0), linewidth=1, title='Highest High')
plot(lowestLow, color=color.new(color.red, 0), linewidth=1, title='Lowest Low')
plot(trailingStopLine, color=color.new(color.lime, 0), linewidth=2, offset=1, title='Trailing Stop')
plot(fixedStopLine, color=color.new(color.orange, 0), linewidth=2, offset=1, title='Fixed Stop')

// Trend Surfers Trailing stop line goes above (Crossesover) highest high
// Bearish Candle (red)
// Mawreeze Trend Oscilator Indicator is red

trendSurfersShortEntry = trailingStopLine > highestHigh and close < close[1]
trendSurfersLongEntry = trailingStopLine < lowestLow and close > close[1]


//@version=5

// Taken from the TradingView house rules regarding scripts:

// "All open source scripts that do not mention a specific open source license
// in their comments are licensed under the Mozilla Public License 2.0.
// Following the Mozilla License, any script reusing open source code originally
// published by someone else must also be open source, unless specific
// permission is granted by the original author."

//indicator('Mawreez\' Trend Oscillator', precision=3)

len = input.int(title='DI Length', minval=1, defval=14)
sens = input.float(title='Sensitivity', defval=25)

// Lag-free smoothing of a given series
smooth(series, len) =>
    f28 = ta.ema(series, len)
    f30 = ta.ema(f28, len)
    vC = f28 * 1.5 - f30 * 0.5
    f38 = ta.ema(vC, len)
    f40 = ta.ema(f38, len)
    v10 = f38 * 1.5 - f40 * 0.5
    f48 = ta.ema(v10, len)
    f50 = ta.ema(f48, len)
    f48 * 1.5 - f50 * 0.5

// Constructing the +DI and -DI
up = ta.change(high)
down = -ta.change(low)
plus_dm = up > 0 and up > down ? up : 0
minus_dm = down > 0 and down > up ? down : 0
range_1 = ta.rma(ta.tr, len)
plus_di = smooth(ta.rma(plus_dm, len) / range_1, 3)
minus_di = smooth(ta.rma(minus_dm, len) / range_1, 3)

// Constructing and plotting the modified ADX
adj_adx = 100 * math.abs(plus_di - minus_di) / (plus_di + minus_di) - sens
adj_adx := (minus_di > plus_di ? -1 : 1) * (adj_adx < 0 ? 0 : adj_adx)
//plot(smooth(adj_adx, 3), color=plus_di > minus_di ? color.green : color.red, style=plot.style_columns)

trendOscShortEntry = plus_di < minus_di
trendOscLongEntry = plus_di > minus_di


//////////////////////////////////////
//* Put your strategy rules below *//
/////////////////////////////////////

longCondition = trendSurfersLongEntry and trendOscLongEntry
shortCondition = trendSurfersShortEntry and trendOscShortEntry

//define as 0 if do not want to use
closeLongCondition = 0
closeShortCondition = 0


// ADX
//░░░░░░░░░░░░░░░░░░░░░░░░░░░░░░░░░░░░░░░░░░░░░░░░░░░░░░░░░░░░░░░░░░░░░░░░░░░░░░░░░░░░░░░░░░░░░░░░░░░░░░░░░░░░░░░░░░░░░░░░░░░░░░░░░░░░░░░░░░░░░░░░░░

adxEnabled = input.bool(defval = false , title = "Average Directional Index (ADX)", tooltip = "", group ="ADX" )
adxlen = input(14, title="ADX Smoothing", group="ADX")
adxdilen = input(14, title="DI Length", group="ADX")
adxabove = input(25, title="ADX Threshold", group="ADX")

adxdirmov(len) =>
	adxup = ta.change(high)
	adxdown = -ta.change(low)
	adxplusDM = na(adxup) ? na : (adxup > adxdown and adxup > 0 ? adxup : 0)
	adxminusDM = na(adxdown) ? na : (adxdown > adxup and adxdown > 0 ? adxdown : 0)
	adxtruerange = ta.rma(ta.tr, len)
	adxplus = fixnan(100 * ta.rma(adxplusDM, len) / adxtruerange)
	adxminus = fixnan(100 * ta.rma(adxminusDM, len) / adxtruerange)
	[adxplus, adxminus]
adx(adxdilen, adxlen) =>
	[adxplus, adxminus] = adxdirmov(adxdilen)
	adxsum = adxplus + adxminus
	adx = 100 * ta.rma(math.abs(adxplus - adxminus) / (adxsum == 0 ? 1 : adxsum), adxlen)

adxsig = adxEnabled ? adx(adxdilen, adxlen) : na
isADXEnabledAndAboveThreshold = adxEnabled ? (adxsig > adxabove) : true

//Backtesting Time Period (Input.time not working as expected as of 03/30/2021.  Giving odd start/end dates
//░░░░░░░░░░░░░░░░░░░░░░░░░░░░░░░░░░░░░░░░░░░░░░░░░░░░░░░░░░░░░░░░░░░░░░░░░░░░░░░░░░░░░░░░░░░░░░░░░░░░░░░░░░░░░░░░░░░░░░░░░░░░░░░░░░░░░░░░░░░░░░░░░░
useStartPeriodTime = input.bool(true, 'Start', group='Date Range', inline='Start Period')
startPeriodTime = input(timestamp('1 Jan 2019'), '', group='Date Range', inline='Start Period')
useEndPeriodTime = input.bool(true, 'End', group='Date Range', inline='End Period')
endPeriodTime = input(timestamp('31 Dec 2030'), '', group='Date Range', inline='End Period')

start = useStartPeriodTime ? startPeriodTime >= time : false
end = useEndPeriodTime ? endPeriodTime <= time : false
calcPeriod = true

// Trade Direction
// ░░░░░░░░░░░░░░░░░░░░░░░░░░░░░░░░░░░░░░░░░░░░░░░░░░░░░░░░░░░░░░░░░░░░░░░░░░░░░░░░░░░░░░░░░░░░░░░░░░░░░░░░░░░░░░░░░░░░░░░░░░░░░░░░░░░░░░░░░░░░░░░░░░
tradeDirection = input.string('Long and Short', title='Trade Direction', options=['Long and Short', 'Long Only', 'Short Only'], group='Trade Direction')

// Percent as Points
// ░░░░░░░░░░░░░░░░░░░░░░░░░░░░░░░░░░░░░░░░░░░░░░░░░░░░░░░░░░░░░░░░░░░░░░░░░░░░░░░░░░░░░░░░░░░░░░░░░░░░░░░░░░░░░░░░░░░░░░░░░░░░░░░░░░░░░░░░░░░░░░░░░░
per(pcnt) =>
    strategy.position_size != 0 ? math.round(pcnt / 100 * strategy.position_avg_price / syminfo.mintick) : float(na)

// Take profit 1
// ░░░░░░░░░░░░░░░░░░░░░░░░░░░░░░░░░░░░░░░░░░░░░░░░░░░░░░░░░░░░░░░░░░░░░░░░░░░░░░░░░░░░░░░░░░░░░░░░░░░░░░░░░░░░░░░░░░░░░░░░░░░░░░░░░░░░░░░░░░░░░░░░░░
tp1 = input.float(title='Take Profit 1 - Target %', defval=100, minval=0.0, step=0.5, group='Take Profit', inline='Take Profit 1')
q1 = input.int(title='% Of Position', defval=100, minval=0, group='Take Profit', inline='Take Profit 1')

// Take profit 2
// ░░░░░░░░░░░░░░░░░░░░░░░░░░░░░░░░░░░░░░░░░░░░░░░░░░░░░░░░░░░░░░░░░░░░░░░░░░░░░░░░░░░░░░░░░░░░░░░░░░░░░░░░░░░░░░░░░░░░░░░░░░░░░░░░░░░░░░░░░░░░░░░░░░
tp2 = input.float(title='Take Profit 2 - Target %', defval=100, minval=0.0, step=0.5, group='Take Profit', inline='Take Profit 2')
q2 = input.int(title='% Of Position', defval=100, minval=0, group='Take Profit', inline='Take Profit 2')

// Take profit 3
// ░░░░░░░░░░░░░░░░░░░░░░░░░░░░░░░░░░░░░░░░░░░░░░░░░░░░░░░░░░░░░░░░░░░░░░░░░░░░░░░░░░░░░░░░░░░░░░░░░░░░░░░░░░░░░░░░░░░░░░░░░░░░░░░░░░░░░░░░░░░░░░░░░░
tp3 = input.float(title='Take Profit 3 - Target %', defval=100, minval=0.0, step=0.5, group='Take Profit', inline='Take Profit 3')
q3 = input.int(title='% Of Position', defval=100, minval=0, group='Take Profit', inline='Take Profit 3')

// Take profit 4
// ░░░░░░░░░░░░░░░░░░░░░░░░░░░░░░░░░░░░░░░░░░░░░░░░░░░░░░░░░░░░░░░░░░░░░░░░░░░░░░░░░░░░░░░░░░░░░░░░░░░░░░░░░░░░░░░░░░░░░░░░░░░░░░░░░░░░░░░░░░░░░░░░░░
tp4 = input.float(title='Take Profit 4 - Target %', defval=100, minval=0.0, step=0.5, group='Take Profit')

/// Stop Loss
// ░░░░░░░░░░░░░░░░░░░░░░░░░░░░░░░░░░░░░░░░░░░░░░░░░░░░░░░░░░░░░░░░░░░░░░░░░░░░░░░░░░░░░░░░░░░░░░░░░░░░░░░░░░░░░░░░░░░░░░░░░░░░░░░░░░░░░░░░░░░░░░░░░░
stoplossPercent = input.float(title='Stop Loss (%)', defval=999, minval=0.01, group='Stop Loss') * 0.01
slLongClose = close < strategy.position_avg_price * (1 - stoplossPercent)
slShortClose = close > strategy.position_avg_price * (1 + stoplossPercent)

/// Leverage
// ░░░░░░░░░░░░░░░░░░░░░░░░░░░░░░░░░░░░░░░░░░░░░░░░░░░░░░░░░░░░░░░░░░░░░░░░░░░░░░░░░░░░░░░░░░░░░░░░░░░░░░░░░░░░░░░░░░░░░░░░░░░░░░░░░░░░░░░░░░░░░░░░░░
leverage = input.float(1, 'Leverage', step=.5, group='Leverage')
contracts = math.min(math.max(.000001, strategy.equity / close * leverage), 1000000000)


/// Trade State Management
// ░░░░░░░░░░░░░░░░░░░░░░░░░░░░░░░░░░░░░░░░░░░░░░░░░░░░░░░░░░░░░░░░░░░░░░░░░░░░░░░░░░░░░░░░░░░░░░░░░░░░░░░░░░░░░░░░░░░░░░░░░░░░░░░░░░░░░░░░░░░░░░░░░░

isInLongPosition = strategy.position_size > 0
isInShortPosition = strategy.position_size < 0

/// ProfitView Alert Syntax String Generation
// ░░░░░░░░░░░░░░░░░░░░░░░░░░░░░░░░░░░░░░░░░░░░░░░░░░░░░░░░░░░░░░░░░░░░░░░░░░░░░░░░░░░░░░░░░░░░░░░░░░░░░░░░░░░░░░░░░░░░░░░░░░░░░░░░░░░░░░░░░░░░░░░░░░

alertSyntaxPrefix = input.string(defval='CRYPTANEX_99FTX_Strategy-Name-Here', title='Alert Syntax Prefix', group='ProfitView Alert Syntax')
alertSyntaxBase = alertSyntaxPrefix + '\n#' + str.tostring(open) + ',' + str.tostring(high) + ',' + str.tostring(low) + ',' + str.tostring(close) + ',' + str.tostring(volume) + ','


/// Trade Execution
// ░░░░░░░░░░░░░░░░░░░░░░░░░░░░░░░░░░░░░░░░░░░░░░░░░░░░░░░░░░░░░░░░░░░░░░░░░░░░░░░░░░░░░░░░░░░░░░░░░░░░░░░░░░░░░░░░░░░░░░░░░░░░░░░░░░░░░░░░░░░░░░░░░░

longConditionCalc = (longCondition and isADXEnabledAndAboveThreshold)
shortConditionCalc = (shortCondition and isADXEnabledAndAboveThreshold)

if calcPeriod
    if longConditionCalc and tradeDirection != 'Short Only' and isInLongPosition == false
        strategy.entry('Long', strategy.long, qty=contracts)

        alert(message=alertSyntaxBase + 'side:long', freq=alert.freq_once_per_bar_close)

    if shortConditionCalc and tradeDirection != 'Long Only' and isInShortPosition == false
        strategy.entry('Short', strategy.short, qty=contracts)

        alert(message=alertSyntaxBase + 'side:short', freq=alert.freq_once_per_bar_close)

    //Inspired from Multiple %% profit exits example by adolgo https://www.tradingview.com/script/kHhCik9f-Multiple-profit-exits-example/
    strategy.exit('TP1', qty_percent=q1, profit=per(tp1))
    strategy.exit('TP2', qty_percent=q2, profit=per(tp2))
    strategy.exit('TP3', qty_percent=q3, profit=per(tp3))
    strategy.exit('TP4', profit=per(tp4))

    strategy.close('Long', qty_percent=100, comment='SL Long', when=slLongClose)
    strategy.close('Short', qty_percent=100, comment='SL Short', when=slShortClose)

    strategy.close_all(when=closeLongCondition or closeShortCondition, comment='Close Postion')

/// Dashboard
// ░░░░░░░░░░░░░░░░░░░░░░░░░░░░░░░░░░░░░░░░░░░░░░░░░░░░░░░░░░░░░░░░░░░░░░░░░░░░░░░░░░░░░░░░░░░░░░░░░░░░░░░░░░░░░░░░░░░░░░░░░░░░░░░░░░░░░░░░░░░░░░░░░░
// Inspired by https://www.tradingview.com/script/uWqKX6A2/ - Thanks VertMT

showDashboard = input.bool(group="Dashboard", title="Show Dashboard", defval=false)

f_fillCell(_table, _column, _row, _title, _value, _bgcolor, _txtcolor) =>
    _cellText = _title + "\n" + _value
    table.cell(_table, _column, _row, _cellText, bgcolor=_bgcolor, text_color=_txtcolor, text_size=size.auto)

// Draw dashboard table
if showDashboard
    var bgcolor = color.new(color.black,0)

    // Keep track of Wins/Losses streaks
    newWin  = (strategy.wintrades  > strategy.wintrades[1]) and (strategy.losstrades == strategy.losstrades[1]) and (strategy.eventrades == strategy.eventrades[1])
    newLoss = (strategy.wintrades == strategy.wintrades[1]) and (strategy.losstrades  > strategy.losstrades[1]) and (strategy.eventrades == strategy.eventrades[1])

    varip int winRow     = 0
    varip int lossRow    = 0
    varip int maxWinRow  = 0
    varip int maxLossRow = 0

    if newWin
        lossRow := 0
        winRow := winRow + 1
    if winRow > maxWinRow
        maxWinRow := winRow

    if newLoss
        winRow := 0
        lossRow := lossRow + 1
    if lossRow > maxLossRow
        maxLossRow := lossRow


    // Prepare stats table
    var table dashTable = table.new(position.bottom_right, 1, 15, border_width=1)


    if barstate.islastconfirmedhistory
        // Update table
        dollarReturn = strategy.netprofit
        f_fillCell(dashTable, 0, 0, "Start:", str.format("{0,date,long}", strategy.closedtrades.entry_time(0)) , bgcolor, color.white) // + str.format(" {0,time,HH:mm}", strategy.closedtrades.entry_time(0))
        f_fillCell(dashTable, 0, 1, "End:", str.format("{0,date,long}", strategy.opentrades.entry_time(0)) , bgcolor, color.white) // + str.format(" {0,time,HH:mm}", strategy.opentrades.entry_time(0))
        _profit = (strategy.netprofit / strategy.initial_capital) * 100
        f_fillCell(dashTable, 0, 2, "Net Profit:", str.tostring(_profit, '##.##') + "%", _profit > 0 ? color.green : color.red, color.white)
        _numOfDaysInStrategy = (strategy.opentrades.entry_time(0) - strategy.closedtrades.entry_time(0)) / (1000 * 3600 * 24)
        f_fillCell(dashTable, 0, 3, "Percent Per Day", str.tostring(_profit / _numOfDaysInStrategy, '#########################.#####')+"%", _profit > 0 ? color.green : color.red, color.white)
        _winRate = ( strategy.wintrades / strategy.closedtrades ) * 100
        f_fillCell(dashTable, 0, 4, "Percent Profitable:", str.tostring(_winRate, '##.##') + "%", _winRate < 50 ? color.red : _winRate < 75 ? #999900 : color.green, color.white)
        f_fillCell(dashTable, 0, 5, "Profit Factor:", str.tostring(strategy.grossprofit / strategy.grossloss,  '##.###'), strategy.grossprofit > strategy.grossloss ? color.green : color.red, color.white)
        f_fillCell(dashTable, 0, 6, "Total Trades:", str.tostring(strategy.closedtrades), bgcolor, color.white)
        f_fillCell(dashTable, 0, 8, "Max Wins In A Row:", str.tostring(maxWinRow, '######') , bgcolor, color.white)
        f_fillCell(dashTable, 0, 9, "Max Losses In A Row:", str.tostring(maxLossRow, '######') , bgcolor, color.white)