Strategi perdagangan jangka pendek mengikuti tren
Tanggal Pembuatan:
2024-01-04 17:52:21
Akhirnya memodifikasi:
2024-01-04 17:52:21
menyalin:
3
Jumlah klik:
704
1
fokus pada
1750
Pengikut
Ringkasan
Strategi ini didasarkan pada indikator penilaian tren ADX rata-rata indeks tren dan kombinasi rata-rata, untuk menilai dan melacak tren. Ketika penilaian muncul, pembalikan tren, menggunakan operasi pemecahan, untuk melakukan perdagangan garis pendek.
Prinsip Strategi
- Menggunakan indeks tren rata-rata ADX untuk menentukan arah tren. Ketika ADX lebih besar dari 20, berarti saat ini dalam kondisi tren.
- EMA digunakan sebagai indikator untuk menilai tren, EMA Gold Fork menunjukkan tren naik, dan Dead Fork menunjukkan tren turun.
- VWAP sebagai harga acuan penting, harga di atas VWAP adalah pasar multihead, di bawahnya adalah pasar kosong.
- Berdasarkan beberapa indikator di atas untuk menilai tren dan pembalikan pasar, melakukan operasi terobosan, melacak tren untuk melakukan perdagangan pendek.
Analisis Keunggulan
- Menggabungkan beberapa indikator untuk menentukan arah tren, untuk menilai tren besar dengan akurat.
- VWAP sebagai harga acuan penting untuk menghindari perdagangan di zona tidak valid.
- ADX menilai bahwa ada tren dan kemudian melakukan operasi untuk mengurangi transaksi yang tidak valid.
- Operasi penembusan lebih sukses, sesuai dengan tren operasional.
Analisis risiko
- Probabilitas kegagalan penembusan menyebabkan stop loss ada. Risiko dapat dikurangi dengan mengoptimalkan posisi stop loss.
- Jika Anda memiliki banyak transaksi, Anda dapat mengalami kerugian dalam satu transaksi. Anda dapat menyesuaikan jumlah posisi dengan tepat untuk mengurangi kerugian dalam satu transaksi.
- Pilihan waktu perdagangan dan jenis perdagangan juga mempengaruhi kinerja strategi. Anda dapat menguji waktu perdagangan yang berbeda dan jenis perdagangan yang berbeda.
Arah optimasi
- Optimalkan parameter ADX untuk menemukan tren yang lebih baik dan nilai ADX yang disusun.
- Optimalkan kombinasi parameter garis rata untuk menemukan kombinasi garis rata yang lebih baik yang mewakili tren.
- Mengoptimalkan posisi stop loss. Memperluas jangkauan stop loss dengan tepat untuk menghindari biaya stop loss yang terlalu tinggi.
- Optimalkan ukuran posisi. Kurangi risiko transaksi tunggal.
Meringkaskan
Strategi ini menggunakan indikator garis rata, indikator penilaian tren, dan harga acuan penting untuk menilai tren besar dengan tepat; dan ketika menilai tren berbalik, gunakan operasi pemecahan untuk melacak tren, dan melakukan perdagangan garis pendek. Dengan mengoptimalkan parameter, kinerja strategi dapat ditingkatkan lebih lanjut.
Kode Sumber Strategi
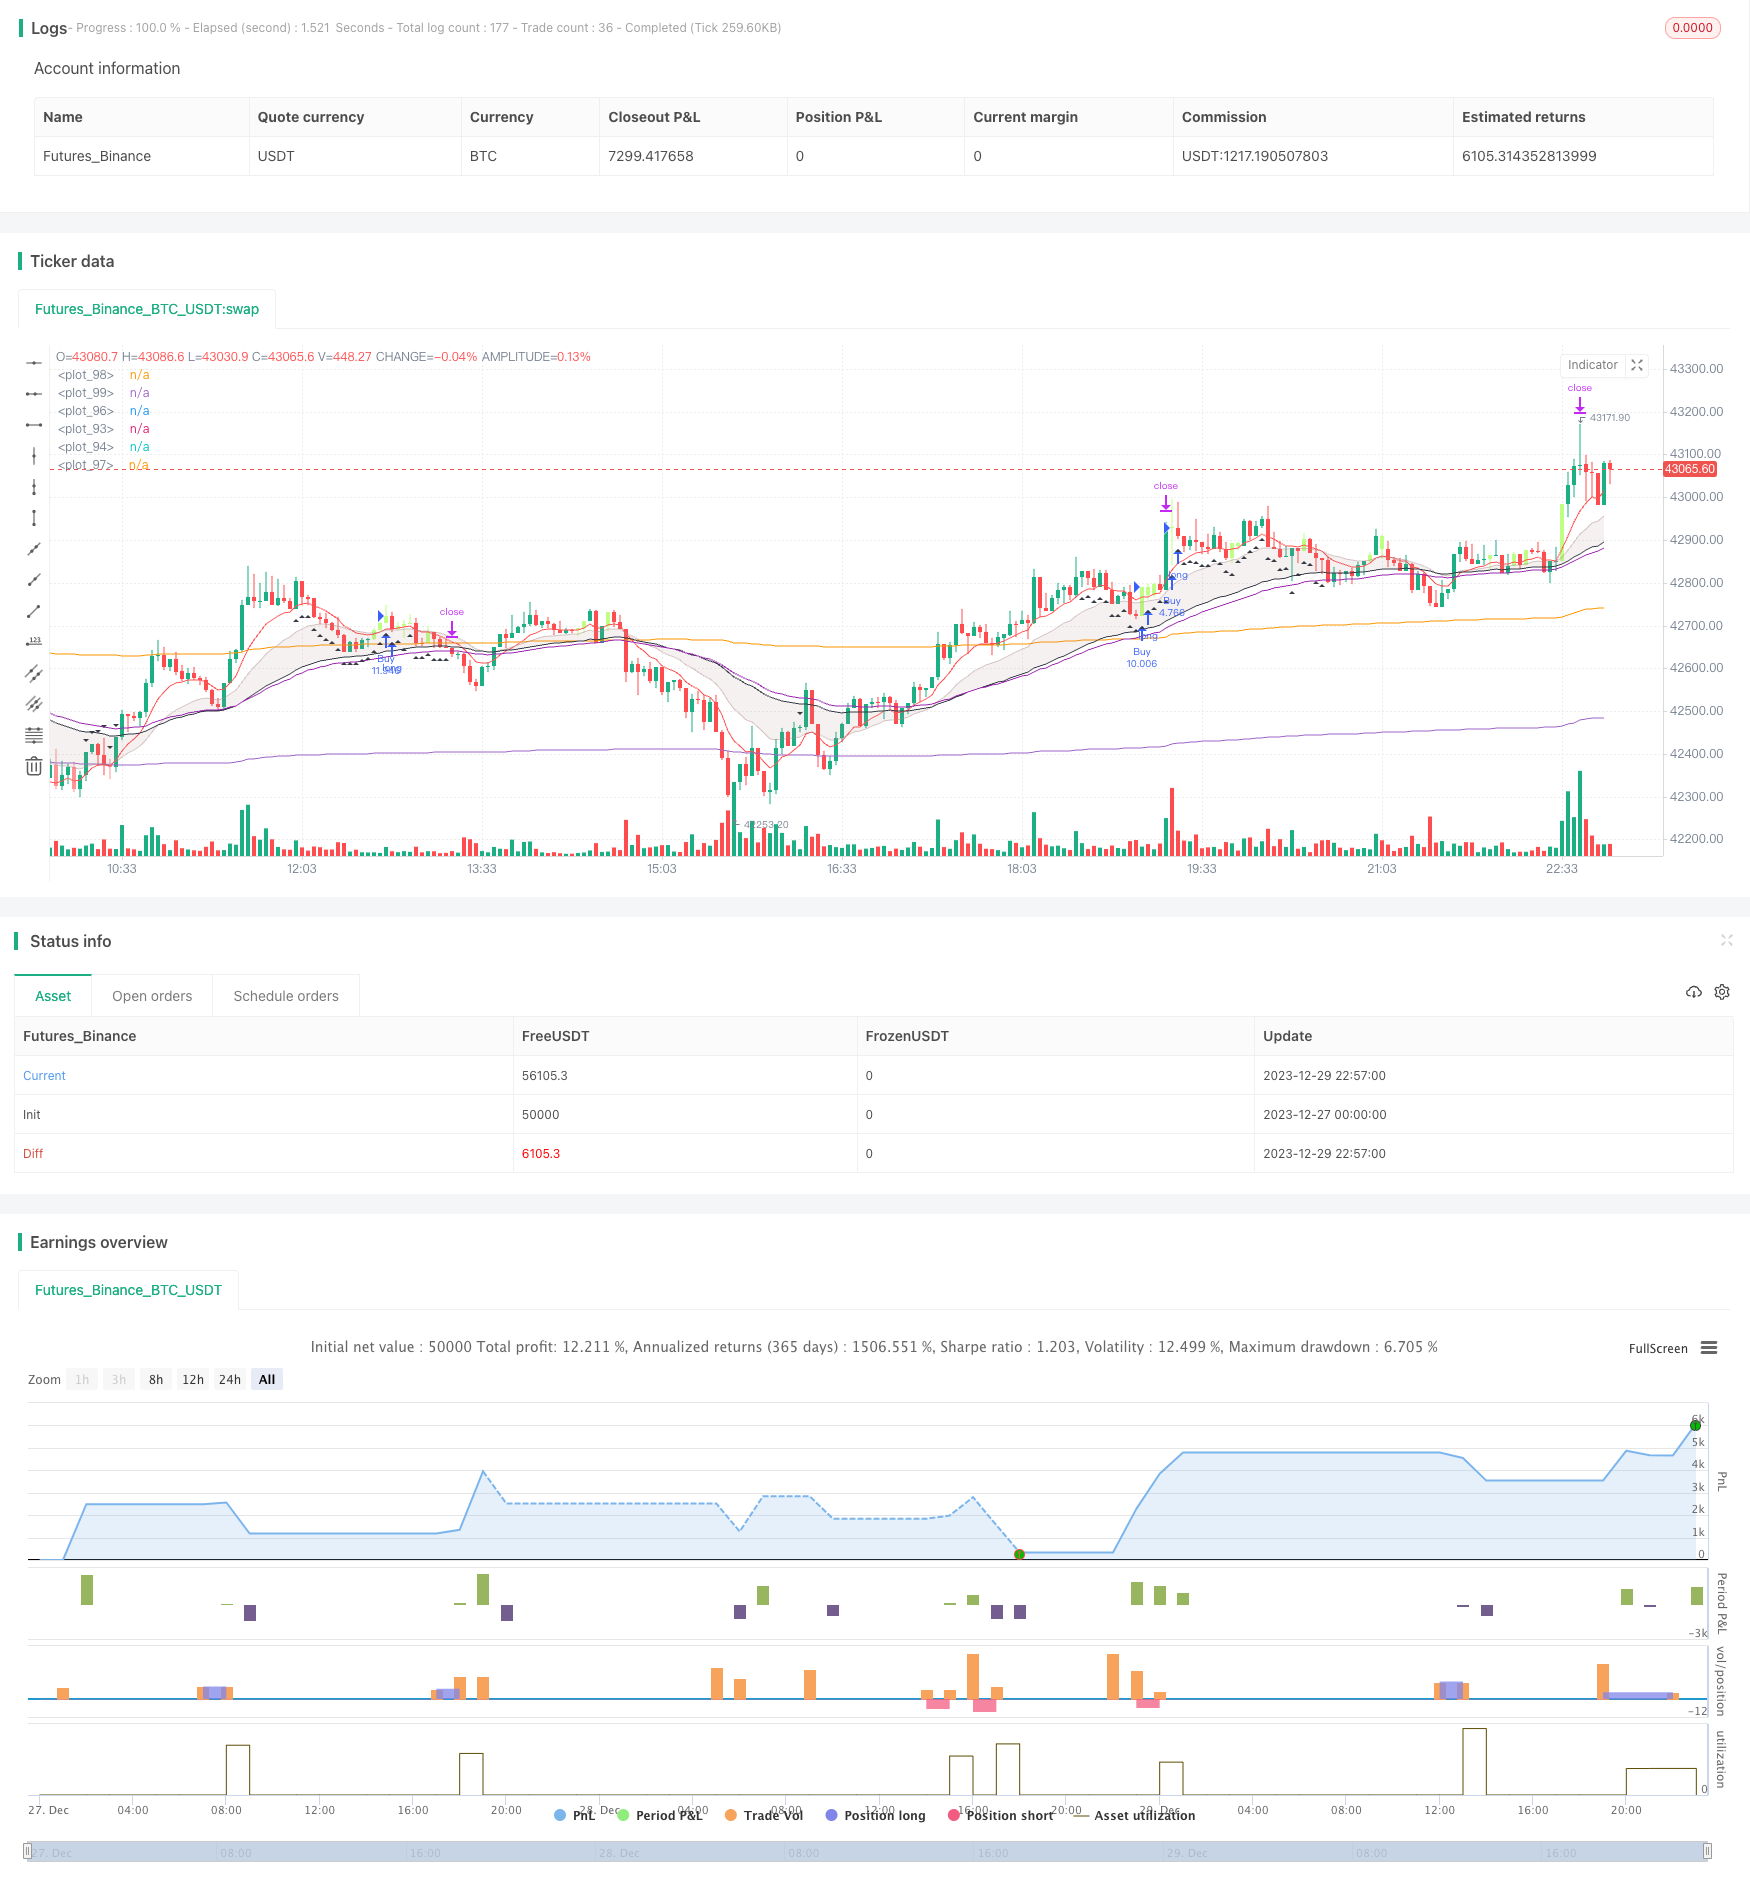
/*backtest
start: 2023-12-27 00:00:00
end: 2023-12-29 23:00:00
period: 3m
basePeriod: 1m
exchanges: [{"eid":"Futures_Binance","currency":"BTC_USDT"}]
*/

// This source code is subject to the terms of the Mozilla Public License 2.0 at https://mozilla.org/MPL/2.0/
// © mariocastel

//@version=5
strategy("Wave Rider", overlay=true, initial_capital = 100000)

session = input(defval = "1400-1500", title = "Session Time")
t = not na(time(timeframe.period,session))
RR = input.float(1.5, "Risk to reward", step=0.5)
var bool movetoBE = input(false, "Move to Break Even")
BE = input.float(1, "Break Even at", step=0.5)

vwap_mult = 0.001 * input(3, "VWAP Multiplier")
aboveVWAP = ta.vwap(close) * (1 + vwap_mult)
belowVWAP = ta.vwap(close) * (1 - vwap_mult)
sym = input("BTC_USDT:swap", "VWAP Source")

QQQaboveVWAP = request.security(sym, "3", aboveVWAP)
QQQbelowVWAP = request.security(sym, "3", belowVWAP)
QQQclose = request.security(sym, "3", close)

ema20 = ta.ema(close, 20)
ema50 = ta.ema(close, 50)
ema60 = ta.ema(close, 60)
ema9 = ta.ema(close, 9)

opentrades = strategy.opentrades > 0

aboveEMA = close > ema60
belowEMA = close < ema60

uptrend = aboveEMA and aboveEMA[1] and aboveEMA[2] and aboveEMA[3] and aboveEMA[4] and aboveEMA[5] and aboveEMA[6] and aboveEMA[7] and aboveEMA[8] and aboveEMA[9] and aboveEMA[10] and aboveEMA[11] and aboveEMA[12] and aboveEMA[13] and aboveEMA[14] and aboveEMA[15] and aboveEMA[16] and aboveEMA[17] and aboveEMA[18] and aboveEMA[19] and aboveEMA[20] and aboveEMA[21] and aboveEMA[22] and aboveEMA[23] and aboveEMA[24] and aboveEMA[25] and aboveEMA[26] and aboveEMA[27] and aboveEMA[28] and aboveEMA[29]
downtrend = belowEMA and belowEMA[1] and belowEMA[2] and belowEMA[3] and belowEMA[4] and belowEMA[5] and belowEMA[6] and belowEMA[7] and belowEMA[8] and belowEMA[9] and belowEMA[10] and belowEMA[11] and belowEMA[12] and belowEMA[13] and belowEMA[14] and belowEMA[15] and belowEMA[16] and belowEMA[17] and belowEMA[18] and belowEMA[19] and belowEMA[20] and belowEMA[21] and belowEMA[22] and belowEMA[23] and belowEMA[24] and belowEMA[25] and belowEMA[26] and belowEMA[27] and belowEMA[28] and belowEMA[29]

buy = (low < ema20 and low > ema50 and close > ema9) and QQQclose > QQQaboveVWAP  or (low[1] < ema20 and low[1] > ema50 and close > ema9) and QQQclose > QQQaboveVWAP and uptrend
sell = (high > ema20 and high < ema50 and close < ema9) and QQQclose < QQQbelowVWAP  or (high[1] > ema20 and high[1] < ema50 and close < ema9) and QQQclose < QQQbelowVWAP and downtrend

var float entry = na
var float sl = na
var float qty = na
var float tp = na
var float be = na

if ema20 > ema50 and ema9 > ema20
    if buy and not opentrades and t and uptrend
        alert("Wave Rider Setup")
        entry := close
        sl := ema50
        qty := 1000/(close - sl) * 1
        if close - sl > syminfo.mintick*300
            tp := close + ((close - sl)*1)
        else
            tp := close + ((close - sl)*RR)
        be := close + ((close - sl)*BE)
        strategy.entry("Buy", strategy.long, qty=qty)
        strategy.exit("Close Buy", "Buy",qty=qty, stop=sl, limit=tp)

if ema20 < ema50 and ema9 < ema20
    if sell and not opentrades and t and downtrend
        alert("Wave Rider Setup")
        entry := close
        sl := ema50
        qty := 1000/(sl - close) * 1
        if sl - close > syminfo.mintick*300
            tp := close - ((sl - close)*1)
        else
            tp := close - ((sl - close)*RR)
        be := close - ((sl - close)*BE)
        strategy.entry("Sell", strategy.short, qty=qty)
        strategy.exit("Close Sell", "Sell", qty=qty, stop=sl, limit=tp)

// Adjust BEs
if movetoBE == true
    if strategy.position_size > 0
        if high >= be
            sl := entry
            strategy.cancel("Close Buy")
            strategy.exit("Close Buy", "Buy", qty=qty, stop=sl, limit=tp)
    if strategy.position_size < 0
        if low <= be
            sl := entry
            strategy.cancel("Close Sell")
            strategy.exit("Close Sell", "Sell", qty=qty, stop=sl, limit=tp)


EoD_time = timestamp(year, month, dayofmonth, 15, 58, 00)
EoD = time == EoD_time
if EoD
    strategy.close_all()

barcolor(color=buy ? color.rgb(191, 255, 131): na)
barcolor(color=sell ? color.rgb(255, 149, 149): na)
ema20plot = plot(ema20, color=color.rgb(168, 131, 131, 55))
ema50plot = plot(ema50, color=color.black)
fill(ema20plot, ema50plot, color=color.rgb(168, 131, 131, 85))
plot(ema9, color=color.red)
plot(ema60, color=color.purple)
plot(QQQaboveVWAP)
plot(QQQbelowVWAP)
plotshape(uptrend, style=shape.triangleup, location=location.belowbar, color=color.black)
plotshape(downtrend, style=shape.triangledown, location=location.abovebar, color=color.black)