Strategi Perdagangan Ayunan Dukungan dan Perlawanan
Tanggal Pembuatan:
2024-01-25 15:53:06
Akhirnya memodifikasi:
2024-01-25 15:53:06
menyalin:
2
Jumlah klik:
603
1
fokus pada
1750
Pengikut
Ringkasan
Strategi ini memungkinkan kontrol yang tepat atas logika perdagangan dan stop loss yang tepat dengan menggabungkan strategi silang RSI, indikator acak, dan strategi pengoptimalan titik geser posisi kosong. Selain itu, dengan memperkenalkan sinyal pengoptimalan, Anda dapat mengendalikan tren dengan lebih baik dan mengelola dana Anda dengan lebih baik.
Prinsip Strategi
- Indikator RSI menilai zona overbought dan oversold, yang membentuk sinyal perdagangan dengan nilai K dan D dari indikator acak.
- Memperkenalkan pengidentifikasian klasifikasi pada garis K, untuk membantu menilai sinyal tren, menghindari perdagangan yang salah.
- Garis rata-rata SMA membantu menentukan arah tren. Ketika garis rata-rata jangka pendek dari bawah ke atas menembus garis rata-rata jangka panjang, itu adalah sinyal bullish.
- Strategi titik geser posisi datar, mengatur harga stop loss berdasarkan kisaran pergerakan harga tertinggi dan harga terendah.
Analisis Keunggulan
- Parameter RSI dioptimalkan untuk mengindentifikasi zona overbought dan oversold dan menghindari kesalahan perdagangan
- Optimasi parameter indikator STO, pengaturan parameter kelancaran, dapat menghapus kebisingan, meningkatkan kualitas sinyal
- Memperkenalkan analisis teknis Heikin-Ashi untuk mengidentifikasi perubahan arah entitas garis K dan memastikan keakuratan sinyal perdagangan
- SMA rata-rata membantu menentukan arah tren besar, menghindari perdagangan berlawanan
- Tergabung dengan strategi stop-loss slippoint, Anda dapat mengunci keuntungan maksimum dari setiap perdagangan
Analisis risiko
- Investor berisiko besar jika pasar saham terus turun
- Frekuensi transaksi mungkin terlalu tinggi, meningkatkan biaya transaksi dan biaya slippage
- Indikator RSI mudah terbentuk sinyal palsu, harus digabungkan dengan indikator lain filter
Optimasi Strategi
- Adaptasi parameter RSI untuk mengoptimalkan penilaian overbought dan oversold
- Menyesuaikan parameter indikator STO, kelancaran dan siklus untuk meningkatkan kualitas sinyal
- Adaptasi siklus rata-rata bergerak untuk mengoptimalkan penilaian tren
- Menggunakan lebih banyak indikator teknis untuk meningkatkan akurasi sinyal
- Optimalkan Stop Loss Ratio, Kurangi Risiko Perdagangan Tunggal
Meringkaskan
Strategi ini mengintegrasikan keunggulan dari berbagai indikator teknologi utama, mencapai keseimbangan antara kualitas sinyal perdagangan dan stop loss dengan optimasi parameter dan penyempurnaan aturan. Memiliki beberapa universalitas dan stabilitas profitabilitas. Dengan pengoptimalan berkelanjutan, tingkat kemenangan dan profitabilitas dapat ditingkatkan lebih lanjut.
Kode Sumber Strategi
/*backtest
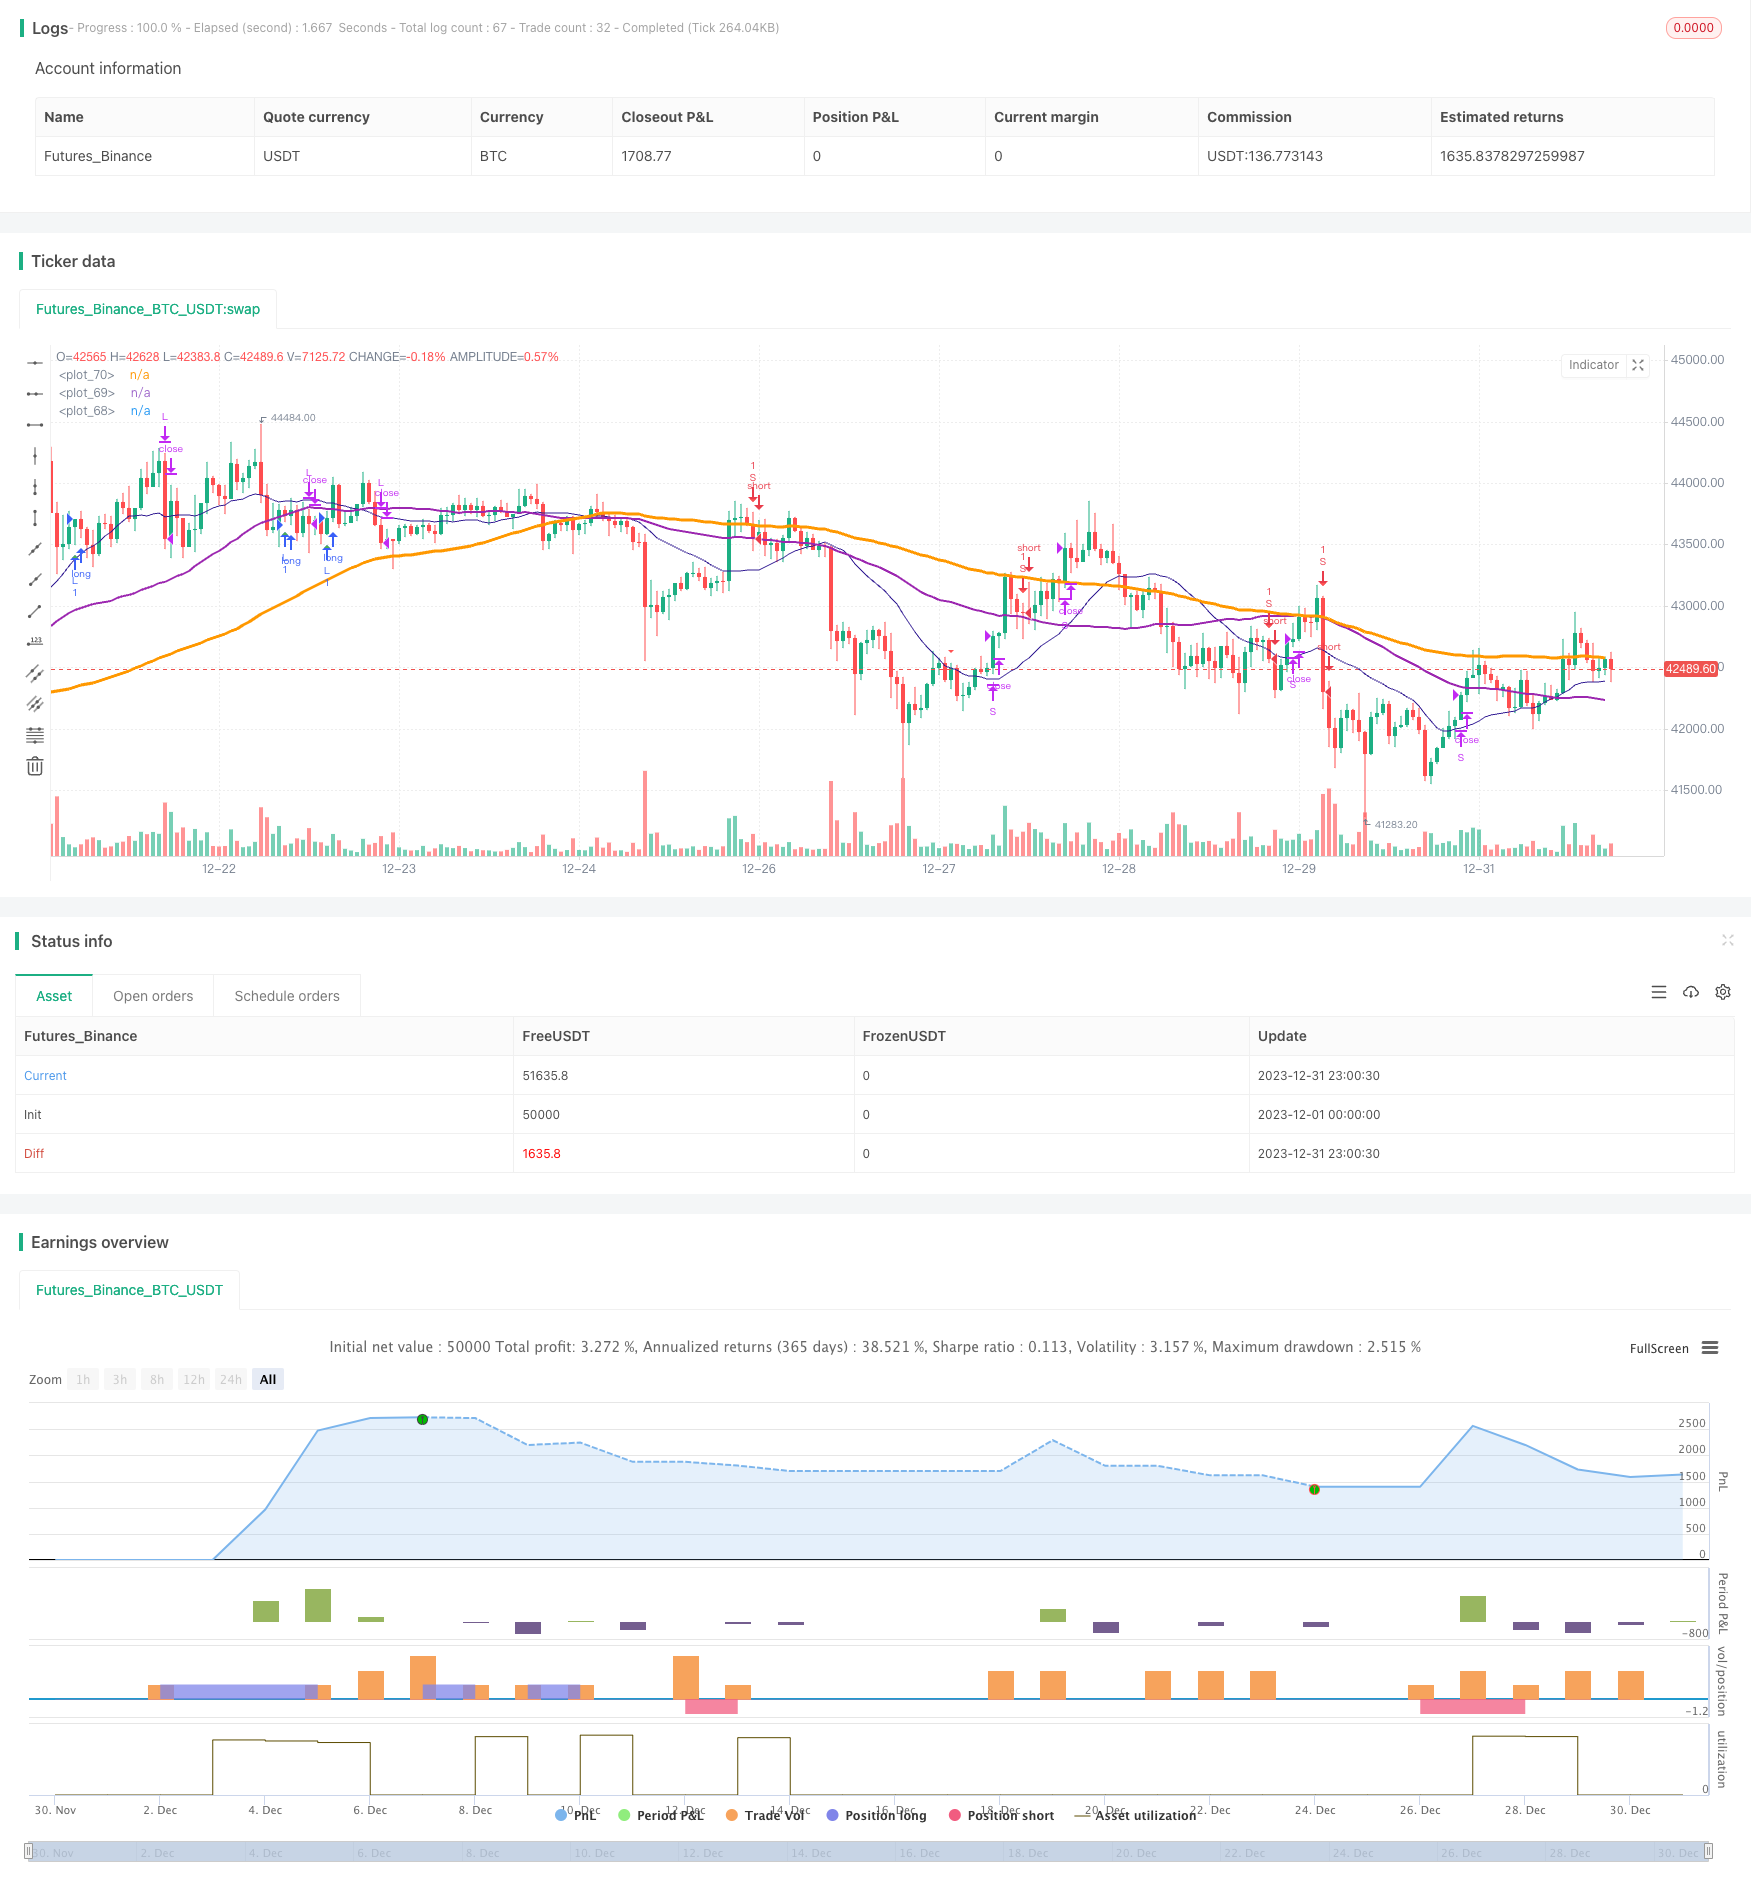
start: 2023-12-01 00:00:00
end: 2023-12-31 23:59:59
period: 1h
basePeriod: 15m
exchanges: [{"eid":"Futures_Binance","currency":"BTC_USDT"}]
*/
//@version=4
//study(title="@sentenzal strategy", shorttitle="@sentenzal strategy", overlay=true)
strategy(title="@sentenzal strategy", shorttitle="@sentenzal strategy", overlay=true )
smoothK = input(3, minval=1)
smoothD = input(3, minval=1)
lengthRSI = input(14, minval=1)
lengthStoch = input(14, minval=1)
overbought = input(80, minval=1)
oversold = input(20, minval=1)
smaLengh = input(100, minval=1)
smaLengh2 = input(50, minval=1)
smaLengh3 = input(20, minval=1)
src = input(close, title="RSI Source")
testStartYear = input(2017, "Backtest Start Year")
testStartMonth = input(1, "Backtest Start Month")
testStartDay = input(1, "Backtest Start Day")
testPeriodStart = timestamp(testStartYear,testStartMonth,testStartDay,0,0)
testPeriod() =>
time >= testPeriodStart ? true : false
rsi1 = rsi(src, lengthRSI)
k = sma(stoch(rsi1, rsi1, rsi1, lengthStoch), smoothK)
d = sma(k, smoothD)
crossBuy = crossover(k, d) and k < oversold
crossSell = crossunder(k, d) and k > overbought
dcLower = lowest(low, 10)
dcUpper = highest(high, 10)
heikinashi_close = security(heikinashi(syminfo.tickerid), timeframe.period, close)
heikinashi_open = security(heikinashi(syminfo.tickerid), timeframe.period, open)
heikinashi_low = security(heikinashi(syminfo.tickerid), timeframe.period, low)
heikinashi_high = security(heikinashi(syminfo.tickerid), timeframe.period, high)
heikinashiPositive = heikinashi_close >= heikinashi_open
heikinashiBuy = heikinashiPositive == true and heikinashiPositive[1] == false and heikinashiPositive[2] == false
heikinashiSell = heikinashiPositive == false and heikinashiPositive[1] == true and heikinashiPositive[2] == true
//plotshape(heikinashiBuy, style=shape.arrowup, color=green, location=location.belowbar, size=size.tiny)
//plotshape(heikinashiSell, style=shape.arrowdown, color=red, location=location.abovebar, size=size.tiny)
buy = (crossBuy == true or crossBuy[1] == true or crossBuy[2] == true) and (heikinashiBuy == true or heikinashiBuy[1] == true or heikinashiBuy[2] == true)
sell = (crossSell == true or crossSell[1] == true or crossSell[2] == true) and (heikinashiSell == true or heikinashiSell[1] == true or heikinashiSell[2] == true)
mult = timeframe.period == '15' ? 4 : 1
mult2 = timeframe.period == '240' ? 0.25 : mult
movingAverage = sma(close, round(smaLengh))
movingAverage2 = sma(close, round(smaLengh2))
movingAverage3 = sma(close, round(smaLengh3))
uptrend = movingAverage < movingAverage2 and movingAverage2 < movingAverage3 and close > movingAverage
downtrend = movingAverage > movingAverage2 and movingAverage2 > movingAverage3 and close < movingAverage
signalBuy = (buy[1] == false and buy[2] == false and buy == true) and uptrend
signalSell = (sell[1] == false and sell[2] == false and sell == true) and downtrend
takeProfitSell = (buy[1] == false and buy[2] == false and buy == true) and uptrend == false
takeProfitBuy = (sell[1] == false and sell[2] == false and sell == true) and uptrend
plotshape(signalBuy, style=shape.triangleup, color=green, location=location.belowbar, size=size.tiny)
plotshape(signalSell, style=shape.triangledown, color=red, location=location.abovebar, size=size.tiny)
plot(movingAverage, linewidth=3, color=orange, transp=0)
plot(movingAverage2, linewidth=2, color=purple, transp=0)
plot(movingAverage3, linewidth=1, color=navy, transp=0)
alertcondition(signalBuy, title='Signal Buy', message='Signal Buy')
alertcondition(signalSell, title='Signal Sell', message='Signal Sell')
strategy.close("L", when=dcLower[1] > low)
strategy.close("S", when=dcUpper[1] < high)
strategy.entry("L", strategy.long, 1, when = signalBuy and testPeriod() and uptrend)
strategy.entry("S", strategy.short, 1, when = signalSell and testPeriod() and uptrend ==false)
//strategy.exit("Exit Long", from_entry = "L", loss = 25000000, profit=25000000)
//strategy.exit("Exit Short", from_entry = "S", loss = 25000000, profit=25000000)