TrendHunter w/MF: Strategi Tren Multi Timeframe

Ikhtisar
Strategi Tren Multi-Kerangka Waktu TrendHunter w/MF adalah strategi pengikut tren yang didasarkan pada beberapa indikator teknis dan analisis multi-kerangka waktu. Strategi ini mempertimbangkan secara komprehensif faktor-faktor seperti Awan Ichimoku, rata-rata pergerakan, SuperTrend, WaveTrend, dan Arus Dana, serta menentukan titik masuk melalui kondisi yang ketat untuk menangkap tren utama pasar.
Prinsip Strategi
Prinsip inti dari strategi ini adalah analisis komprehensif berdasarkan beberapa indikator teknis pada beberapa kerangka waktu. Secara spesifik:
-
Awan Ichimoku (Ichimoku): Menentukan tren pasar saat ini dengan menganalisis posisi relatif harga terhadap awan, serta posisi relatif rata-rata pergerakan terhadap awan. Ketika harga berada di atas awan dan rata-rata pergerakan juga berada di atas awan, dianggap sebagai tren naik; sebaliknya dianggap sebagai tren turun.
-
SuperTrend: Mengonfirmasi tren pasar saat ini dengan menganalisis posisi relatif harga terhadap SuperTrend. Ketika harga berada di atas SuperTrend, dianggap sebagai tren naik; sebaliknya dianggap sebagai tren turun.
-
WaveTrend: Menentukan tren pasar saat ini dengan menganalisis arah dan posisi indikator WaveTrend. Ketika WaveTrend naik dan belum mencapai zona overbought, dianggap sebagai tren naik; ketika WaveTrend turun dan belum mencapai zona oversold, dianggap sebagai tren turun.
-
Arus Dana (MoneyFlow): Mengonfirmasi tren pasar saat ini dengan menganalisis status indikator Arus Dana. Ketika Arus Dana positif, dianggap sebagai tren naik; sebaliknya dianggap sebagai tren turun.
Saat strategi mengambil posisi long, ia mensyaratkan harga di atas awan, rata-rata pergerakan di atas awan, SuperTrend naik, WaveTrend naik dan belum mencapai zona overbought, serta Arus Dana positif. Untuk posisi short, kebalikannya. Penyaringan ketat multi-indikator dan multi-kerangka waktu ini secara efektif dapat menghindari perdagangan yang sering terjadi di pasar yang berombak, sehingga meningkatkan stabilitas dan keandalan strategi.
Analisis Keunggulan
-
Penilaian komprehensif multi-indikator, keandalan tinggi: Strategi ini mempertimbangkan secara komprehensif beberapa indikator teknis yang saling melengkapi dalam kondisi pasar yang berbeda, sehingga dapat mencerminkan tren pasar secara menyeluruh dan menghindari kesalahan yang mungkin terjadi pada indikator tunggal.
-
Kondisi masuk yang ketat, menghindari perdagangan yang sering: Strategi menetapkan kondisi masuk yang ketat; beberapa indikator harus terpenuhi secara bersamaan untuk masuk, yang secara efektif menghindari perdagangan yang sering di pasar yang berombak dan mengurangi kerugian strategi.
-
Analisis multi-kerangka waktu, menangkap tren besar: Strategi menganalisis pada beberapa kerangka waktu, yang membantu strategi menangkap tren utama pasar dari perspektif yang lebih luas dan menghindari gangguan dari kebisingan jangka pendek.
-
Strategi stop loss yang jelas, risiko terkendali: Strategi menggunakan SuperTrend sebagai kondisi stop loss. Begitu tren pasar berubah, strategi dapat segera melakukan stop loss, membatasi kerugian dalam kisaran yang dapat diterima.
Analisis Risiko
-
Kurangnya penyesuaian dinamis, kemampuan beradaptasi terhadap perubahan pasar terbatas: Parameter strategi ini tetap dan tidak memiliki kemampuan untuk menyesuaikan secara dinamis berdasarkan kondisi pasar. Ketika kondisi pasar berubah secara signifikan, strategi mungkin menjadi tidak efektif.
-
Kondisi masuk terlalu ketat, mungkin melewatkan peluang: Kondisi masuk strategi sangat ketat. Meskipun ini menghindari perdagangan yang sering, hal ini juga dapat menyebabkan strategi melewatkan beberapa peluang masuk yang baik.
-
Adaptabilitas terhadap situasi pasar ekstrem tidak diketahui: Strategi berkinerja baik dalam kondisi pasar normal, tetapi adaptabilitasnya terhadap situasi ekstrem, seperti perubahan tren yang cepat dan besar, masih perlu diuji.
-
Strategi stop loss relatif sederhana, masih ada ruang optimasi: Saat ini strategi hanya menggunakan SuperTrend sebagai kondisi stop loss. Meskipun sederhana dan jelas, strategi stop loss masih dapat dioptimalkan lebih lanjut untuk mengontrol risiko dengan lebih baik.
Arah Optimasi
-
Memperkenalkan penilaian kondisi pasar, menyesuaikan parameter secara dinamis: Dapat dipertimbangkan untuk memperkenalkan beberapa indikator penilaian kondisi pasar, seperti indikator volatilitas, dan secara dinamis menyesuaikan parameter strategi sesuai dengan perubahan kondisi pasar untuk beradaptasi dengan lingkungan pasar yang berbeda.
-
Mengoptimalkan kondisi masuk, meningkatkan sensitivitas: Dapat dipertimbangkan untuk melakukan beberapa optimasi pada kondisi masuk, seperti memperkenalkan lebih banyak indikator konfirmasi, untuk meningkatkan sensitivitas strategi sambil mempertahankan keandalan, sehingga menangkap lebih banyak peluang perdagangan.
-
Menambahkan langkah-langkah untuk merespons situasi pasar ekstrem: Untuk situasi pasar ekstrem, seperti perubahan tren yang cepat dan besar, dapat dipertimbangkan untuk memperkenalkan beberapa langkah khusus, seperti memperketat stop loss atau menghentikan sementara perdagangan, untuk mengurangi risiko strategi dalam kondisi ekstrem.
-
Mengoptimalkan strategi stop loss, meningkatkan kemampuan pengendalian risiko: Dapat dipertimbangkan untuk memperkenalkan lebih banyak kondisi stop loss, seperti stop loss berdasarkan waktu, stop loss berdasarkan persentase, atau memperkenalkan strategi stop loss dinamis seperti trailing stop, untuk mengontrol risiko dengan lebih baik.
Kesimpulan
Strategi Tren Multi-Kerangka Waktu TrendHunter w/MF adalah strategi pengikut tren yang didasarkan pada analisis multi-indikator dan multi-kerangka waktu. Dengan mempertimbangkan secara komprehensif faktor-faktor seperti Awan Ichimoku, rata-rata pergerakan, SuperTrend, WaveTrend, dan Arus Dana, kondisi masuk yang ketat, serta analisis multi-kerangka waktu, strategi ini dapat dengan andal menangkap tren utama pasar, menghindari perdagangan yang sering di pasar yang berombak, serta memiliki stabilitas dan keandalan yang baik.
Pada saat yang sama, strategi ini juga memiliki beberapa keterbatasan dan risiko, seperti kurangnya kemampuan penyesuaian dinamis, kondisi masuk yang mungkin terlalu ketat, adaptabilitas terhadap situasi pasar ekstrem yang tidak diketahui, serta strategi stop loss yang relatif sederhana. Ini adalah arah optimasi dan perbaikan di masa depan untuk strategi ini.
Secara keseluruhan, Strategi Tren Multi-Kerangka Waktu TrendHunter w/MF adalah strategi pengikut tren yang memiliki potensi baik. Saat menggunakan strategi ini, trader harus sepenuhnya memahami prinsip, keunggulan, dan risikonya, serta melakukan penyesuaian dan optimasi yang diperlukan sesuai dengan toleransi risiko dan gaya trading mereka sendiri. Pada saat yang sama, mereka juga harus memantau dengan cermat perubahan kondisi pasar dan menyesuaikan strategi tepat waktu untuk beradaptasi dengan perubahan pasar. Hanya dengan pemahaman yang mendalam dan penggunaan yang hati-hati, strategi ini dapat memanfaatkan potensi keunggulannya dan memberikan keuntungan yang stabil bagi trader.
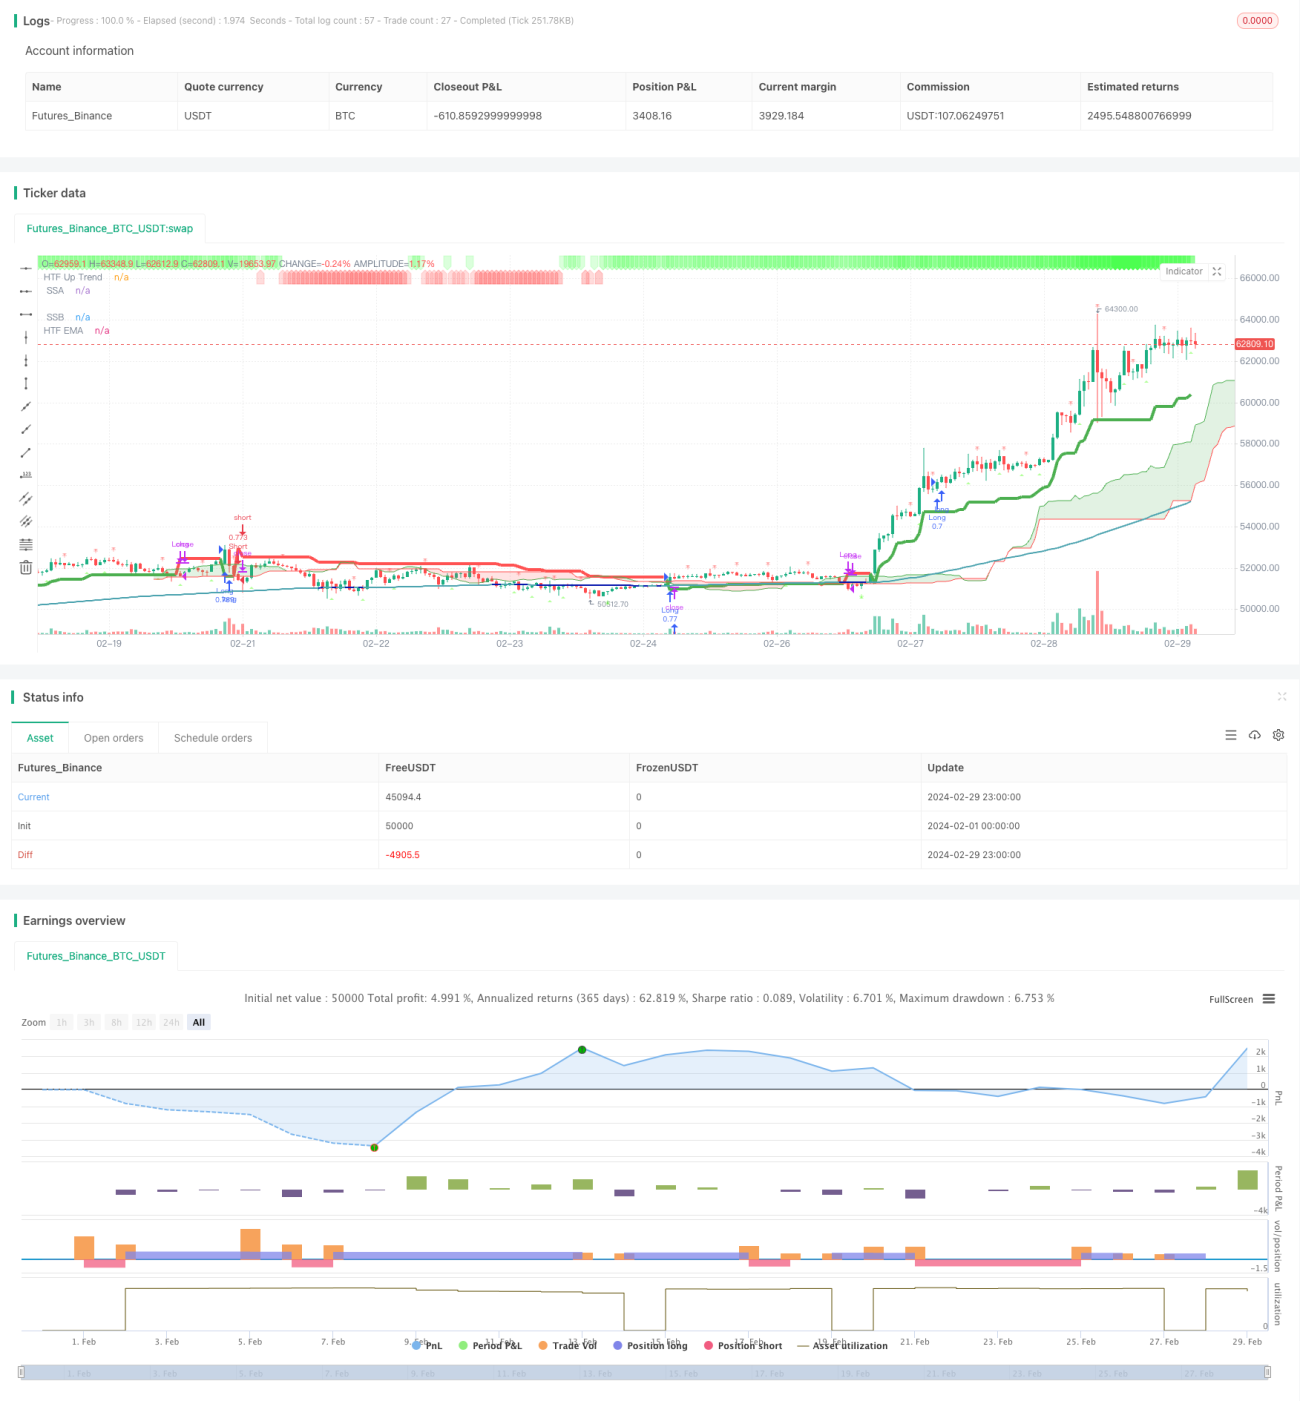
/*backtest
start: 2024-02-01 00:00:00
end: 2024-02-29 23:59:59
period: 1h
basePeriod: 15m
exchanges: [{"eid":"Futures_Binance","currency":"BTC_USDT"}]
*/

// This Pine Script™ code is subject to the terms of the Mozilla Public License 2.0 at https://mozilla.org/MPL/2.0/
// © godzcopilot / blockybears

// Thanks to anthonyf50 for his MTF Ichimoku https://www.tradingview.com/script/Pw9cBFma/- 1