Strategi Mengikuti Pullback Rata-rata Pergerakan
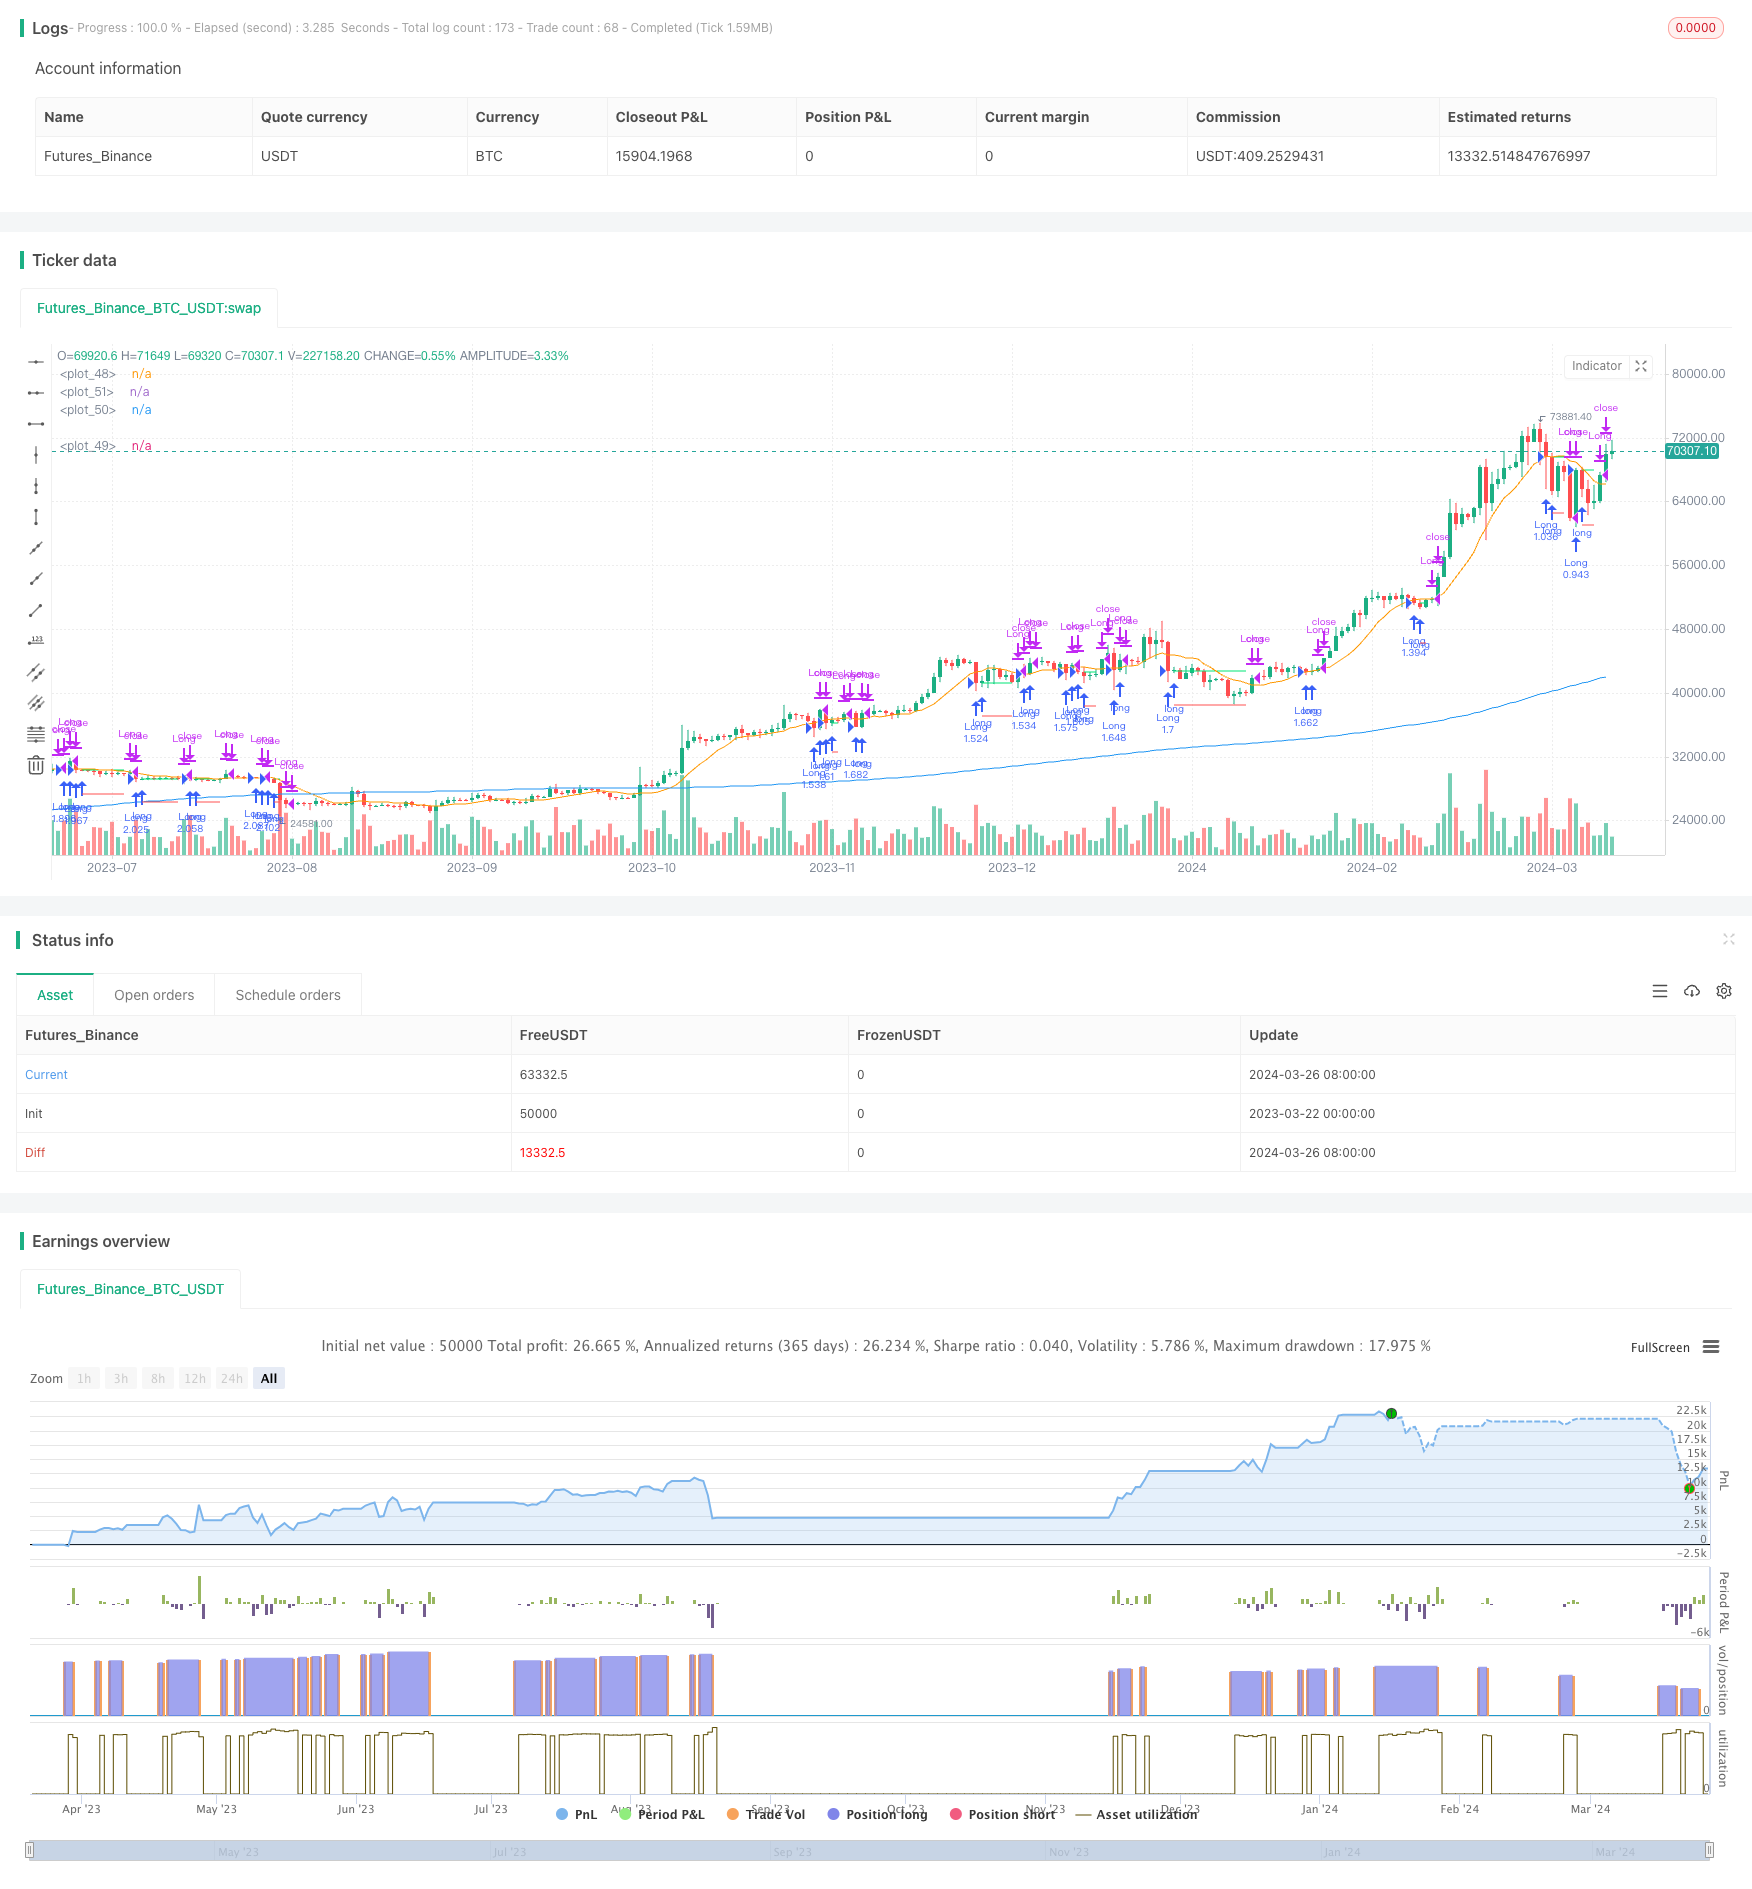
Ringkasan
Strategi ini menggunakan moving averages dari dua periode yang berbeda untuk menangkap peluang rebound setelah market reversal. Strategi ini membuka posisi lebih banyak ketika harga berada di atas rata-rata jangka panjang dan terjadi reversal ke arah rata-rata jangka pendek, dan posisi rata ketika harga kembali ke rata-rata jangka pendek atau menyentuh harga stop loss. Strategi ini berusaha untuk mengambil keuntungan dari tren dengan mencari peluang untuk membeli reversal dalam tren.
Prinsip Strategi
- Hitung moving average dari dua periode yang berbeda ((MA1 dan MA2), di mana MA1 adalah rata-rata jangka panjang dan MA2 adalah rata-rata jangka pendek.
- Ketika harga penutupan berada di atas MA1 dan di bawah MA2 dan tidak memiliki posisi saat ini, dan saat ini dalam jangka waktu perdagangan yang ditetapkan, strategi membuka posisi lebih banyak.
- Catat harga buyPrice saat membuka posisi, dan hitung stopPrice ((i.e. persentase penurunan harga i_stopPercent) )
- Bila harga penutupan kembali ke MA2 dan i_lowerClose adalah false, atau harga penutupan jatuh dari harga stopPrice, maka strategi ini akan dipadamkan.
- Jika i_lowerClose adalah true, maka posisi akan ditutup pada saat harga ditutup di atas MA2 dan pada saat harga ditutup di bawah MA2 pada garis K sebelumnya.
Keunggulan Strategis
- Pelacakan tren: menentukan tren saat ini dengan menilai hubungan posisi harga dengan garis rata-rata jangka panjang, mencari peluang masuk dalam tren.
- Pembelian kembali: Mencari peluang untuk membeli kembali harga ke garis rata-rata jangka pendek dalam tren naik, meningkatkan rasio harga untuk membeli poin.
- Perlindungan Stop Loss: Menetapkan harga stop loss, yang secara otomatis melonggarkan posisi ketika harga berbalik mencapai tingkat tertentu, untuk secara efektif mengendalikan risiko penurunan.
- Fleksibilitas parameter: pengguna dapat secara fleksibel mengatur periode rata-rata, persentase stop loss, dan parameter lainnya sesuai dengan preferensi mereka.
Risiko Strategis
- Optimasi parameter: Berbagai pengaturan parameter memiliki pengaruh besar terhadap kinerja strategi, dan perlu untuk mengoptimalkan parameter dan pengujian ulang di berbagai lingkungan pasar untuk menemukan kombinasi parameter terbaik.
- Pasar bergoyang: Dalam pasar bergoyang, harga sering berfluktuasi di antara garis rata-rata jangka panjang, yang dapat menyebabkan strategi sering membuka posisi kosong, yang mengurangi biaya transaksi.
- Pembalikan tren: Ketika tren pasar terjadi, strategi mungkin mengalami kerugian berturut-turut. Saat ini perlu untuk menilai perubahan tren dalam kombinasi dengan indikator atau sinyal lainnya, dan menyesuaikan strategi tepat waktu.
- Black Swan Event: Ketika terjadi peristiwa besar di pasar yang tidak dapat diprediksi, dapat menyebabkan harga turun naik secara drastis, dan memicu strategi stop loss yang lebih besar.
Arah optimasi strategi
- Pengertian tren: Masukkan lebih banyak indikator pengertian tren, seperti ADX, sebelum membuka posisi, untuk mengkonfirmasi kekuatan dan arah tren saat ini, meningkatkan akurasi sinyal untuk membuka posisi.
- Stop loss dinamis: Berdasarkan volatilitas harga, ATR, dan indikator lainnya, stop loss disesuaikan secara dinamis, dengan stop loss yang lebih longgar saat harga berfluktuasi lebih besar, dan stop loss yang lebih ketat saat harga berfluktuasi lebih kecil.
- Manajemen posisi: Sesuai dengan kekuatan tren pasar, faktor-faktor seperti volatilitas harga, secara dinamis menyesuaikan ukuran posisi setiap kali membuka posisi, meningkatkan posisi saat tren kuat dan volatilitas sedang, mengurangi posisi saat tren lemah atau volatilitas terlalu tinggi.
- Perlindungan multi-posisi: Pertimbangkan untuk memantau sinyal dari kedua belah pihak pada saat yang sama, dan pertahankan posisi di pasar atau siklus yang berbeda untuk mengurangi risiko keseluruhan strategi.
Meringkaskan
Strategi pelacakan reversal moving average menggunakan hubungan posisi relatif dari dua garis rata-rata berkala yang berbeda, untuk menangkap banyak peluang untuk melakukan reversal harga dalam tren naik. Strategi ini berlaku untuk pasar tren, dengan pengaturan parameter dan stop loss yang tepat, dapat memperoleh keuntungan yang stabil dalam situasi tren.
/*backtest
start: 2023-03-22 00:00:00
end: 2024-03-27 00:00:00
period: 1d
basePeriod: 1h
exchanges: [{"eid":"Futures_Binance","currency":"BTC_USDT"}]
*/

// This Pine Script™ code is subject to the terms of the Mozilla Public License 2.0 at https://mozilla.org/MPL/2.0/
// © contapessoal_ivan
// @version=5
strategy("Pullback Strategy",
     overlay=true,
     initial_capital=1000,
     default_qty_type=strategy.percent_of_equity,
     default_qty_value=100, // 100% of balance invested on each trade
     commission_type=strategy.commission.cash_per_contract,
     commission_value=0.005) // Interactive Brokers rate

// Get user input
i_ma1           = input.int(title="MA 1 Length", defval=200, step=10, group="Strategy Parameters", tooltip="Long-term MA")
i_ma2           = input.int(title="MA 2 Length", defval=10, step=10, group="Strategy Parameters", tooltip="Short-term MA")
i_stopPercent   = input.float(title="Stop Loss Percent", defval=0.10, step=0.1, group="Strategy Parameters", tooltip="Failsafe Stop Loss Percent Decline")
i_lowerClose    = input.bool(title="Exit On Lower Close", defval=false, group="Strategy Parameters", tooltip="Wait for a lower-close before exiting above MA2")
i_startTime     = input(title="Start Filter", defval=timestamp("26 Jan 2023 00:00 +0000"), group="Time Filter", tooltip="Start date & time to begin searching for setups")
i_endTime       = input(title="End Filter", defval=timestamp("26 Mar 2024 23:59 +0000"), group="Time Filter", tooltip="End date & time to stop searching for setups")

// Get indicator values
ma1 = ta.sma(close, i_ma1)
ma2 = ta.sma(close, i_ma2)

// Check filter(s)
f_dateFilter = true

// Check buy/sell conditions
var float buyPrice = 0
buyCondition    = close > ma1 and close < ma2 and strategy.position_size == 0 and f_dateFilter
sellCondition   = close > ma2 and strategy.position_size > 0 and (not i_lowerClose or close < low[1])
stopDistance    = strategy.position_size > 0 ? ((buyPrice - close) / close) : na
stopPrice       = strategy.position_size > 0 ? buyPrice - (buyPrice * i_stopPercent) : na
stopCondition   = strategy.position_size > 0 and stopDistance > i_stopPercent

// Enter positions
if buyCondition
    strategy.entry(id="Long", direction=strategy.long)

if buyCondition[1]
    buyPrice := open

// Exit positions
if sellCondition or stopCondition
    strategy.close(id="Long", comment="Exit" + (stopCondition ? "SL=true" : ""))
    buyPrice := na

// Draw pretty colors
plot(buyPrice, color=color.lime, style=plot.style_linebr)
plot(stopPrice, color=color.red, style=plot.style_linebr, offset=-1)
plot(ma1, color=color.blue)
plot(ma2, color=color.orange)